
An official website of the United States government
An official website of the United States government
The .gov means it's official.
Federal government websites often end in .gov or .mil. Before sharing sensitive information,
make sure you're on a federal government site.
The site is secure.
The
https:// ensures that you are connecting to the official website and that any
information you provide is encrypted and transmitted securely.
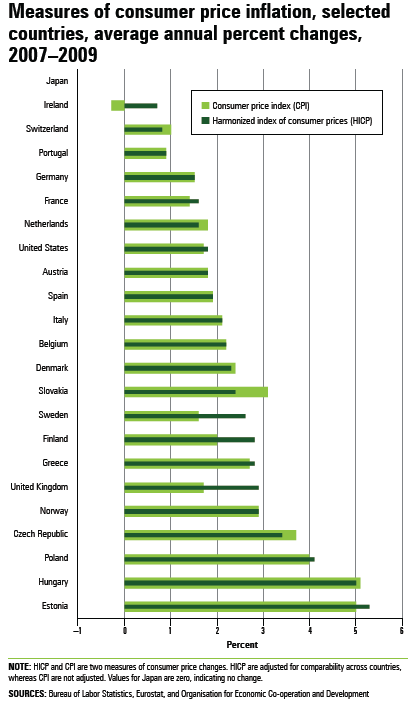
Consumer price indexes (CPI) and harmonized indexes of consumer prices (HICP) measure the change over time in the prices paid by consumers for a fixed selection, or market basket, of goods and services. Price indexes are used primarily to adjust income payments for changes in the cost of living and to compute inflation-adjusted measures of other economic series.
Consumer price indexes (CPI) and harmonized indexes of consumer prices (HICP) for most countries are from the BLS report International Indexes of Consumer Prices 18 countries and areas, 1996-2009. Data for the remaining countries are based on data from the Organisation for Economic Co-operation and Development (OECD) database OECD.Stat, the European Commission database Eurostat, and national statistical offices (for the Philippines, Singapore, and Taiwan).
Each country produces its own consumer price index using unique methods and concepts. For this reason, CPI data are not fully comparable across countries. Differences exist mainly in population coverage, frequency of market basket weight changes, and treatment of homeowner costs.
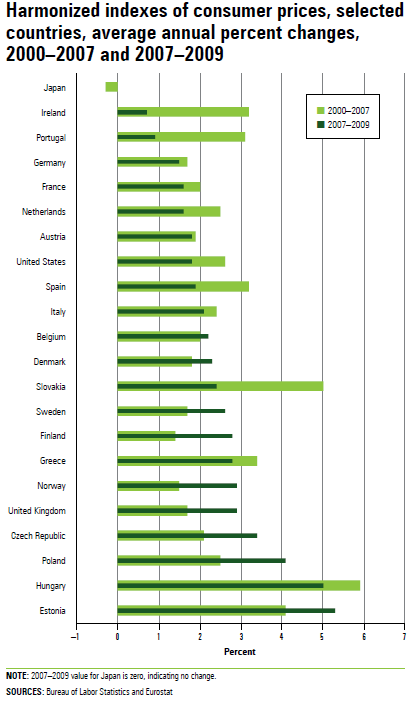
The HICP is an internationally comparable measure of consumer price inflation. The HICP is the standard price index that European Union member states must produce for comparisons across countries. HICP data for the United States are an experimental BLS series. Although the HICP series for the United States broadly follows the European Union definitions, some differences remain in the frequency of market basket weight changes, aggregation methods, and quality adjustments.
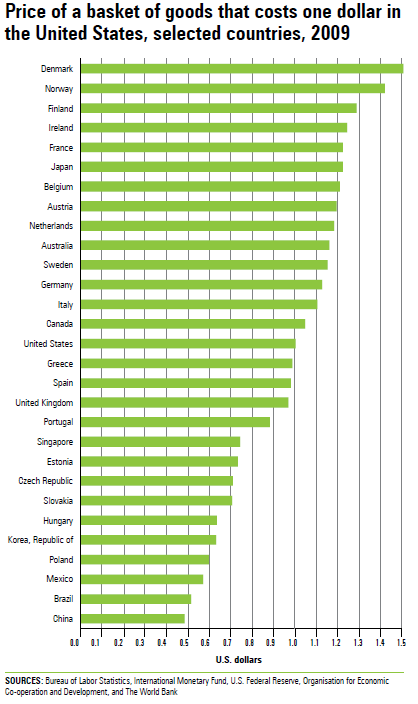
Relative prices for most countries are from the BLS report International Comparisons of GDP per Capita and per Hour, 1960–2009. Data for the remaining countries are based on PPP from OECD.Stat and the World Bank database World Development Indicators, and on market exchange rates from the U.S. Federal Reserve, the International Monetary Fund’s International Financial Statistics publication, and OECD.Stat.
The relationship between purchasing power parities (PPP) and market exchange rates can be used to estimate comparative, or relative, prices of goods and services in different countries. Relative prices are calculated by dividing PPP by market exchange rates. The resulting values indicate the domestic price, expressed in U.S. dollars, of a basket of goods that would cost exactly one dollar in the United States. Consequently, values less than 1 indicate that prices in that country are relatively low, compared with the United States. Values greater than 1 indicate that prices in a particular country are relatively high, compared with the United States.
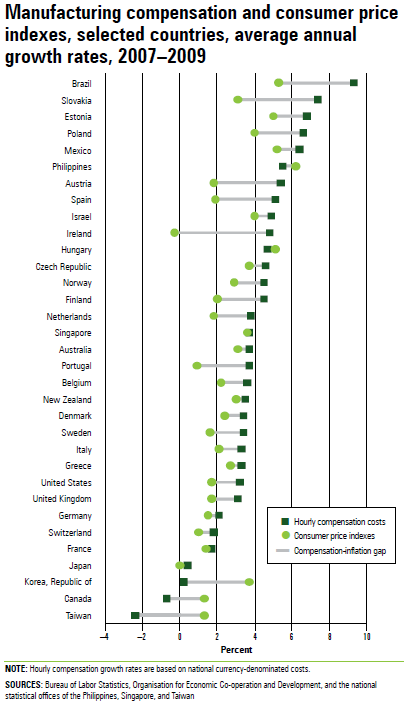
Compensation costs refer to average hourly compensation costs for all employees in manufacturing. (See section 3 Notes.) Consumer price indexes (CPI) are a measure of the average change over time in the prices paid by consumers for a market basket of consumer goods and services. CPI and annual percent changes are based on national CPI as published by each country. They have not been adjusted for comparability. Harmonized indexes of consumer prices (HICP) are an internationally comparable measure of consumer price inflation based on European Union definitions. The index represents urban and rural households in each country and excludes the component for owneroccupied housing costs. Purchasing power parities (PPP) are currency conversion rates that allow output in different currency units to be expressed in a common unit of value. A PPP is the ratio between the number of units of a country’s currency and the number of U.S. dollars required to purchase an equivalent market basket of goods and services within each respective country.
Last Modified Date: August 2, 2011