
An official website of the United States government
An official website of the United States government
The .gov means it's official.
Federal government websites often end in .gov or .mil. Before sharing sensitive information,
make sure you're on a federal government site.
The site is secure.
The
https:// ensures that you are connecting to the official website and that any
information you provide is encrypted and transmitted securely.
Crossref 0
Industry employment and output projections to 2024, Monthly Labor Review, 2015.
Communication Competence, The International Encyclopedia of Organizational Communication, 2017.
Black–White Earnings Gap among Restaurant Servers: A Replication, Extension, and Exploration of Consumer Racial Discrimination in Tipping, Sociological Inquiry, 2014.
Achievement of Weight Loss and Other Requirements of the Diabetes Prevention and Recognition Program, The Diabetes Educator, 2016.
Consumer spending and U.S. employment from the 2007–2009 recession through 2022, Monthly Labor Review, 2014.
The health care and social assistance sector will account for almost a third of the projected job growth from 2012 to 2022. Employment in the construction sector is expected to see a large increase, while still not reaching prerecession levels. Manufacturing is projected to experience a slight decline in employment over the projection period.
The recession that began in December 2007 and ended in June 20091 had a major impact on both real output and employment. Although the recession ended in 2009, total employment, which tends to lag in recovery, did not begin to rebound until 2011.2 Employment in some sectors, such as health care and social assistance, grew over the recession period, seemingly unaffected by adverse economic conditions, while employment in other sectors, such as construction and manufacturing, experienced declines. Every 2 years, the Bureau of Labor Statistics (BLS) provides employment projections that look at long-term employment trends. Because the recession affected sectors and industries differently, the expected employment growth over the projection period reflects the relative effects of the recession as employment growth continues on or returns to long-term trends. Given that BLS is looking at longer term trends, the industry-level discussion in this article assumes that the economy is at or near full employment. Within that context, the article presents the industry-level perspective of the BLS employment projections.
BLS projects that total employment in the United States will reach 161.0 million in 2022, up 15.6 million from the 2012 level of 145.4 million.3 This growth represents a 1.0-percent annual rate of increase, which is faster than the 0.2-percent rate of increase experienced during the 2002–2012 period. The majority of the growth in employment can be attributed to an increase in the number of nonagricultural wage and salary workers, who will account for more than 98 percent of projected jobs in the upcoming period. Employment of these workers is expected to rise by 15.3 million, to reach almost 149.8 million in 2022.4 The remaining increase in employment—an increase of 527,700 jobs—is expected to come from nonagricultural self-employed and unpaid family workers, whose employment is projected to reach 9.3 million by 2022. The number of agricultural workers, which includes wage and salary workers, self-employed people, and unpaid family workers, is expected to decline by 223,500. (See table 1.)
| Industry sector | Thousands of jobs | Change | Percent distribution | Annual rate of change | ||||||
|---|---|---|---|---|---|---|---|---|---|---|
| 2002 | 2012 | 2022 | 2002–2012 | 2012–2022 | 2002 | 2012 | 2022 | 2002 –2012 | 2012 –2022 | |
| Total(1) | 142,294.9 | 145,355.8 | 160,983.7 | 3,060.9 | 15,627.9 | 100.0 | 100.0 | 100.0 | 0.2 | 1.0 |
| Nonagriculture wage and salary(2) | 131,028.3 | 134,427.6 | 149,751.3 | 3,399.3 | 15,323.7 | 92.1 | 92.5 | 93.0 | .3 | 1.1 |
| Goods producing, excluding agriculture | 22,486.7 | 18,360.3 | 19,554.2 | 1,193.9 | 15.8 | 12.6 | 12.1 | –2.0 | .6 | |
| Mining | 512.3 | 800.5 | 921.7 | 288.2 | 121.2 | .4 | .6 | .6 | 4.6 | 1.4 |
| Construction | 6,715.7 | 5,640.9 | 7,263.0 | –1,074.8 | 1,622.1 | 4.7 | 3.9 | 4.5 | –1.7 | 2.6 |
| Manufacturing | 15,258.7 | 11,918.9 | 11,369.4 | –3,339.8 | –549.5 | 10.7 | 8.2 | 7.1 | –2.4 | –.5 |
| Service providing | 108,541.6 | 116,067.3 | 130,197.1 | 7,525.7 | 14,129.8 | 76.3 | 79.9 | 80.9 | .7 | 1.2 |
| Utilities | 596.3 | 554.2 | 497.8 | –42.1 | –56.4 | .4 | .4 | .3 | –.7 | –1.1 |
| Wholesale trade | 5,652.4 | 5,672.8 | 6,143.2 | 20.4 | 470.4 | 4.0 | 3.9 | 3.8 | .0 | .8 |
| Retail trade | 15,025.1 | 14,875.3 | 15,966.2 | –149.8 | 1,090.9 | 10.6 | 10.2 | 9.9 | –.1 | .7 |
| Transportation and warehousing | 4,223.8 | 4,414.7 | 4,742.0 | 190.9 | 327.3 | 3.0 | 3.0 | 2.9 | .4 | .7 |
| Information | 3,394.6 | 2,677.6 | 2,612.4 | –717.0 | –65.2 | 2.4 | 1.8 | 1.6 | –2.3 | –.2 |
| Financial activities | 7,847.1 | 7,786.3 | 8,537.3 | –60.8 | 751.0 | 5.5 | 5.4 | 5.3 | –.1 | .9 |
| Professional and business services | 15,976.2 | 17,930.2 | 21,413.0 | 1,954.0 | 3,482.8 | 11.2 | 12.3 | 13.3 | 1.2 | 1.8 |
| Educational services | 2,642.8 | 3,346.9 | 4,022.2 | 704.1 | 675.3 | 1.9 | 2.3 | 2.5 | 2.4 | 1.9 |
| Health care and social assistance | 13,555.6 | 16,971.8 | 21,965.9 | 3,416.2 | 4,994.1 | 9.5 | 11.7 | 13.6 | 2.3 | 2.6 |
| Leisure and hospitality | 11,986.0 | 13,745.8 | 15,035.0 | 1,759.8 | 1,289.2 | 8.4 | 9.5 | 9.3 | 1.4 | .9 |
| Other services | 6,129.0 | 6,174.5 | 6,823.4 | 45.5 | 648.9 | 4.3 | 4.2 | 4.2 | .1 | 1.0 |
| Federal government | 2,766.0 | 2,814.0 | 2,406.5 | 48.0 | –407.5 | 1.9 | 1.9 | 1.5 | .2 | –1.6 |
| State and local government | 18,746.7 | 19,103.2 | 20,032.2 | 356.5 | 929.0 | 13.2 | 13.1 | 12.4 | .2 | .5 |
| Agriculture, forestry, fishing, and hunting(3) | 2,245.4 | 2,112.7 | 1,889.2 | –132.7 | –223.5 | 1.6 | 1.5 | 1.2 | –.6 | –1.1 |
| Agriculture wage and salary | 1,217.4 | 1,306.9 | 1,281.8 | 89.5 | –25.1 | .9 | .9 | .8 | .7 | –.2 |
| Agriculture self-employed and unpaid family workers | 1,028.0 | 805.8 | 607.4 | –222.2 | –198.4 | .7 | .6 | .4 | –2.4 | –2.8 |
| Nonagriculture self-employed and unpaid family workers | 9,021.2 | 8,815.5 | 9,343.2 | –205.7 | 527.7 | 6.3 | 6.1 | 5.8 | –.2 | .6 |
| Notes: (2) Includes wage and salary data from the Current Employment Statistics survey, except for data on private households, which are from the Current Population Survey. Logging workers are excluded. (3) Includes agriculture, forestry, fishing, and hunting data from the Current Population Survey, except for data on logging, which are from the Current Employment Statistics survey. Government wage and salary workers are excluded. Source: U.S. Bureau of Labor Statistics, Employment Projections Program. | ||||||||||
Real output is projected to increase by almost $7.0 trillion (in chain-weighted 2005 dollars),5 from $23.2 trillion in 2012 to nearly $30.2 trillion in 2022, a 2.6-percent annual growth rate. This increase is larger and faster than the increase of $2.2 trillion, an annual growth rate of 1.0 percent, seen between 2002 and 2012. The majority of output growth over the projection period is expected to come from the service-providing sectors. Between 2012 and 2022, real output in these sectors is projected to rise from $16.1 trillion to almost $21.0 trillion, a 2.6-percent-per-year rate of increase. This growth rate is faster than the 1.5-percent-per-year rate of increase seen in the 2002–2012 period. The service-providing sectors are expected to increase their share of nominal output from 68.3 percent in 2012 to 69.4 percent in 2022. This increase continues the growth trend seen in the previous decade. The goods-producing sectors, excluding agriculture, are projected to increase their real output from $5.6 trillion in 2012 to nearly $7.4 trillion in 2022, an annual rate of increase of 2.7 percent. This increase is a reversal from the 0.4-percent-per-year decline experienced in the previous decade, in which real output fell from nearly $5.9 trillion in 2002 to just above $5.6 trillion in 2012. The share of nominal output attributed to the goods-producing sectors is expected to decline from 25.4 percent in 2012 to 24.5 percent in 2022. This fall continues the declining trend seen in the previous decade. Real output in the agriculture, forestry, fishing, and hunting sector is expected to increase by $69.2 billion, from $307.3 billion in 2012 to $376.5 billion in 2022, a 2.1-percent-per-year rate of increase. This annual growth rate is faster than the growth rate of 1.1 percent experienced between 2002 and 2012. The share of nominal output for the agricultural sector is expected to fall from 1.5 percent in 2012 to 1.2 percent in 2022. (See table 2.)
| Industry sector | Billions of chained 2005 dollars | Annual rate of change | Billions of dollars | Percent distribution | |||||||
|---|---|---|---|---|---|---|---|---|---|---|---|
| 2002 | 2012 | 2022 | 2002 –2012 | 2012 –2022 | 2002 | 2012 | 2022 | 2002 | 2012 | 2022 | |
| Total | 21,007.5 | 23,229.0 | 30,150.1 | 1.0 | 2.6 | 18,874.9 | 28,159.5 | 44,176.4 | 100.0 | 100.0 | 100.0 |
| Goods producing, excluding agriculture | 5,862.5 | 5,648.3 | 7,367.2 | –0.4 | 2.7 | 5,007.6 | 7,161.6 | 10,820.4 | 26.5 | 25.4 | 24.5 |
| Mining | 382.9 | 473.5 | 598.9 | 2.1 | 2.4 | 188.7 | 547.9 | 1,051.6 | 1.0 | 1.9 | 2.4 |
| Construction | 1,165.4 | 773.8 | 1,160.1 | –4.0 | 4.1 | 970.6 | 1,008.9 | 1,926.7 | 5.1 | 3.6 | 4.4 |
| Manufacturing | 4,320.8 | 4,407.6 | 5,604.8 | .2 | 2.4 | 3,848.3 | 5,604.8 | 7,842.1 | 20.4 | 19.9 | 17.8 |
| Service providing | 13,900.0 | 16,140.8 | 20,957.1 | 1.5 | 2.6 | 12,715.1 | 19,232.4 | 30,657.8 | 67.4 | 68.3 | 69.4 |
| Utilities | 403.4 | 317.5 | 397.1 | –2.4 | 2.3 | 320.4 | 388.2 | 612.1 | 1.7 | 1.4 | 1.4 |
| Wholesale trade | 945.0 | 1,115.8 | 1,597.6 | 1.7 | 3.7 | 894.0 | 1,331.1 | 2,042.6 | 4.7 | 4.7 | 4.6 |
| Retail trade | 1,069.6 | 1,271.3 | 1,747.5 | 1.7 | 3.2 | 1,030.9 | 1,391.9 | 2,083.6 | 5.5 | 4.9 | 4.7 |
| Transportation and warehousing | 646.8 | 688.0 | 913.2 | .6 | 2.9 | 579.2 | 871.2 | 1,383.3 | 3.1 | 3.1 | 3.1 |
| Information | 957.4 | 1,185.9 | 1,669.9 | 2.2 | 3.5 | 959.6 | 1,293.8 | 2,139.3 | 5.1 | 4.6 | 4.8 |
| Financial activities | 2,749.0 | 3,164.8 | 4,329.3 | 1.4 | 3.2 | 2,527.0 | 3,778.4 | 6,389.8 | 13.4 | 13.4 | 14.5 |
| Professional and business services | 1,916.6 | 2,425.2 | 3,324.7 | 2.4 | 3.2 | 1,780.6 | 2,854.1 | 5,043.9 | 9.4 | 10.1 | 11.4 |
| Educational services | 195.5 | 189.5 | 231.3 | –.3 | 2.0 | 155.3 | 271.7 | 424.8 | .8 | 1.0 | 1.0 |
| Health care and social assistance | 1,262.6 | 1,598.6 | 2,173.8 | 2.4 | 3.1 | 1,140.4 | 1,919.0 | 3,378.8 | 6.0 | 6.8 | 7.6 |
| Leisure and hospitality | 773.6 | 911.2 | 1,133.4 | 1.7 | 2.2 | 705.6 | 1,086.2 | 1,714.9 | 3.7 | 3.9 | 3.9 |
| Other services | 511.6 | 502.2 | 608.8 | –.2 | 1.9 | 464.0 | 606.1 | 923.8 | 2.5 | 2.2 | 2.1 |
| Federal government | 782.0 | 1,006.2 | 884.8 | 2.6 | –1.3 | 682.8 | 1,213.7 | 1,331.8 | 3.6 | 4.3 | 3.0 |
| State and local government | 1,697.8 | 1,771.8 | 2,012.2 | .4 | 1.3 | 1,475.3 | 2,227.0 | 3,189.0 | 7.8 | 7.9 | 7.2 |
| Agriculture, forestry, fishing, and hunting | 276.0 | 307.3 | 376.5 | 1.1 | 2.1 | 240.8 | 431.1 | 537.7 | 1.3 | 1.5 | 1.2 |
| Special industries(1) | 977.0 | 1,156.9 | 1,471.6 | 1.7 | 2.4 | 911.4 | 1,334.4 | 2,160.6 | 4.8 | 4.7 | 4.9 |
| Residual(2) | –8.0 | –24.4 | –22.2 | — | — | — | — | — | — | — | — |
| Notes: (2) Residual is shown for the first level only. As a byproduct of chain-weighting, subcategories do not necessarily add to higher level categories. Source: U.S. Bureau of Labor Statistics, Employment Projections Program. | |||||||||||
Macroeconomic factors, such as the labor force, gross domestic product (GDP) and its components, and labor productivity, affect the growth in total employment. BLS projects that GDP will grow at an annual rate of 2.6 percent between 2012 and 2022, a growth rate that is higher than the annual rate of 1.6 percent experienced during the 2002–2012 period,6 which included the recession that ended in June 2009. GDP is expected to increase from $13.6 trillion in 2012 to just under $17.6 trillion in 2022, an increase of almost $4.0 trillion, which is higher than the $2.0 trillion increase experienced during the previous decade. While GDP is expected to grow faster during the projection period than it did during the previous decade, the labor force is projected to grow at a slower pace than it did over the previous decade. The civilian labor force is projected to grow from 155 million in 2012 to 163.5 million in 2022, an annual growth rate of 0.5 percent. The labor force increase of 8.5 million is smaller than the increase of 10.1 million, an annual growth rate of 0.7 percent, experienced during the previous decade. Nonfarm labor productivity, which measures output per hour of labor, is projected to increase by 2.0 percent annually from 2012 to 2022, slightly faster than the 1.9-percent-per-year growth seen between 2002 and 2012. These macroeconomic variables, along with the forecasting models for the individual industries, inform the final projections for industry employment and output.7

| Year | Employment (millions) |
|---|---|
1992 | 109.546 |
1993 | 111.666 |
1994 | 115.025 |
1995 | 118.000 |
1996 | 120.421 |
1997 | 123.505 |
1998 | 126.727 |
1999 | 129.768 |
2000 | 132.520 |
2001 | 132.540 |
2002 | 131.137 |
2003 | 130.795 |
2004 | 132.220 |
2005 | 134.494 |
2006 | 136.863 |
2007 | 138.398 |
2008 | 137.600 |
2009 | 131.609 |
2010 | 130.535 |
2011 | 132.171 |
2012 | 134.426 |
… | … |
2022 | 149.751 |
| Source: U.S. Bureau of Labor Statistics, Current Employment Statistics (historical data) and Employment Projections Program (2022 data). | |
It is important to keep in mind that employment is still recovering from the latest recession. Although the recession ended in 2009, total nonagricultural wage and salary employment tends to lag output in recovery and did not start to grow until 2011. (See figure 1.) Employment fell by 0.6 percent between 2007 and 2008 and by another 4.4 percent between 2008 and 2009. These declines were followed by a 1.3-percent employment gain from 2010 to 2011 and a 1.7-percent gain from 2011 to 2012. The construction sector is a good example of the lag in employment rebound after a recession; in that sector, employment fell by 16.0 percent between 2008 and 2009 and grew by 2.0 percent between 2011 and 2012. (See discussion of construction employment that follows.)
Because economic growth during the present recovery has remained relatively slow compared with that of past recoveries, the expectations about the path of future GDP growth and the labor force participation rate have shifted. Changing demographics, as well as the upcoming retirement of the baby-boom generation, are expected to lower the labor force participation rate. These shifts, along with further reductions in federal government spending, will result in slower growth in the total number of nonagricultural wage and salary jobs over this projection period compared with other projection periods.8
The number of total nonagricultural jobs is projected to be almost 149.8 million in 2022, lower than the 150.2 million anticipated for 2020 in the 2010–2020 projections.9 The 2010–2020 projections had a base year of 2010, whereas the 2012–2022 projections have a base year of 2012. Because employment in 2010 was still suffering from the effects of the recession, the 2010 base-year value is, in most instances, lower than the 2012 base-year value. This difference resulted in most industries having lower growth rates in the 2012–2022 projections than they did in the 2010–2020 projections. For example, in the 2010–2020 projections, the number of wage and salary jobs in construction was projected to grow from 5.5 million in 2010 to almost 7.4 million in 2020, an annual rate of increase of 2.9 percent.10 In the 2012–2022 projections, the number of construction jobs is expected to increase from 5.6 million in 2012 to 7.3 million in 2022, an annual rate of increase of 2.6 percent, which is lower than the projected rate for 2010–2020. (See discussion of construction employment.)
The service-providing sectors are responsible for the largest proportion of total employment and for the most of the job growth over the projection period. The health care and social assistance sector11 is expected to add the largest number of jobs and become the sector with the largest number of jobs by 2022, overtaking the state and local government sector, which accounted for more jobs in 2012. (See table 1.) The health care and social assistance sector was not as greatly affected by the last recession as were other sectors and continued to have robust growth even during the recession. This resilience, along with the newly enacted Affordable Health Care Act, changing demographics, and advances in technology, should continue to drive employment growth in this sector. The service-providing sectors also are expected to account for the largest portion of real output over the projection period. Because of several factors, including efforts to reduce budget deficits, the federal government is the only major sector in the economy projected to experience output declines.
The recovery in the construction sector will account for almost all of the job growth in the goods-producing sectors over the projection period. By contrast, manufacturing is expected to experience a slight decline in employment because of productivity gains, international trade, and consolidation of firms. Construction, along with the health care and social assistance sector, is projected to have the fastest employment growth in the entire economy. (See table 1.) The construction sector also is projected to see the fastest growth in real output over the 2012–2022 period. Output growth is much faster than employment growth in the goods-producing sectors because these sectors tend to be much more productive than are the service-providing sectors. Even though output is expected to increase in all goods-producing sectors, the percentage of nominal output that these sectors contribute to the economy is expected to decline. (See table 2.)
Job growth is expected to be highest in the service-providing sectors, in which the number of wage and salary workers is expected to increase from 116.1 million in 2012 to 130.2 million in 2022, an annual growth rate of 1.2 percent, faster than the 0.7-percent annual growth rate experienced between 2002 and 2012. The health care and social assistance sector is projected to have the most job growth, adding almost 5.0 million jobs. The 2.6-percent-per-year growth rate is the fastest among all major service-producing sectors. (See table 1.) Real output in the wholesale trade sector is projected to experience the fastest growth among all major service-providing sectors, growing at 3.7 percent per year, from $1.1 billion in 2012 to almost $1.6 billion in 2022. (See table 2.) As noted earlier, the proportion of total nominal output for the service-providing sectors is expected to continue to increase, climbing from 68.3 percent in 2012 to 69.4 percent in 2022. This increase continues the trend seen in the 2002–2012 period, in which the share of total nominal output attributed to the service-providing sectors grew by 1 percentage point. (See table 2.)
The goods-producing sectors, excluding agriculture, are expected to add nearly 1.2 million jobs, from almost 18.4 million in 2012 to almost 19.6 million in 2022, an annual rate of increase of 0.6 percent. By contrast, these sectors experienced job losses at a rate of 2.0 percent per year during the 2002–2012 period. Among the goods-producing sectors, construction is projected to add the largest number of jobs, just over 1.6 million, reaching almost 7.3 million by 2022. Construction also is expected to have the fastest job growth within the goods-producing sectors, with employment growing at an annual rate of 2.6 percent between 2012 and 2022. (See table 1.) In addition, the sector is expected to experience the fastest output growth rate—4.1 percent per year—among the goods-producing sectors. Despite this rapid growth, construction real output and employment are not expected to return completely to their prerecession levels. (See the section on construction below.) The manufacturing sector, while projected to experience employment declines, remains the dominant sector within the goods-producing sectors in terms of both employment and output. Real output in manufacturing is expected to see an increase of $1.2 billion, a 2.4-percent-per-year increase, between 2012 and 2022. This increase is larger than the increase of $86.8 million, an annual growth rate of 0.2 percent, seen during the 2002–2012 period. (See table 2.) Manufacturing is projected to shed 549,500 jobs between 2012 and 2022, an annual rate of decline of 0.5 percent, which is slower than the 2.4-percent rate of decline experienced during the previous decade, in which more than 3.3 million jobs were lost. (See table 1.)
The service-providing sectors are projected to account for more than 90 percent of the jobs that will be added to the economy between 2012 and 2022. The health care and social assistance sector, which was largely unaffected by the most recent recession, will continue to add a substantial number of these jobs. As the shift to service-oriented economy continues, the service-providing sectors also are projected to account for almost 70 percent of nominal output by 2022.
Health care and social assistance. Among all major sectors, the health care and social assistance sector is projected to experience the largest and fastest employment gains. (See table 1.) This growth is driven, in part, by changing demographics. The number of people 65 years and older is projected to increase from 41.9 million in 2012 to 58.6 million in 2022, with this age group accounting for 17.3 percent of the population in 2022, up from 13.3 percent in 2012. Older people require more health care services, thus boosting demand for these services. In addition, increasing cost pressures are expected to shift demand from higher cost hospitals and inpatient physician services to lower cost home health care services, outpatient physician services, and clinical services.12 The health care and social assistance sector is projected to add almost 5 million jobs, a 2.6-percent-per-year increase, between 2012 and 2022. Real output in the sector is projected to increase by $575.2 billion, from almost $1.6 trillion in 2012 to almost $2.2 trillion in 2022, at an annual growth rate of 3.1 percent. This increase is larger than the $336.0 billion increase in real output seen in the previous decade. (See table 2.)
The home health care services industry, which provides in-home care such as nursing and physical therapy, has the fastest growing employment of all industries, one of the largest increases in employment, and one of the fastest growing real outputs. (See tables 3, 4, and 5.) The growth in employment and output in this industry is driven by an aging population and the lower cost of home health care settings relative to that of inpatient facilities.13 The industry is projected to add 715,700 jobs, at an annual growth rate of 4.8 percent, reaching a level of more than 1.9 million jobs by 2022. (See tables 3 and 4.) Although this job growth is larger than the 518,800 jobs added from 2002 to 2012, it is slower than the 5.8-percent-per-year growth experienced between 2002 and 2012. Real output in home health care services is expected to increase from $42.2 billion in 2012 to $65.3 billion in 2022, an annual growth rate of 4.5 percent, which is one of the fastest among all industries and faster than the 2.4-percent growth rate seen between 2002 and 2012. (See table 5.)
| Industry description | Sector | 2007 NAICS code | Thousands of jobs | Change | Annual rate of change | |
|---|---|---|---|---|---|---|
| 2012 | 2022 | 2012–2022 | 2012–2022 | |||
| Fastest growing | ||||||
| Home health care services | Health care and social assistance | 6216 | 1,198.6 | 1,914.3 | 715.7 | 4.8 |
| Individual and family services | Health care and social assistance | 6241 | 1,311.4 | 2,022.9 | 711.5 | 4.4 |
| Outpatient, laboratory, and other ambulatory care services | Health care and social assistance | 6214, 6215, 6219 | 1,151.4 | 1,673.7 | 522.3 | 3.8 |
| Management, scientific, and technical consulting services | Professional and business services | 5416 | 1,121.1 | 1,577.1 | 456.0 | 3.5 |
| Computer systems design and related services | Professional and business services | 5415 | 1,620.3 | 2,229.0 | 608.7 | 3.2 |
| Cement and concrete product manufacturing | Manufacturing | 3273 | 161.6 | 218.9 | 57.3 | 3.1 |
| Office administrative services | Professional and business services | 5611 | 426.4 | 571.3 | 144.9 | 3.0 |
| Offices of health practitioners | Health care and social assistance | 6211, 6212, 6213 | 3,968.0 | 5,193.8 | 1,225.8 | 2.7 |
| Veneer, plywood, and engineered wood product manufacturing | Manufacturing | 3212 | 63.8 | 83.5 | 19.7 | 2.7 |
| Facilities support services | Professional and business services | 5612 | 125.8 | 164.4 | 38.6 | 2.7 |
| Construction | Construction | 23 | 5,640.9 | 7,263.0 | 1,622.1 | 2.6 |
| Commercial and industrial machinery and equipment rental and leasing | Financial activities | 5324 | 132.2 | 167.1 | 34.9 | 2.4 |
| Software publishers | Information | 5112 | 286.0 | 359.1 | 73.1 | 2.3 |
| Other professional, scientific, and technical services | Professional and business services | 5419 | 609.5 | 761.0 | 151.5 | 2.2 |
| Employment services | Professional and business services | 5613 | 3,147.9 | 3,929.6 | 781.7 | 2.2 |
| Junior colleges, colleges, universities, and professional schools | Educational services | 6112, 6113 | 1,763.2 | 2,196.6 | 433.4 | 2.2 |
| Nursing and residential care facilities | Health care and social assistance | 623 | 3,193.5 | 3,954.2 | 760.7 | 2.2 |
| Other educational services | Educational services | 6114–7 | 671.5 | 830.3 | 158.8 | 2.1 |
| Funds, trusts, and other financial vehicles | Financial activities | 525 | 86.8 | 107.3 | 20.5 | 2.1 |
| Child day care services | Health care and social assistance | 6244 | 855.5 | 1,052.0 | 196.5 | 2.1 |
| Securities, commodity contracts, and other financial investments and related activities | Financial activities | 523 | 814.4 | 1,001.0 | 186.6 | 2.1 |
| Most rapidly declining | ||||||
| Apparel manufacturing | Manufacturing | 315 | 148.1 | 62.3 | –85.8 | –8.3 |
| Leather and allied product manufacturing | Manufacturing | 316 | 29.4 | 18.5 | –10.9 | –4.5 |
| Communications equipment manufacturing | Manufacturing | 3342 | 109.5 | 78.6 | –30.9 | –3.3 |
| Postal Service | Federal government | 491 | 611.2 | 442.1 | –169.1 | –3.2 |
| Computer and peripheral equipment manufacturing | Manufacturing | 3341 | 158.6 | 118.7 | –39.9 | –2.9 |
| Spring and wire product manufacturing | Manufacturing | 3326 | 41.6 | 31.3 | –10.3 | –2.8 |
| Newspaper, periodical, book, and directory publishers | Information | 5111 | 451.8 | 346.8 | –105.0 | –2.6 |
| Hardware manufacturing | Manufacturing | 3325 | 25.0 | 19.4 | –5.6 | –2.5 |
| Textile mills and textile product mills | Manufacturing | 313, 314 | 234.6 | 183.1 | –51.5 | –2.4 |
| Other miscellaneous manufacturing | Manufacturing | 3399 | 268.4 | 211.1 | –57.3 | –2.4 |
| Glass and glass product manufacturing | Manufacturing | 3272 | 80.0 | 64.0 | –16.0 | –2.2 |
| Sugar and confectionery product manufacturing | Manufacturing | 3113 | 66.8 | 53.5 | –13.3 | –2.2 |
| Pulp, paper, and paperboard mills | Manufacturing | 3221 | 108.2 | 86.8 | –21.4 | –2.2 |
| Pesticide, fertilizer, and other agricultural chemical manufacturing | Manufacturing | 3253 | 36.8 | 29.8 | –7.0 | –2.1 |
| Manufacturing and reproducing magnetic and optical media | Manufacturing | 3346 | 21.0 | 17.2 | –3.8 | –2.0 |
| Pipeline transportation | Transportation and warehousing | 486 | 43.9 | 36.1 | –7.8 | –1.9 |
| Audio and video equipment manufacturing | Manufacturing | 3343 | 19.9 | 16.4 | –3.5 | –1.9 |
| Natural gas distribution | Utilities | 2212 | 109.7 | 92.1 | –17.6 | –1.7 |
| Other chemical product and preparation manufacturing | Manufacturing | 3259 | 80.8 | 67.9 | –12.9 | –1.7 |
| Source: U.S. Bureau of Labor Statistics, Employment Projections Program. | ||||||
| Industry description | Sector | 2007 NAICS code | Thousands of jobs | Change | Annual rate of change | |
|---|---|---|---|---|---|---|
| 2012 | 2022 | 2012–2022 | 2012–2022 | |||
| Largest growth | ||||||
| Construction | Construction | 23 | 5,640.9 | 7,263.0 | 1,622.1 | 2.6 |
| Offices of health practitioners | Health care and social assistance | 6211, 6212, 6213 | 3,968.0 | 5,193.8 | 1,225.8 | 2.7 |
| Retail trade | Retail trade | 44, 45 | 14,875.3 | 15,966.2 | 1,090.9 | 0.7 |
| Food services and drinking places | Leisure and hospitality | 722 | 9,963.3 | 10,851.5 | 888.2 | .9 |
| Hospitals, private | Health care and social assistance | 622 | 4,791.0 | 5,605.8 | 814.8 | 1.6 |
| Employment services | Professional and business services | 5613 | 3,147.9 | 3,929.6 | 781.7 | 2.2 |
| Nursing and residential care facilities | Health care and social assistance | 623 | 3,193.5 | 3,954.2 | 760.7 | 2.2 |
| Home health care services | Health care and social assistance | 6216 | 1,198.6 | 1,914.3 | 715.7 | 4.8 |
| Individual and family services | Health care and social assistance | 6241 | 1,311.4 | 2,022.9 | 711.5 | 4.4 |
| Computer systems design and related services | Professional and business services | 5415 | 1,620.3 | 2,229.0 | 608.7 | 3.2 |
| Outpatient, laboratory, and other ambulatory care services | Health care and social assistance | 6214, 6215, 6219 | 1,151.4 | 1,673.7 | 522.3 | 3.8 |
| Wholesale trade | Wholesale trade | 42 | 5,672.8 | 6,143.2 | 470.4 | .8 |
| Management, scientific, and technical consulting services | Professional and business services | 5416 | 1,121.1 | 1,577.1 | 456.0 | 3.5 |
| General local government educational services compensation | State and local government | NA | 7,779.3 | 8,233.7 | 454.4 | .6 |
| Junior colleges, colleges, universities, and professional schools | Educational services | 6112, 6113 | 1,763.2 | 2,196.6 | 433.4 | 2.2 |
| Services to buildings and dwellings | Professional and business services | 5617 | 1,829.6 | 2,109.0 | 279.4 | 1.4 |
| Architectural, engineering, and related services | Professional and business services | 5413 | 1,323.3 | 1,595.5 | 272.2 | 1.9 |
| Child day care services | Health care and social assistance | 6244 | 855.5 | 1,052.0 | 196.5 | 2.1 |
| Securities, commodity contracts, and other financial investments and related activities | Financial activities | 523 | 814.4 | 1,001.0 | 186.6 | 2.1 |
| Accommodation | Leisure and hospitality | 721 | 1,817.0 | 1,998.8 | 181.8 | 1.0 |
| Largest declines | ||||||
| General federal nondefense government compensation | Federal government | NA | 1,556.6 | 1,376.3 | –180.3 | –1.2 |
| Postal Service | Federal government | 491 | 611.2 | 442.1 | –169.1 | –3.2 |
| Newspaper, periodical, book, and directory publishers | Information | 5111 | 451.8 | 346.8 | –105.0 | –2.6 |
| Apparel manufacturing | Manufacturing | 315 | 148.1 | 62.3 | –85.8 | –8.3 |
| State government enterprises | State and local government | NA | 499.5 | 442.0 | –57.5 | –1.2 |
| Other miscellaneous manufacturing | Manufacturing | 3399 | 268.4 | 211.1 | –57.3 | –2.4 |
| Air transportation | Transportation and warehousing | 481 | 458.3 | 406.2 | –52.1 | –1.2 |
| Textile mills and textile product mills | Manufacturing | 313, 314 | 234.6 | 183.1 | –51.5 | –2.4 |
| Telecommunications | Information | 517 | 858.0 | 807.0 | –51.0 | –.6 |
| Electric power generation, transmission, and distribution | Utilities | 2211 | 396.8 | 350.6 | –46.2 | –1.2 |
| General federal defense government compensation | Federal government | NA | 550.4 | 505.1 | –45.3 | –.9 |
| Couriers and messengers | Transportation and warehousing | 492 | 532.9 | 488.9 | –44.0 | –.9 |
| Computer and peripheral equipment manufacturing | Manufacturing | 3341 | 158.6 | 118.7 | –39.9 | –2.9 |
| Plastics product manufacturing | Manufacturing | 3261 | 515.9 | 476.6 | –39.3 | –.8 |
| Navigational, measuring, electromedical, and control instruments manufacturing | Manufacturing | 3345 | 400.4 | 367.3 | –33.1 | –.9 |
| Semiconductor and other electronic component manufacturing | Manufacturing | 3344 | 384.4 | 353.2 | –31.2 | –.8 |
| Aerospace product and parts manufacturing | Manufacturing | 3364 | 497.4 | 466.5 | –30.9 | –.6 |
| Communications equipment manufacturing | Manufacturing | 3342 | 109.5 | 78.6 | –30.9 | –3.3 |
| Printing and related support activities | Manufacturing | 323 | 462.1 | 434.0 | –28.1 | –.6 |
| Metalworking machinery manufacturing | Manufacturing | 3335 | 177.1 | 153.8 | –23.3 | –1.4 |
| Source: U.S. Bureau of Labor Statistics, Employment Projections Program. | ||||||
| Industry description | Sector | 2007 NAICS code | Billions of chained 2005 dollars | Change | Annual rate of change | |
|---|---|---|---|---|---|---|
| 2012 | 2022 | 2012–2022 | 2012–2022 | |||
| Fastest growing | ||||||
| Computer and peripheral equipment manufacturing | Manufacturing | 3341 | 139.1 | 335.8 | 196.7 | 9.2 |
| Software publishers | Information | 5112 | 117.8 | 205.6 | 87.8 | 5.7 |
| Computer systems design and related services | Professional and business services | 5415 | 306.8 | 492.4 | 185.7 | 4.8 |
| Data processing, hosting, related services, and other information services | Information | 518, 519 | 165.9 | 262.9 | 96.9 | 4.7 |
| Securities, commodity contracts, and other financial investments and related activities | Financial activities | 523 | 468.7 | 742.4 | 273.6 | 4.7 |
| Home health care services | Health care and social assistance | 6216 | 42.2 | 65.3 | 23.1 | 4.5 |
| Construction | Construction | 23 | 773.8 | 1,160.1 | 386.2 | 4.1 |
| Semiconductor and other electronic component manufacturing | Manufacturing | 3344 | 148.6 | 221.4 | 72.8 | 4.1 |
| Outpatient, laboratory, and other ambulatory care services | Health care and social assistance | 6214, 6215, 6219 | 126.3 | 187.5 | 61.2 | 4.0 |
| Office furniture (including fixtures) manufacturing | Manufacturing | 3372 | 13.9 | 20.7 | 6.7 | 4.0 |
| Medical equipment and supplies manufacturing | Manufacturing | 3391 | 62.5 | 92.2 | 29.7 | 4.0 |
| Architectural, engineering, and related services | Professional and business services | 5413 | 251.9 | 370.8 | 118.9 | 3.9 |
| Management of companies and enterprises | Professional and business services | 55 | 367.9 | 539.0 | 171.2 | 3.9 |
| Lessors of nonfinancial intangible assets (except copyrighted works) | Financial activities | 533 | 125.9 | 182.8 | 56.9 | 3.8 |
| Spring and wire product manufacturing | Manufacturing | 3326 | 13.1 | 18.9 | 5.7 | 3.7 |
| Wholesale trade | Wholesale trade | 42 | 1,115.8 | 1,597.6 | 481.8 | 3.7 |
| Engine, turbine, and power transmission equipment manufacturing | Manufacturing | 3336 | 38.0 | 54.4 | 16.4 | 3.6 |
| Motor vehicle parts manufacturing | Manufacturing | 3363 | 199.1 | 283.0 | 83.9 | 3.6 |
| Cement and concrete product manufacturing | Manufacturing | 3273 | 38.4 | 54.5 | 16.1 | 3.6 |
| Offices of health practitioners | Health care and social assistance | 6211, 6212, 6213 | 576.7 | 818.2 | 241.5 | 3.6 |
| Other wood product manufacturing | Manufacturing | 3219 | 29.7 | 42.1 | 12.4 | 3.6 |
| Other general purpose machinery manufacturing | Manufacturing | 3339 | 59.4 | 84.2 | 24.8 | 3.6 |
| Most rapidly declining | ||||||
| General federal defense government consumption of fixed capital | Federal government | NA | 87.4 | 72.9 | –14.5 | –1.8 |
| General federal defense government compensation | Federal government | NA | 239.2 | 199.5 | –39.7 | –1.8 |
| General federal nondefense government consumption of fixed capital | Federal government | NA | 33.5 | 28.9 | –4.6 | –1.5 |
| General federal nondefense government compensation | Federal government | NA | 146.2 | 126.1 | –20.1 | –1.5 |
| General federal nondefense government except compensation and consumption of fixed capital | Federal government | NA | 140.0 | 123.3 | –16.8 | –1.3 |
| General federal defense government except compensation and consumption of fixed capital | Federal government | NA | 285.7 | 257.6 | –28.1 | –1.0 |
| Leather and allied product manufacturing | Manufacturing | 316 | 2.6 | 2.3 | –0.2 | –1.0 |
| Textile mills and textile product mills | Manufacturing | 313, 314 | 44.2 | 40.9 | –3.3 | –.8 |
| Apparel manufacturing | Manufacturing | 315 | 18.3 | 17.2 | –1.1 | –.6 |
| Postal Service | Federal government | 491 | 56.7 | 53.7 | –3.1 | –.6 |
| Alumina and aluminum production and processing | Manufacturing | 3313 | 62.0 | 60.7 | –1.3 | –.2 |
| Source: U.S. Bureau of Labor Statistics, Employment Projections Program. | ||||||
The industry of offices of health practitioners, which includes offices of physicians, of dentists, and of other health practitioners such as chiropractors and optometrists, is expected to add the largest number of jobs among the service-providing industries and the second largest number of jobs overall. In addition, this industry is projected to experience one of the fastest and largest growths in real output over the projection period. (See tables 3, 4, 5, and 6.) Cost pressures, an aging population, and technological advances are expected to shift services from inpatient facilities and hospitals to the offices of health practitioners, driving growth in both employment and real output. The number of jobs in this industry is projected to increase from almost 4.0 million in 2012 to 5.2 million in 2022, an increase of more than 1.2 million jobs, at an annual growth rate of 2.7 percent, the eighth fastest among all industries. (See table 3.) Real output is expected to increase by $241.5 billion, at an annual rate of 3.6 percent, to reach $818.2 billion in 2022. This projected growth makes this industry one of the largest and fastest growing in terms of output. (See tables 5 and 6.)
| Industry description | Sector | 2007 NAICS code | Billions of chained 2005 dollars | Change | Annual rate of change | |
|---|---|---|---|---|---|---|
| 2012 | 2022 | 2012–2022 | 2012–2022 | |||
| Largest growth | ||||||
| Wholesale trade | Wholesale trade | 42 | 1,115.8 | 1,597.6 | 481.8 | 3.7 |
| Retail trade | Retail trade | 44, 45 | 1,271.3 | 1,747.5 | 476.2 | 3.2 |
| Construction | Construction | 23 | 773.8 | 1,160.1 | 386.2 | 4.1 |
| Monetary authorities, credit intermediation, and related activities | Financial activities | 521, 522 | 801.7 | 1,117.6 | 315.9 | 3.4 |
| Real estate | Financial activities | 531 | 977.8 | 1,286.4 | 308.5 | 2.8 |
| Securities, commodity contracts, and other financial investments and related activities | Financial activities | 523 | 468.7 | 742.4 | 273.6 | 4.7 |
| Offices of health practitioners | Health care and social assistance | 6211, 6212, 6213 | 576.7 | 818.2 | 241.5 | 3.6 |
| Telecommunications | Information | 517 | 559.8 | 780.3 | 220.5 | 3.4 |
| Computer and peripheral equipment manufacturing | Manufacturing | 3341 | 139.1 | 335.8 | 196.7 | 9.2 |
| Computer systems design and related services | Professional and business services | 5415 | 306.8 | 492.4 | 185.7 | 4.8 |
| Management of companies and enterprises | Professional and business services | 55 | 367.9 | 539.0 | 171.2 | 3.9 |
| Hospitals, private | Health care and social assistance | 622 | 535.5 | 683.3 | 147.8 | 2.5 |
| Petroleum and coal products manufacturing | Manufacturing | 324 | 422.5 | 544.3 | 121.8 | 2.6 |
| Architectural, engineering, and related services | Professional and business services | 5413 | 251.9 | 370.8 | 118.9 | 3.9 |
| Food services and drinking places | Leisure and hospitality | 722 | 491.6 | 605.1 | 113.6 | 2.1 |
| General state and local government except compensation and consumption of fixed capital | State and local government | NA | 539.8 | 650.4 | 110.6 | 1.9 |
| Insurance carriers | Financial activities | 5241 | 412.1 | 511.8 | 99.6 | 2.2 |
| Data processing, hosting, related services, and other information services | Information | 518, 519 | 165.9 | 262.9 | 96.9 | 4.7 |
| Motor vehicle manufacturing | Manufacturing | 3361 | 241.4 | 335.7 | 94.2 | 3.4 |
| Oil and gas extraction | Mining | 211 | 320.5 | 410.9 | 90.4 | 2.5 |
| Largest declines | ||||||
| General federal defense government compensation | Federal government | NA | 239.2 | 199.5 | –39.7 | –1.8 |
| General federal defense government except compensation and consumption of fixed capital | Federal government | NA | 285.7 | 257.6 | –28.1 | –1.0 |
| General federal nondefense government compensation | Federal government | NA | 146.2 | 126.1 | –20.1 | –1.5 |
| General federal nondefense government except compensation and consumption of fixed capital | Federal government | NA | 140.0 | 123.3 | –16.8 | –1.3 |
| General federal defense government consumption of fixed capital | Federal government | NA | 87.4 | 72.9 | –14.5 | –1.8 |
| General federal nondefense government consumption of fixed capital | Federal government | NA | 33.5 | 28.9 | –4.6 | –1.5 |
| Textile mills and textile product mills | Manufacturing | 313, 314 | 44.2 | 40.9 | –3.3 | –0.8 |
| Postal Service | Federal government | 491 | 56.7 | 53.7 | –3.1 | –.6 |
| Alumina and aluminum production and processing | Manufacturing | 3313 | 62.0 | 60.7 | –1.3 | –.2 |
| Apparel manufacturing | Manufacturing | 315 | 18.3 | 17.2 | –1.1 | –.6 |
| Leather and allied product manufacturing | Manufacturing | 316 | 2.6 | 2.3 | –.2 | –1.0 |
| Source: U.S. Bureau of Labor Statistics, Employment Projections Program. | ||||||
The individual and family services industry, which provides a variety of social services to children, elderly people, people with disabilities, and others, is projected to have the second-fastest growth in employment and the ninth-largest increase in employment. (See tables 3 and 4.) The industry is expected to add 711,500 jobs, at an annual rate of 4.4 percent, to reach a level of just over 2.0 million jobs in 2022. Real output is projected to increase by 2.8 percent annually, up from the 0.7-percent annual rate of increase seen in the 2002–2012 period, to reach $67.7 billion in 2022. Employment and output growth in this industry are driven by the shift in demand for services from higher cost inpatient facilities to lower cost individual and family service providers.14
Hospitals are expected to add 814,800 jobs between 2012 and 2022, the fifth-largest increase in employment among all industries. (See table 4.) Despite the large number of jobs added, the hospitals industry is not one of the fastest growing industries in terms of jobs because of its large employment base. Employment in the industry is projected to reach just over 5.6 million in 2022. With an annual growth rate of only 1.6 percent over the projection period, hospitals are the slowest growing industry within the health care and social assistance sector. Again, the shift from hospitals, which are more expensive, to outpatient services, which are less expensive, is expected to contribute to this slower job growth.15 Real output in the industry is projected to increase from $535.5 billion in 2012 to $683.3 billion in 2022. The $147.8 billion increase, an annual growth rate of 2.5 percent, is one of the largest increases in real output, but not one of the fastest, again because of a large output base. (See table 6.)
Because of cost reduction measures,16 the outpatient, laboratory, and other ambulatory care industry is expected to be among the largest and fastest growing industries in terms of both employment and real output. (See tables 3 and 5.) Employment is projected to grow from just under 1.2 million in 2012 to just under 1.7 million in 2022, an annual growth rate of 3.8 percent, the third fastest among all industries. The increase of 522,300 jobs also represents one of the largest employment increases of all industries. (See tables 4.) In addition, real output in the industry is projected to grow at an annual rate of 4.0 percent, increasing from $126.3 billion in 2012 to $187.5 billion in 2022.
The nursing and residential care facilities industry provides assisted living services, including nursing, rehabilitation, and other related personal care, to those who need continuous care but do not require hospital services. The shift to more outpatient services, the increasing population of elderly people seeking to maintain some level of independence, and improvements in technology allowing younger patients shorter rehabilitation stays are expected to make this industry one of the largest and fastest growing among all industries. The number of jobs in nursing and residential care facilities is projected to grow by 760,700, from almost 3.2 million in 2012 to almost 4 million in 2022, an annual rate of increase of 2.2 percent. (See tables 3 and 4.) Real output is expected to increase by 3.0 percent annually, to reach a level of $249.1 billion in 2022, up from $184.7 billion in 2012.
Professional and business services. The professional and business services sector is projected to see large growth in both employment and output over the next decade. The sector is expected to add almost 3.5 million jobs, the third-largest increase among all major sectors, to reach a level of more than 21.4 million jobs in 2022, up from just over 17.9 million in 2012. The 1.8-percent annual growth rate in employment is the third fastest among the service-providing sectors and faster than the 1.2-percent annual growth rate experienced between 2002 and 2012. (See table 1.) Real output in professional and business services is expected to increase by almost $899.5 billion (the second-largest output increase within the service-providing sectors), to reach a level of more than $3.3 trillion in 2022. (See table 2.)
Employment in the management, scientific, and technical consulting services industry is projected to increase from just over 1.1 million in 2012 to almost 1.6 million in 2022. Businesses’ growing need of consulting services to keep pace with the latest technology, government regulations, and management and production techniques is expected to drive demand for workers in this industry. Because consultants can be hired temporarily and on as-needed basis, they represent a lower cost alternative to full-time staff. With a projected increase of 456,000 jobs and an annual growth rate of 3.5 percent, employment in this industry is one of the largest and fastest growing among all industries. (See tables 3 and 4.) Although the number of jobs added over the projection period is greater than the 413,400 jobs added between 2002 and 2012, the projected annual growth rate is slower than the 4.7-percent growth rate experienced during the previous decade. Real output is projected to increase by $57.1 billion, a 3.3-percent annual rate of increase, to reach $206.1 billion in 2022. This output growth is both larger and faster than the increase of $8.1 billion, at an annual rate of 0.6 percent, seen in the 2002–2012 period.
The demand for increased network and computer systems security, mobile technologies, and custom programming services, along with the growing use of electronic health records, is expected to drive employment and output growth in the computer systems design and related services industry. The industry is expected to add 608,700 jobs, up from the 467,500 jobs added between 2002 and 2012, to reach a level of just over 2.2 million jobs by 2022, one of the largest increases in employment. (See table 4.) The 3.2-percent annual growth rate projected for the 2012–2022 period also is one of the fastest among all industries, but slightly slower than the 3.5-percent annual growth rate experienced during the 2002–2012 period. (See table 3.) In addition, real output in the industry is projected to have one of the largest increases, $185.7 billion, and one of the fastest annual growth rates, 4.8 percent. (See tables 5 and 6.) While this increase in real output is larger than the $148.2 billion increase seen in the 2002–2012 period, it is slower than the 6.8-percent growth rate experienced during that period.
The number of jobs in the employment services industry, which comprises employment placement agencies, temporary help services, and professional employer organizations, is projected to increase from more than 3.1 million in 2012 to almost 4.0 million in 2022. The increase of 781,700 jobs, at an annual rate of 2.2 percent, makes this industry one of the largest and fastest growing in terms of employment. (See tables 3 and 4.) The demand for information technology, healthcare, and temporary help services is driving the employment growth in this industry. Real output is expected to increase by $64.5 billion, 3.4 percent annually, to reach $228.7 billion in 2022.
The facilities support services industry provides operating staff to perform support services, such as janitorial, maintenance, and reception services, within a client’s facility. Support activities also include operation of jails or correctional facilities on a contract or fee basis. This industry is expected to have one of the fastest job growths among all industries, adding 38,600 jobs, at an annual rate of 2.7 percent, and reaching a level of 164,400 jobs by 2022. (See table 3.) Despite this fast employment growth, the industry’s real output is relatively small. Real output is expected to increase from $15.9 billion in 2012 to $18.3 billion in 2022, an increase of $2.4 billion, at 1.4 percent annually. This growth makes this industry the smallest, in terms of real output, among all industries in the professional and business services sector.
Information. The information sector is one of the three sectors (utilities and the federal government are the other two) within the service-providing sectors that is expected to experience a decline in employment over the projection period. Employment is projected to fall by 65,200, 0.2 percent annually, to reach a level of just over 2.6 million in 2022. (See table 1.) The slower growth in employment is driven by the projected loss of 105,000 jobs, at 2.6 percent annually, in the newspaper, periodical, book, and directory publishers industry. This loss is due mostly to a decrease in circulation caused by the rise of available information on the Internet, e-readers, and tablets. Among the service-providing sectors, the information sector is projected to see the second-fastest increase in real output over the projection period—3.5 percent per year. Real output also is projected to increase from almost $1.2 trillion in 2012 to almost $1.7 trillion in 2022, putting this sector just behind wholesale trade in terms of output growth.
The software publishers industry is projected to see one of the fastest growth rates in both employment and real output over the projection period. (See tables 3 and 5.) Software as a Service is expected to become more entrenched within the software publishing business model, increasing consumer and business reliance on software applications accessed on the Internet, as well as remote, rather than local, storage. Consequently, the need for higher network security, along with the desire of users for improved application features and performance, is expected to drive output in software publishing. Real output in this industry is expected to increase from $117.8 billion in 2012 to $205.6 billion in 2022, an increase of $87.8 billion. The annual growth rate of 5.7 percent makes software publishers the second-fastest-growing industry in terms of real output. (See table 5.) This rate also is faster than the 1.1-percent growth rate experienced during the previous decade, in which real output increased by only $12.5 billion. In addition, this industry is projected to be the thirteenth fastest growing in terms of employment, with the number of jobs increasing from 286,000 in 2012 to 359,100 in 2022, at an annual rate of 2.3 percent. (See table 3.) This growth rate is almost double the 1.2-percent growth rate in employment seen during the 2002–2012 period. With advances in technology, output is expected to grow faster than employment in this industry.
The data processing, hosting, related services, and other information services industry, which provides the infrastructure for hosting and data processing and offers services such as search engines, is projected to see one of the largest increases in real output. (See table 5.) The increase in the amount of Web broadcasting and virtual meetings, which reduce business costs, is expected to drive demand for this industry’s output. The growing use of cloud storage also is expected to play a key role in the growth of the industry. Real output is projected to rise from $165.9 billion in 2012 to $262.9 billion in 2022. The annual growth rate of 4.7 percent, which is the same as that seen between 2002 and 2012, makes this industry the fourth fastest growing in terms of output over the projection period. (See table 5.) Employment in the industry is projected to increase by 28,700, to reach 452,800 in 2022. The projected growth rate of 0.7 percent is an improvement over the 0.1-percent annual rate of decline seen between 2002 and 2012. As technology continues to improve, productivity increases in this industry will result in slower employment growth relative to output growth.
Telecommunications is the industry with the largest employment in the information sector, accounting for almost a third of the sector’s employment in 2012. Between 2002 and 2012, this industry experienced the largest decrease in employment within the sector, losing 422,900 jobs. While the loss of jobs has slowed, employment in telecommunications is projected to fall by 51,000, to 807,000 in 2022, registering one of the largest declines over the projection period. (See table 4.) Although employment is expected to decrease, real output growth in the industry is projected to be one of the largest in the economy. The continued replacement of copper wires with fiber-optic cables, the need for increased download speeds for wireless communication, and new technologies are expected to drive demand for output in this industry. Real output is projected to grow from $559.8 billion in 2012 to $780.3 billion in 2022, making this industry the eighth largest in terms of output growth. (See table 6.) The projected increase of $220.5 billion also is larger than the $136.9 billion increase seen in the previous decade, and the expected annual growth rate of 3.4 percent is faster than the 2.8-percent growth rate experienced during that decade.
Financial activities. With the burst of the credit bubble in 2007, the financial activities sector was severely affected by the recession, losing 60,800 jobs between 2002 and 2012. As the economic recovery gains momentum, however, employment in this sector is expected to increase by 751,000, to reach more than 8.5 million in 2022. Real output in the sector is projected to experience the largest increase among all service-providing sectors, an increase of more than $1.1 trillion, to reach more than $4.3 trillion in 2022. (See table 2.) This output growth is almost three times that seen in the previous decade.
The securities, commodity contracts, and other financial investments and related activities industry is projected to see one of the largest and fastest increases in both employment and real output within the financial activities sector. (See tables 3, 4, 5, and 6.) These increases will be driven by a growing number of people reaching retirement age and by younger workers seeking advice on retirement planning. Real output in the industry is projected to increase by $273.7 billion, up from the $152.5 billion increase seen in the previous decade, to reach $742.4 billion in 2022. The projected growth rate of 4.7 percent is faster than the 4.0-percent-per-year increase experienced during the 2002–2012 period. This industry also is projected to see one of the largest increases in employment over the projection period, adding 186,600 jobs, an annual growth rate of 2.1 percent, to reach a level of just over 1.0 million jobs in 2022. (See table 4.) By contrast, the industry added only 25,000 jobs between 2002 and 2012.
Real output in the lessors of nonfinancial intangible assets industry, which contains businesses primarily engaged in assigning asset rights (such as patents, trademarks, and brand names), is projected to increase by $56.9 billion, to reach $182.8 billion in 2022. The increased demand for asset rights and franchise agreements is expected to drive output growth in this industry. With real output increasing at an annual rate of 3.8 percent, the industry is the second fastest growing among all financial activities industries and one of the fastest growing overall. (See table 5.) Employment in this industry is expected to increase by 2.9 million, to reach 27.1 million in 2022. This employment growth contrasts with the 3.4 million jobs that were lost between 2002 and 2012.
Real output in the insurance carrier industry is expected to increase from $412.1 billion in 2012 to $511.8 billion in 2022. The projected increase of $99.7 billion is one of the largest increases in real output over the 2012–2022 period. (See table 6.) By contrast, between 2002 and 2012, real output decreased by $16.5 billion. With the implementation of the Affordable Care Act, the number of people who require health insurance is expected to increase, driving demand in this industry.17 Although real output is projected to see one of the largest increases, employment is projected to grow by only 22,300, to reach just over 1.4 million in 2022. This increase is only slightly larger than the 12,000 jobs added between 2002 and 2012.
The monetary authorities, credit intermediation, and related activities industry is expected to increase its real output by $315.9 billion, reaching more than $1.1 trillion in 2022, making this increase the fourth largest in real output during the 2012–2022 period. (See table 6.) The 3.4-percent annual growth rate in real output over the projection period is faster than the 1.4-percent growth rate seen in the previous period. Employment in this industry is projected to increase by 123,900, to reach more than 2.7 million in 2022. This increase makes up for the 113,300 jobs lost between 2002 and 2012, bringing employment back to just over where it was in 2002.
The real estate industry is projected to have one of the largest increases in real output—an increase from $977.8 billion in 2012 to almost $1.3 trillion in 2022. (See table 6.) This large output growth can be attributed to the rebound in the construction industry and the housing market, a rebound expected to occur over the 2012–2022 period.18 The projected 2.8-percent annual growth rate in real output during the projection period is an improvement over the 1.1-percent growth rate experienced in the 2002–2012 period. Employment in the real estate industry is expected to increase by 161,400, to reach almost 1.6 million in 2022. This increase is larger than the 59,900 jobs added between 2002 and 2012. The projected annual growth rate of 1.1 percent for employment also is higher than the 0.4-percent growth rate experienced during the previous period.
Educational services. Employment in the educational services sector is expected to see the second-fastest growth within the service-providing sectors. (See table 1.) Enrollment in primary and secondary schools is starting to slow, but is still increasing. This upward trend, along with a growing number of people seeking postsecondary education, is expected to drive employment growth in educational services.19 Employment is projected to increase from just over 3.3 million in 2012 to just over 4.0 million in 2022, an increase of 675,300 jobs. (See table 1.) This increase is slightly down from the 704,100 jobs added between 2002 and 2012. The 1.9-percent projected annual growth rate in employment during the 2012–2022 period also is slower than the 2.4-percent growth rate seen in the 2002–2012 period.
Employment in the junior colleges, colleges, universities, and professional schools industry is expected to be one of the largest and fastest growing among all industries. (See tables 3 and 4.) The expected rise in the number of people seeking postsecondary degrees, along with the growing number of older students seeking such degrees, will drive the employment increase in this industry.20 Employment is projected to rise by 433,400, from just under 1.8 million in 2012 to almost 2.2 million in 2022. (See tables 3 and 4.) While this increase is greater than the 339,700 jobs added during the previous decade, the projected annual growth rate of 2.2 percent is the same as that seen between 2002 and 2012.
Employment in the other educational services industry, which comprises business schools and computer and management training, technical and trade schools, other schools and instruction, and educational support services, is projected to increase from 671,500 in 2012 to 830,300 in 2022, an annual growth rate of 2.1 percent, making this industry one of the fastest growing in the economy. (See table 3.) However, the expected increase of 158,800 jobs is smaller than the increase of 238,000 jobs seen between 2002 and 2012. As the number of high school graduates increases and as a greater number of older workers seek additional training in their fields in order to keep pace with new job requirements, the demand for educational services will continue to grow.
Wholesale trade. Real output in the wholesale trade sector is projected to increase from just over $1.1 trillion in 2012 to $1.6 trillion in 2022, an annual growth rate of 3.7 percent, making this sector the second fastest growing in terms of output. (See tables 2 and 5.) The increase of $481.8 billion also is the largest increase in real output over the projection period. (See table 6.) As the economy continues to improve in the wake of the latest recession and as demand for domestic goods rises, so will the demand for wholesale trade services. In addition, employment in this industry is projected to experience one of the largest increases over the projection period, rising from almost 5.7 million in 2012 to more than 6.1 million in 2022, an increase of 470,400 jobs. (See table 4.) This increase is substantially larger than the 20,400 jobs added in the previous decade. Because wholesale trade has a large employment base, employment in this sector has an annual growth rate of only 0.8 percent. Although this rate is higher than the zero-percent growth rate seen in the previous decade, it is lower than the growth rate of the entire economy.
| Year | Expenditures (trillions of dollars) |
|---|---|
2000 | 7.605 |
2001 | 7.810 |
2002 | 8.018 |
2003 | 8.244 |
2004 | 8.516 |
2005 | 8.804 |
2006 | 9.054 |
2007 | 9.263 |
2008 | 9.212 |
2009 | 9.033 |
2010 | 9.196 |
2011 | 9.429 |
2012 | 9.603 |
… | … |
2022 | 12.380 |
Source: U.S. Bureau of Labor Statistics, Current Employment Statistics (historical data) and Employment Projections Program (2022 data). | |
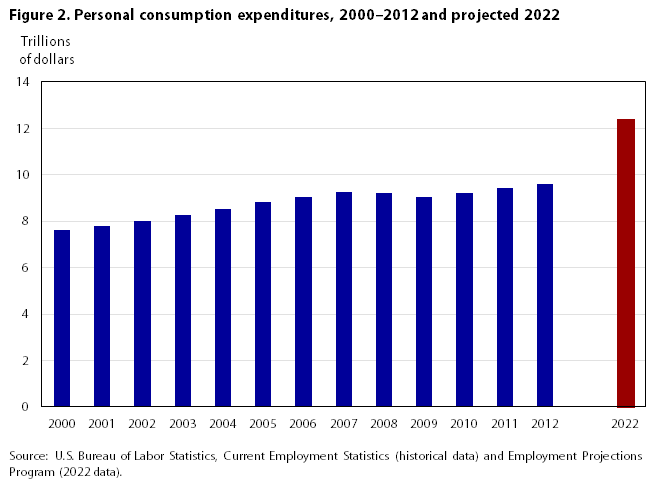
Retail trade. The retail trade sector is projected to see some of the largest and fastest increases in both employment and output in the entire economy. (See tables 4 and 6.) The expected rise in personal consumption expenditures is a major factor contributing to these increases. Although personal consumption expenditures declined from 2007 to 2009 (the period of the latest recession), they started to rebound in 2010. (See figure 2.) Over the projection period, personal consumption expenditures are expected to increase from $9.6 trillion in 2012 to almost $12.4 trillion in 2022, an annual growth rate of 2.6 percent, which is higher than the 1.8-percent growth rate experienced during the previous decade.21 Real output in the retail trade sector is projected to grow by $476.2 billion, to reach just over $1.7 trillion in 2022, representing the second-largest increase in real output among all industries. (See table 6.) This increase also is more than double the change in output that occurred during the previous period, in which real output increased by $201.7 billion. In addition, the projected output growth of 3.2 percent per year is faster than the 1.7-percent-per-year growth seen between 2002 and 2012. Employment in retail trade is expected to rise by more than 1.0 million, to reach almost 16.0 million by 2022. This projected increase is the third largest among all industries. (See table 4.) However, the annual growth rate of 0.7 percent for employment is lower than the overall growth rate of employment for the economy. This difference is due to the sector’s large employment base.
Utilities. The utilities sector is one of the three service-providing sectors projected to experience an employment decline during the 2012–2022 period. Newer technology that makes facilities more efficient and productive is expected to reduce the demand for workers in this sector. Employment is expected to fall from 554,200 in 2012 to 497,800 in 2022, a loss of 56,400 jobs, which is larger than the loss of 42,100 jobs seen in the previous period. Real output is projected to grow from $317.5 billion in 2012 to $397.1 billion in 2022, an increase of $79.6 billion. (See table 2.) While this increase almost erases the loss of $85.9 billion that occurred in the previous decade, real output in 2022 is projected to be below the level it attained in 2002.
Water, sewage, and other systems is the only industry within the utilities sector projected to see an increase in employment. With a growing population and an increasing number of Environmental Protection Agency regulations, as well as state regulations, the demand for workers in this industry is expected to rise. Employment is expected to increase by 7,500, to reach 55,200 by 2022. Real output is projected to increase from $5.9 billion in 2012 to $7.4 billion in 2022, an increase of $1.5 billion, at an annual rate of 2.2 percent.
The electric power generation, transmission, and distribution industry is projected to see an employment decline that is larger than that in any other industry within the utilities sector and one of the largest overall. (See table 4.) Newer technology, along with newer and larger facilities, has led to more efficient plants that require fewer workers. Employment is projected to fall by 46,200, to reach 350,600 by 2022. This job loss continues the downward trend for this industry and is larger than the loss of 37,000 jobs during the previous decade. The decrease in employment at a 1.2-percent annual rate during the projection period also is faster than the annual decrease of 0.9 percent experienced during the 2002–2012 period. While employment is projected to fall, real output in this industry is expected to increase by $59.9 billion, from $218.1 billion in 2012 to $278.0 billion in 2022, an annual growth rate of 2.5 percent. This growth in output contrasts with the loss of $34.6 billion, at 1.5 percent per year, which occurred during the previous decade.
Federal government. Increased pressure to reduce government spending and budget deficits will contribute to employment declines in the federal government. The sector is projected to see the largest decrease in employment of any of the major service-providing sectors, losing 407,500 jobs between 2012 and 2022, for a decrease of 1.6 percent per year. By contrast, the federal government grew by 48,000 jobs, at an annual rate of 0.2 percent, between 2002 and 2012.
The increasing use of email and online payment of bills, along with the decreased circulation of magazines and catalogs in the last decade, indicates that consumers are moving away from services provided by the Postal Service. This shift in demand is expected to result in significant declines in both employment and output for the industry over the projection period. The expected job loss in the Postal Service accounts for more than 40 percent of the job losses within the federal government sector. Employment in the industry is projected to decrease by 169,100, an annual rate of decline of 3.2 percent, to fall to 442,100 in 2022, representing the second-largest and the fourth-fastest decline in employment among all industries. (See tables 3 and 4.) While the loss of jobs is large, it is smaller than the 231,200 jobs lost during the previous decade. Real output in the Postal Service also is expected to experience one of the fastest declines over the projection period, falling at 0.6 percent per year, to reach $53.7 billion in 2022. The projected decline of $3.0 billion is smaller than the decline of $12 billion, at 1.9 percent annually, seen between 2002 and 2012.
General federal nondefense government compensation, which is government spending to produce goods and services by federal nondefense civilian employees, is projected to experience the largest decrease in employment among all industries. (See table 4.) Pressure to curb government spending in order to reduce the budget deficit is expected to decrease employment in this industry. Employment is projected to fall by 180,300, from just under 1.6 million in 2012 to just under 1.4 million in 2022, at an annual rate of decline of 1.2 percent. This decline accounts for more than 44 percent of the jobs lost in the federal government sector and contrasts with the 218,500 jobs added in the industry during the previous period. The industry’s real output (compensation) also is projected to fall by $20.1 billion, from $146.2 billion in 2012 to $126.1 billion in 2022, an annual rate of decline of 1.5 percent. This decline in output is one of the largest and fastest among all industries. (See tables 5 and 6.)
State and local government. Employment in the state and local government sector is projected to increase by 929,000, to reach just over 20.0 million in 2022. (See table 1.) This increase is more than two-and-a-half times the increase seen in the 2002–2012 period. The projected job growth in the sector is driven by increases in both state and local educational services, with almost half of the growth coming from the local government educational services industry. Rising enrollment in schools, an increasing assimilation of students with disabilities into regular instruction, and a growing number of people seeking postsecondary education to increase their skills are expected to drive the employment growth in this sector.22 Real output in the sector is projected to increase from almost $1.8 trillion in 2012 to more than $2.0 trillion in 2022, an increase of $240.4 billion. (See table 2.) This increase is up from the increase of $74.0 billion experienced during the previous decade.
Employment in state and local educational services is expected to account for slightly more than two-thirds of the increase in employment in the state and local government sector over the 2012–2022 period. Employment in local government educational services is projected to increase by 454,400, to reach more than 8.2 million in 2022, representing one of the largest increases in employment among all industries. (See table 4.) This increase also is more than three times the increase in employment experienced in the previous period, in which only 124,900 jobs were added. Real output is projected to increase from $365.1 billion in 2012 to $393.0 billion in 2022. The increase of $27.9 billion reverses the decrease of $7.7 billion seen in the previous decade. Employment in the state educational services industry is expected to increase by 145,500, to reach more than 2.5 million in 2022. This increase is slightly larger than the increase of 142,600 experienced during the 2002–2012 period. Growing enrollment in postsecondary institutions, a dynamic due to a larger number of high school graduates and nontraditional students seeking postsecondary education, is expected to drive most of the employment growth in this industry.23 Real output is projected to rise by $8.8 billion between 2012 and 2022, an increase smaller than the $11.1 billion increase seen during the 2002–2012 period.
The goods-producing sectors are expected to reverse the trend of declining employment experienced between 2002 and 2012, with a rebounding construction sector accounting for most of the employment growth over the projection period. While projected to increase, employment in the goods-producing sectors is expected to continue its downward trend as a share of total employment. Real output in these sectors is expected to grow slightly faster than the rest of the economy, also reversing the trend of declining output seen in the 2002–2012 period. As with employment, construction output is expected to show a significant rebound in the upcoming decade, as the sector recovers from the latest recession.
Employment in the goods-producing sectors, which together comprise agriculture, mining, construction, and manufacturing, is projected to increase by almost 970,400, from nearly 20.5 million in 2012 to more than 21.4 million in 2022, with the majority of this increase occurring in the construction sector. (See table 1.) Real output in the goods-producing sectors is projected to increase from almost $6.0 trillion in 2012 to more than $7.7 trillion in 2022, an increase of $1.8 trillion. This increase in output contrasts with the $182.9 million lost during the previous decade. Because of its size, the manufacturing sector is responsible for the majority of the increase in real output within the goods-producing sectors.
Agriculture, forestry, fishing, and hunting. World economic growth, which is expected to boost the need for food and feed in the next decade,24 is likely to result in increased real output in the agriculture, forestry, fishing, and hunting sector. Real output in this sector is projected to increase by $69.2 billion over the projection period, to reach $376.5 billion in 2022. (See table 2.) This increase is greater than the output growth that occurred in the previous decade. While real output is projected to grow, employment in this sector is projected to decline. Historically, agriculture has depended on self-employed and unpaid family workers, as well as wage and salary workers. Although self-employed and unpaid family workers accounted for slightly less than 50 percent of all jobs in this sector in 2002, these workers are projected to represent only about one-third of all jobs in the sector in 2022, as the shift from smaller family farms to larger corporate farms continues. Employment of self-employed and unpaid family workers is projected to fall by 198,400, from 805,800 in 2012 to 607,400 in 2022, an annual rate of decline of 2.8 percent. While this employment decline is smaller than the decline of 222,200 seen during the 2002–2012 period, its annual rate is faster than the 2.4-percent rate of decline experienced during the 2002–2012 period. Wage and salary employment in agriculture also is expected to decrease, falling from more than 1.3 million in 2012 to just under 1.3 million in 2022. The projected loss of 25,100 jobs, at an annual rate of decline of 0.2 percent, contrasts with the 89,500 jobs added between 2002 and 2012, at an annual growth rate of 0.7 percent. Total agricultural employment is projected to fall by 223,500 over the projection period. (See table 1.)
With the construction industry recovering, forestry is one of the industries within the agriculture, forestry, fishing, and hunting sector that is expected to see an increase in both employment and output. Employment in the industry is projected to grow by 600, from 9,000 in 2012 to 9,600 in 2022, an annual rate of increase of 0.6 percent. This employment growth contrasts with the large loss of 6,000 jobs (at an annual rate of 5.0 percent) that occurred in the 2002–2012 period, which coincided with the recession and the downturn in the construction industry. Real output in the forestry industry also is projected to increase by $1.9 billion, at an annual rate of 2.2 percent, to reach $9.3 billion in 2022. This increase represents a rebound from the output loss of $200.0 million seen in the 2002–2012 period.
Real output in the animal production industry, which is the largest industry in terms of output in the agriculture, forestry, fishing, and hunting sector, is expected to grow over the projection period. The projected rise in production is due to expected higher domestic and export demand.25 Real output is projected to increase by $36.4 billion, an annual rate of increase of 2.1 percent, to reach $194.5 billion in 2022. This increase is almost the same as the increase of $30.6 billion, an annual rate of increase of 2.2 percent, experienced during the 2002–2012 period. While real output is expected to continue to grow, employment is expected to decline as a result of industry consolidation and productivity-enhancing new technologies, such as diet improvements, selective breeding programs, and drug development.26 The animal production industry is projected to see the largest decrease in jobs among all industries in this sector, with the number of jobs falling from 894,400 in 2012 to 750,100 in 2022, a loss of 144,300 jobs, at an annual rate of decline of 1.7 percent. This decline is both larger and faster than the one that occurred during the 2002–2012 period, in which the industry lost 126,600 jobs.
Mining. The mining sector is expected to experience an increase in real output over the projection period. This growth will be driven by increased production of gas and oil, increased use of hydraulic fracturing (fracking), and the rebound of the construction industry. Real output in the sector is expected to increase from $473.5 billion in 2012 to $598.9 billion in 2022, an increase of $125.4 billion, which is larger than the $90.6 billion increase experienced during the 2002–2012 period. (See table 2.) Employment in the mining sector also is projected to grow over the projection period, although at a slower pace than in the past because of advances in technology. Employment is projected to increase by 121,200, rising from 800,500 in 2012 to 921,700 in 2022, an annual rate of increase of 1.4 percent. This increase is smaller than the increase seen in the previous decade, in which the sector added 288,200 jobs, at an annual rate of 4.6 percent. (See table 1.)
The oil and gas extraction industry, which is the largest industry within the mining sector in terms of real output, is expected to see the largest increase in output over the projection period. Growth in shale gas production, in which new technologies such as horizontal drilling and hydraulic fracturing have made production more efficient, is expected to continue over the next decade.27 The increased demand for oil and gas is expected to spur further exploration for oil and gas reserves. Real output in the industry is expected to rise by $90.4 billion, an annual rate of increase of 2.5 percent, to reach $410.9 billion in 2022. This increase is larger and faster than the increase of $57.3 billion, at 2.0 percent annually, experienced during the 2002–2012 period. Employment in the industry also is expected to increase by 33,900, an annual rate of increase of 1.7 percent, to reach 220,700 by 2022. This increase is neither as large nor as fast as that seen in the previous decade, in which 64,900 jobs were added, at an annual rate of 4.4 percent.
Support activities for mining is projected to have the largest increase in employment of all mining industries. This industry provides contract- or fee-based support services, including drilling, taking core samples, and making geological observations at prospective sites, for the mining and quarrying of minerals and for the extraction of oil and gas. Employment in the industry is expected to increase by 80,700, from 391,100 in 2012 to 471,800 in 2022, accounting for more than two-thirds of the employment growth in the mining sector. This increase is lower than the 211,300 jobs added in the previous decade. The 1.9-percent annual growth rate of employment over the projection period also is slower than the 8.1-percent annual growth rate experienced during the 2002–2012 period. Real output in this industry is projected to increase by $22.0 billion, to reach $118.6 billion in 2022. This increase is lower than the $40.3 billion increase in real output that occurred during the previous decade.
The construction sector’s rebound, which is expected to increase demand for nonmetallic minerals such as granite, gravel, and other materials used in residential and nonresidential construction, will benefit employment and output in the nonmetallic mineral mining and quarrying industry. The industry is projected to add 13,500 jobs over the 2012–2022 period, reversing the loss of 16,500 jobs that occurred during the 2002–2012 period. However, the expected employment level of 104,400 in 2022 is still below the level of 107,400 seen in 2002. Real output in this industry is projected to increase from $35.4 billion in 2012 to $42.9 billion in 2022. The increase of $7.5 billion over the projection period is smaller than the increase of $11.8 billion that occurred during the previous 10-year period.
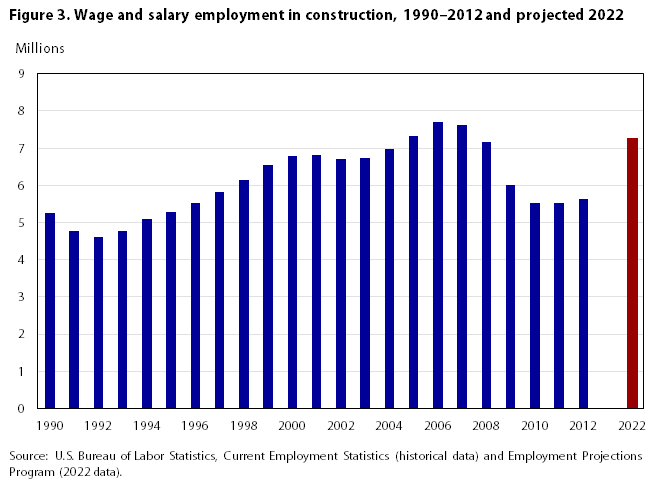
| Year | Employment (millions) |
|---|---|
1990 | 5.263 |
1991 | 4.780 |
1992 | 4.608 |
1993 | 4.779 |
1994 | 5.095 |
1995 | 5.274 |
1996 | 5.536 |
1997 | 5.813 |
1998 | 6.149 |
1999 | 6.545 |
2000 | 6.787 |
2001 | 6.826 |
2002 | 6.716 |
2003 | 6.735 |
2004 | 6.976 |
2005 | 7.336 |
2006 | 7.691 |
2007 | 7.630 |
2008 | 7.162 |
2009 | 6.016 |
2010 | 5.518 |
2011 | 5.533 |
2012 | 5.641 |
… | … |
2022 | 7.262 |
Source: U.S. Bureau of Labor Statistics, Current Employment Statistics (historical data) and Employment Projections Program (2022 data). | |
Construction. The construction industry was one of the hardest hit industries during the recession that ended in 2009. Although the sector is projected to add a large number of jobs between 2012 and 2022, it is not expected to reach the peak level of almost 7.7 million jobs seen in 2006. (See figure 3.) Employment in the construction sector is projected to increase by more than 1.6 million, the largest increase in employment in any industry, to reach a level of nearly 7.3 million in 2022. (See table 4.) The annual increase of 2.6 percent for employment also makes construction one of the fastest growing industries. (See table 3.) The large and rapid employment growth over the projection period contrasts with the employment decline of the previous decade, in which the sector lost almost 1.1 million jobs, at an annual rate of 1.7 percent.
The construction sector is projected to see one of the largest and fastest increases in real output, an increase of $386.3 billion, from $773.8 billion in 2012 to almost $1.2 trillion in 2022, an annual rate of increase of 4.1 percent. (See tables 5 and 6.) The projected output growth is faster than that in any other major sector of the economy. (See table 2.) Although real output in the construction industry is expected to recover, the projected output level for 2022 is slightly below that of 2002, when output was at just under $1.2 trillion. So, like employment, real output in the sector is projected to rebound without reaching prerecession levels.
The increase in residential investment and nonresidential structures investment during the 2012–2022 period is expected to spur growth in employment and output in the construction sector. Residential investment is projected to grow at 7.2 percent annually between 2012 and 2022, a substantial improvement over the 5.0-percent annual decline experienced during the 2002–2012 period. The fast growth in residential construction can be attributed to a low starting point occasioned by the latest recession.28 The need of new housing to accommodate a growing population and to replace older housing also will play a role in this investment increase.29 The health of the housing market—health gauged by measures such as foreclosure rates and housing starts—is a reliable indicator of economic recovery. Nonresidential structures tend to have long service lives and last a long time; growth in nonresidential structures investment depends on developers’ current expectations of future want and need of these structures. Strong economic performance in the mid-2000s led to rapid nonresidential construction and an excess inventory at the time the recession hit; as a result, investment in nonresidential structures slowed in subsequent years.30 Investment in nonresidential structures is projected to grow at 2.0 percent annually over the projection period, contrasting with the 0.1-percent annual rate of decrease seen during the previous decade.
Manufacturing. Overall employment in the manufacturing sector is expected to fall slightly between 2012 and 2022. Although 58 of the 77 detailed industries within this sector are projected to see employment declines over the projection period, several manufacturing industries are expected to experience some growth in the next decade. The majority of the employment growth in this sector is expected to occur in industries that are connected to the construction sector. However, manufacturing is not projected to see the postrecession rebound in employment seen in other sectors. The sector’s role in the U.S. economy has changed over time; today, that role is greater in innovation, productivity, and international trade, rather than in job creation.31 While new manufacturing jobs will be added over the projection period, these employment gains will not make up for the job losses that occurred over the last decade. U.S. manufacturers have been replacing workers with machines. Many new jobs in the sector are in the information technology field and require workers who can operate networked robotic machines, develop software, and manipulate electronic databases. Along with these developments, the demand for assembly-line workers has declined. Requirements for critical-thinking skills have also increased with changes in technology, rivaling those for product design and creation.32 Workers with advanced manufacturing skills are now more in demand than are workers with little or no skills.33
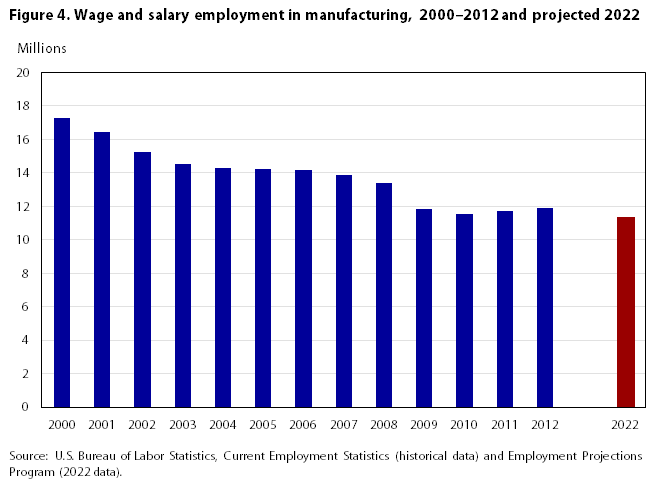
| Year | Employment (millions) |
|---|---|
2000 | 17.263 |
2001 | 16.441 |
2002 | 15.259 |
2003 | 14.509 |
2004 | 14.315 |
2005 | 14.227 |
2006 | 14.155 |
2007 | 13.879 |
2008 | 13.406 |
2009 | 11.847 |
2010 | 11.528 |
2011 | 11.726 |
2012 | 11.919 |
… | … |
2022 | 11.366 |
Source: U.S. Bureau of Labor Statistics, Current Employment Statistics (historical data) and Employment Projections Program (2022 data). | |
Employment in the manufacturing sector is projected to fall from just over 11.9 million in 2012 to just under 11.4 million in 2022, an annual rate of decline of 0.5 percent. (See table 1.) The loss of 549,500 jobs is substantially smaller than the loss of more than 3.3 million jobs during the 2002–2012 period. Manufacturing employment saw a steady decline through 2010 and then an uptick in 2011 and 2012. However, growth over the projection period is not expected. (See figure 4.)
Real output in the manufacturing sector is projected to rise from just over $4.4 trillion in 2012 to just over $5.6 trillion in 2022, an increase of nearly $1.2 trillion. This increase is higher than the $86.8 billion increase seen during the previous decade. The annual rate of increase of 2.4 percent also is faster than the 0.2-percent annual increase experienced during the 2002–2012 period. Although manufacturing output is expected to grow, its percentage of total output will continue to fall in nominal terms, from 19.9 percent in 2012 to 17.8 percent in 2022. Of the 77 industries within the manufacturing sector, only 4 (textile mills and textile product mills, apparel manufacturing, leather and allied product manufacturing, and alumina and aluminum production and processing industries) are projected to see a decrease in real output over the projection period.
Over the last few projection cycles, apparel manufacturing and leather and allied product manufacturing have consistently been among the industries with the largest declines in employment and output. These large declines can be attributed to import competition, consolidation of firms within these industries, and the labor-intensive nature of the industries. The apparel manufacturing and leather and allied product manufacturing industries are projected to experience the fastest annual declines in employment over the projection period—declines of 8.3 percent and 4.5 percent, respectively. (See table 3.) The projected employment decline in apparel manufacturing is faster than the 8.2-percent annual decline experienced during the 2002–2012 period, whereas the employment decline in leather and allied product manufacturing is slower than the 5.2-percent annual decline experienced during the 2002–2012 period. The apparel manufacturing industry also is projected to see one of the largest decreases in employment, shedding 85,800 jobs (or 50 percent of all jobs in the industry) and reaching a level of 62,300 jobs in 2022. (See table 4.) Real output declines in the two industries are projected to be among the largest and fastest over the projection period, with the apparel manufacturing industry seeing an output decrease of $1.1 billion, an annual rate of decline of 0.6 percent, to reach $17.2 billion in 2022, and the leather and allied product manufacturing industry seeing a decrease of $300.0 million, an annual rate of decline of 1.0 percent, to reach $2.3 billion in 2022. (See tables 5 and 6.)
Computer and electronic product manufacturing is one of the subsectors with the highest productivity in the economy, consistently seeing large increases in real output and either small increases or declines in employment. Real output in the subsector is projected to increase from $447.5 billion in 2012 to $684.4 billion in 2022, an increase of $236.9 billion. The expected annual rate of increase of 4.3 percent is the fastest among all subsectors within manufacturing and faster than the annual increase of 3.7 percent experienced in the previous decade. Employment in this subsector is projected to fall by 142,300, an annual rate of decrease of 1.4 percent, to reach a level of 951,500 in 2022. This employment decline is smaller than the decline of 413,400, at 3.2 percent annually, seen during the 2002–2012 period.
The computer and peripheral equipment manufacturing industry is projected to have the fastest growth in real output among all industries, with output increasing at 9.2 percent annually. (See table 5.) The projected output increase of $196.7 billion, from $139.1 billion in 2012 to $335.8 billion in 2022, also is one of the largest over the projection period. (See table 6.) Although this increase is larger than the $91.4 billion gained during the 2002–2012 period, its annual rate is slower than the previous rate of 11.3 percent. While real output is expected to continue to increase, its growth rate may continue to slow as consumers shift from personal computers to cheaper tablets.34 Employment in this industry is projected to fall by 39,900, one of the largest declines in employment among all industries, to reach a level of 118,700 in 2022. (See table 4.) This decline is smaller than the decline of 91,400 that occurred between 2002 and 2012. Although the projected annual decline of 2.9 percent is one of the fastest among all industries, it is slower than the annual decline of 4.4 percent seen in the previous decade. (See table 3.) Continued increases in productivity are expected to result in output gains and employment declines.
Increased demand for smartphones, tablets, and new wireless technology is expected to drive output growth in the semiconductor and other electronic component manufacturing industry. Real output in this industry is projected to increase from $148.6 billion in 2012 to $221.4 in 2022. The expected annual growth rate of 4.1 percent makes this industry one of the fastest growing in terms of output. (See table 5.) Although the output increase of $72.8 billion over the projection period is larger than the increase of $51.1 billion seen in the previous decade, it is slower than the 2002–2012 increase, which had a lower starting point. While output is projected to grow, productivity gains in this industry are expected to result in employment declines. Employment in the semiconductor and other electronic component manufacturing industry is expected to decrease by 31,200, an annual decline of 0.8 percent, to reach 353,200 in 2022, representing one of the largest declines over the projection period. (See table 4.) However, the projected loss of jobs is both smaller and slower than the loss of 140,100 jobs, at an annual rate of 3.1 percent, seen in the previous decade.
Real output in the communications equipment manufacturing industry will be driven by increased demand for smartphones, smartphone applications, and wireless communications devices. Output in this industry is expected to increase from $61.5 billion in 2012 to $79.6 billion in 2022, an increase of $18.1 billion, which is larger than the $2.3 billion increase experienced during the previous decade. Although continued technological advances are expected to drive output growth, productivity gains will more than offset any rise in employment demand from that growth, resulting in employment declines. Employment in the industry is projected to fall by 30,900, to reach a level of 78,600 in 2022. While this decline represents one of the largest decreases in employment over the projection period, it is smaller than the decline of 69,500 that occurred during the 2002–2012 period. The projected annual rate of decline of 3.3 percent for employment is the fastest among all industries within the computer and electronic product manufacturing subsector and one of the fastest overall. (See table 3.) However, that rate is slower than the annual rate of decline of 4.8 percent experienced during the 2002–2012 period.
Real output in the motor vehicle parts manufacturing industry is projected to see an increase of $83.9 billion, to reach $283.0 billion in 2022. The annual increase of 3.6 percent makes this industry one of the fastest growing in terms of real output. (See table 5.) The projected output growth also contrasts with the $2.0 billion decrease, at 0.1 percent annually, that occurred during the previous decade. Employment in this industry is expected to increase by 27,900, an annual increase of 0.6 percent, to reach 507,500 in 2022. However, this increase does not make up for the 254,000 jobs lost between 2002 and 2012, and employment in 2022 is expected to be at a level well below the 2002 level of 733,600. Further information on employment and output for this industry, as well as other detailed industries, can be found on the BLS website.35
BLS PROJECTS THAT OVERALL EMPLOYMENT AND OUTPUT GROWTH will improve in the 2012–2022 decade, compared with the 2002–2012 decade, which saw a major recession whose lingering effects are still evident in the economy. Although real output began to recover in 2009, overall employment did not start to grow until 2011. Projected growth rates for some industries may appear uncharacteristically high, either as a result of low initial levels of employment and output in 2012 or, in the case of industries that escaped the effects of the recession, as a result of expectations of continued historical growth.
The service-providing sectors are expected to account for the majority of the employment growth over the next decade, representing 80 percent of all jobs in 2022. Together, the health care and social assistance sector and the professional and business services sector are expected to account for more than a quarter of all jobs in 2022. These sectors also are expected to account for more than half of the job gains within the service-providing sectors, as well as the entire economy. While real output in the service-providing sectors is expected to grow at the same rate as that of the overall economy, nominal output is projected to reach almost 70 percent of total output by 2022.
The goods-producing sectors are expected to see a recovery in employment and output over the projection period. Although the total number of jobs in these sectors was smaller in 2012 than it was in 2002, it will grow over the next decade, with most of the projected growth occurring in the construction sector. As the effects of the recession continue to ease and those manufacturing industries that are related to construction continue to grow, the loss of manufacturing jobs is expected to slow.
!--?pagebreak>!--?pagebreak>!--?pagebreak>!--?pagebreak>!--?pagebreak>!--?pagebreak>!--?pagebreak>!--?pagebreak>!--?pagebreak>!--?pagebreak>!--?pagebreak>!--?pagebreak>!--?pagebreak>!--?pagebreak>!--?pagebreak>!--?pagebreak>!--?pagebreak>!--?pagebreak>!--?pagebreak>Richard Henderson, "Industry employment and output projections to 2022," Monthly Labor Review, U.S. Bureau of Labor Statistics, December 2013, https://doi.org/10.21916/mlr.2013.39
1 The National Bureau of Economics Research (NBER) is generally recognized as the official arbiter of recessions in the United States. The NBER identified the latest recession as starting in December 2007 and ending in June 2009. For more information, visit the NBER website on the Internet at http://www.nber.org.
2 Christopher J. Goodman and Steven M. Mance, “Employment loss and the 2007–09 recession: an overview,” Monthly Labor Review, April 2011, https://www.bls.gov/opub/mlr/2011/04/art1full.pdf.
3 Total employment is the summation of the employment figures among nonagricultural wage and salary workers; agriculture, forestry, fishing, and hunting workers; and self-employed and unpaid family workers. Nonagricultural wage and salary employment data are from the BLS Current Employment Statistics survey, except for private household employment data, which are provided by the Current Population Survey (CPS). The CPS also provides the data for self-employed and unpaid family workers, and agriculture, forestry, fishing, and hunting workers.
4 Nonagricultural wage and salary employment data are from the Current Employment Statistics survey, except for private household employment data, which are from the CPS. Logging workers are excluded.
5 Throughout this article, unless otherwise noted, output refers to real output in chain-weighted 2005 dollars.
6 For more information on the projections for the macroeconomic variables, see Maggie Woodward, “The U.S. economy to 2022: settling into a new normal," Monthly Labor Review, December 2013, https://www.bls.gov/opub/mlr/2013/article/the-u-s-economy-to-2022-settling-into-a-new-normal.htm.
7 Ibid.
8 Ibid.
9 For more information on the 2010–2020 employment projections, see Richard Henderson, “Industry employment and output projections to 2020,” Monthly Labor Review, January 2012, pp. 65–83, https://www.bls.gov/opub/mlr/2012/01/art4full.pdf.
10 Ibid.
11 This set of BLS projections is based on the 2007 North American Industry Classification System (NAICS). Within this article, sectors generally refer to two-digit NAICS categories, subsectors to three-digit NAICS categories, and industries to either two-, three-, or four-digit NAICS categories.
12 “Projections of national health expenditures: methodology and model specification” (Centers for Medicare and Medicaid Services, July 2012), http://www.cms.gov/Research-Statistics-Data-and-Systems/Statistics-Trends-and-Reports/NationalHealthExpendData/NationalHealthAccountsProjected.html.
13 Ibid.
14 Ibid.
15 Ibid.
16 Ibid.
17 Ibid.
18 For more information, see Woodward, “The U.S. economy to 2022."
19 For more information, see Tabitha M. Bailey and William J. Hussar, “Projection of education statistics to 2021” (U.S. Department of Education, National Center for Education Statistics, Washington, DC, January 2013), http://nces.ed.gov/pubs2013/2013008.pdf.
20 Ibid.
21 For more information, see Woodward, “The U.S. economy to 2022."
22 For more information, see Bailey and Hussar, “Projection of education statistics to 2021.”
23 Ibid.
24 USDA agricultural projections to 2022, Report OCE-2013-1 (Office of the Chief Economist, World Agricultural Outlook Board, U.S. Department of Agriculture, Interagency Agricultural Projections Committee, Long-term Projections Report, February 2013), http://www.ers.usda.gov/media/1013562/oce131.pdf.
25 Ibid.
26 Suzanne Sechen, “Developments in new animal technologies show rapid advancement: CVM keeping pace,” FDA Veterinarian Newsletter 22, no. 1, 2007, http://www.fda.gov/animalveterinary/newsevents/fdaveterinariannewsletter/ucm085008.htm.
27 See “Annual energy outlook 2013” (U.S. Department of Energy, April 2013), http://www.eia.gov/forecasts/aeo/source_natural_gas.cfm.
28 For more information, see Woodward, “The U.S. economy to 2022."
29 Ibid.
30 Ibid.
31 Adam Davidson, “Making it in America,” The Atlantic, January 2012, http://www.theatlantic.com/magazine/archive/2012/01/making-it-in-america/308844/.
32 Ibid.
33 Ibid.
34 Ian King, “PC shipments fall for 5th quarter even as U.S. decline slows,” Bloomberg News, July 2013, http://www.bloomberg.com/news/2013-07-10/pc-shipments-shrank-11-percent-in-second-quarter-gartner-says.html.
35 For more information, see the table on employment and output, by detailed industry, at https://www.bls.gov/emp/tables/industry-employment-and-output.htm.