An official website of the United States government
An official website of the United States government
The .gov means it's official.
Federal government websites often end in .gov or .mil. Before sharing sensitive information,
make sure you're on a federal government site.
The site is secure.
The
https:// ensures that you are connecting to the official website and that any
information you provide is encrypted and transmitted securely.
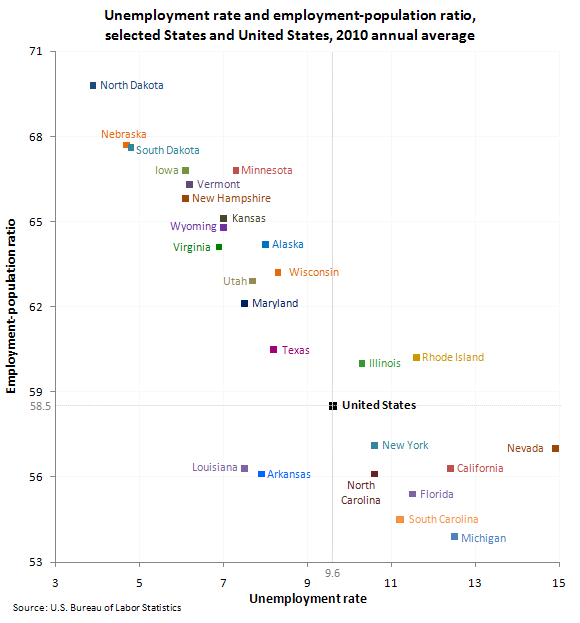
Annual average unemployment rates in 2010 rose in 31 States and the District of Columbia, declined in 18 States, and remained the same in 1 State. Employment-population ratios decreased in 43 States and the District of Columbia, increased in 3 States, and were unchanged in 4 States.
The U.S. jobless rate was 9.6 percent in 2010, and the national employment-population ratio was 58.5 percent.
In 2010, 15 States reported annual average unemployment rates of 10.0 percent or more. Nevada recorded the highest rate, 14.9 percent, followed by Michigan, 12.5 percent, and California, 12.4 percent. (This was the first time since 2005 that Michigan did not post the highest unemployment rate among the States.) North Dakota again registered the lowest jobless rate among the States, 3.9 percent in 2010. The States with the next lowest rates were Nebraska and South Dakota, at 4.7 and 4.8 percent, respectively.
Eight States reported the highest jobless rates in their annual series: California, 12.4 percent; Colorado, 8.9 percent; Delaware, 8.5 percent; Florida, 11.5 percent; Georgia, 10.2 percent; Idaho, 9.3 percent; Nevada, 14.9 percent; and Rhode Island, 11.6 percent.
Three States in the West North Central division again posted the highest employment-population ratios: North Dakota, 69.8 percent, Nebraska, 67.7 percent, and South Dakota, 67.6 percent. Twenty-three States and the District of Columbia recorded employment-population ratios that were significantly above the U.S. ratio of 58.5 percent, and 18 States had ratios that were appreciably below it. The remaining nine States reported ratios that were not measurably different from that of the nation.
These data are from the Local Area Unemployment Statistics program and are seasonally adjusted. To learn more, see “Regional and State Unemployment — 2010 Annual Averages” (HTML) (PDF), news release USDL-11-0239. The employment-population ratio is the proportion of the civilian noninstitutional population 16 years of age and over that is employed.
Bureau of Labor Statistics, U.S. Department of Labor, The Economics Daily, State unemployment rates in 2010 at https://www.bls.gov/opub/ted/2011/ted_20110301.htm (visited May 15, 2026).