
An official website of the United States government
An official website of the United States government
The .gov means it's official.
Federal government websites often end in .gov or .mil. Before sharing sensitive information,
make sure you're on a federal government site.
The site is secure.
The
https:// ensures that you are connecting to the official website and that any
information you provide is encrypted and transmitted securely.
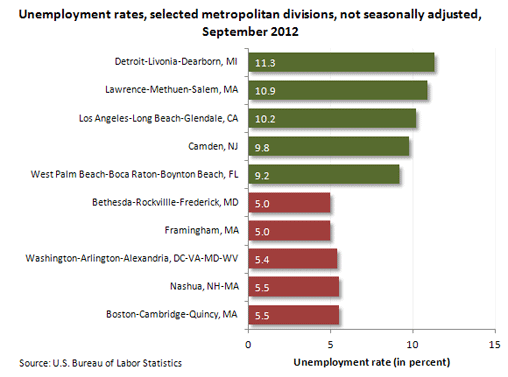
In September 2012, 32 of the 34 metropolitan divisions for which unemployment data are available recorded over-the-year jobless rate decreases, while two registered increases. Twenty-nine of the 32 metropolitan divisions for which employment data are available reported over-the-year employment gains, while 3 reported losses.
In September 2012, Detroit-Livonia-Dearborn, Michigan, registered the highest jobless rate among the divisions, 11.3 percent, followed by Lawrence-Methuen-Salem, Massachusetts (10.9 percent) and Los Angeles-Long Beach-Glendale, California (10.2 percent). Bethesda-Rockville-Frederick, Maryland, and Framingham, Massachusetts, reported the lowest division rates (5.0 percent each), followed by Washington-Arlington-Alexandria, DC-VA-MD-WV (5.4 percent).
| Metropolitan division | Unemployment rate (in percent) |
|---|---|
Detroit-Livonia-Dearborn, MI | 11.3 |
Lawrence-Methuen-Salem, MA | 10.9 |
Los Angeles-Long Beach-Glendale, CA | 10.2 |
Camden, NJ | 9.8 |
West Palm Beach-Boca Raton-Boynton Beach, FL | 9.2 |
Bethesda-Rockvillle-Frederick, MD | 5.0 |
Framingham, MA | 5.0 |
Washington-Arlington-Alexandria, DC-VA-MD-WV | 5.4 |
Boston-Cambridge-Quincy, MA | 5.5 |
Nashua, NH-MA | 5.5 |
These data are featured in the TED article, Metropolitan division employment and unemployment, September 2012.
In 5 of the 11 metropolitan areas that contain divisions, the ranges between the highest and lowest division jobless rates were 2.0 percentage points or more in September. Boston-Cambridge-Quincy, Massachusetts-New Hampshire, recorded the largest rate difference among its divisions, 5.9 percentage points (Lawrence-Methuen-Salem, Massachusetts-New Hampshire, 10.9 percent, compared with Framingham, Massachusetts, 5.0 percent).
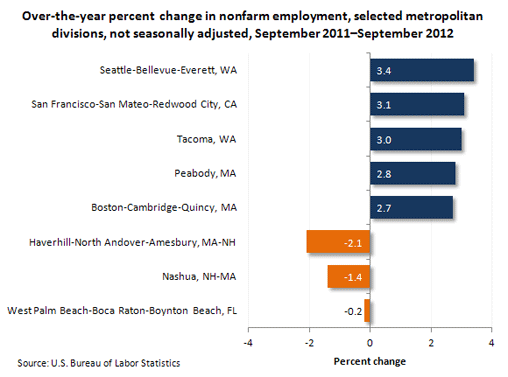
From September 2011 to September 2012, the largest over-the-year percentage increase in employment among the metropolitan divisions was reported in Seattle-Bellevue-Everett, Washington (+3.4 percent), followed by San Francisco-San Mateo-Redwood City, California (+3.1 percent), and Tacoma, Washington (+3.0 percent).
| Metropolitan division | Percent change |
|---|---|
Seattle-Bellevue-Everett, WA | 3.4 |
San Francisco-San Mateo-Redwood City, CA | 3.1 |
Tacoma, WA | 3.0 |
Peabody, MA | 2.8 |
Boston-Cambridge-Quincy, MA | 2.7 |
Haverhill-North Andover-Amesbury, MA-NH | -2.1 |
Nashua, NH-MA | -1.4 |
West Palm Beach-Boca Raton-Boynton Beach, FL | -0.2 |
These data are featured in the TED article, Metropolitan division employment and unemployment, September 2012.
In September 2012, three metropolitan divisions reported an over-the-year percentage decrease in employment: Haverhill-North Andover-Amesbury, Massachusetts-New Hampshire (−2.1 percent), Nashua, New Hampshire-Massachusetts (−1.4 percent), and Haverhill-North Andover-Amesbury, Massachusetts-New Hampshire (−0.2 percent).
These metropolitan area data are from the Current Employment Statistics (State and Area) and Local Area Unemployment Statistics programs; these data are not seasonally adjusted. Data for the most recent month are preliminary and subject to revision. Metropolitan divisions are essentially separately identifiable employment centers within a metropolitan area. To learn more, see "Metropolitan Area Employment and Unemployment — September 2012" (HTML) (PDF), news release USDL-12-2161.
Bureau of Labor Statistics, U.S. Department of Labor, The Economics Daily, Metropolitan division employment and unemployment, September 2012 at https://www.bls.gov/opub/ted/2012/ted_20121101.htm (visited May 05, 2024).

