
An official website of the United States government
An official website of the United States government
The .gov means it's official.
Federal government websites often end in .gov or .mil. Before sharing sensitive information,
make sure you're on a federal government site.
The site is secure.
The
https:// ensures that you are connecting to the official website and that any
information you provide is encrypted and transmitted securely.
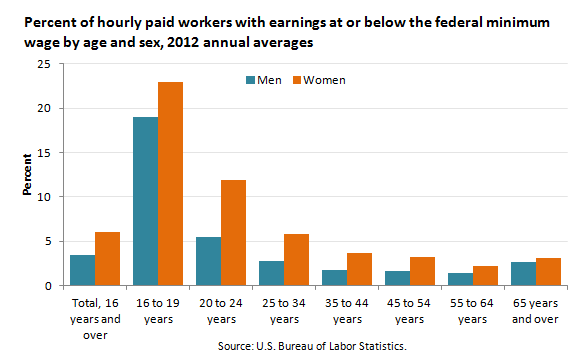
In 2012, there were 3.6 million hourly paid workers in the United States with wages at or below the federal minimum wage of $7.25 per hour. These workers made up 4.7 percent of the 75.3 million workers age 16 and over who were paid at hourly rates. In 2012, 6 percent of women who were paid hourly rates had wages at or below the prevailing federal minimum, compared with about 3 percent of men.
| Age | Both sexes | Men | Women |
|---|---|---|---|
Total, 16 years and over | 4.7 | 3.4 | 6.0 |
16 to 19 years | 21.1 | 19.0 | 23.0 |
20 to 24 years | 8.7 | 5.5 | 11.9 |
25 to 34 years | 4.2 | 2.8 | 5.8 |
35 to 44 years | 2.7 | 1.7 | 3.7 |
45 to 54 years | 2.4 | 1.6 | 3.2 |
55 to 64 years | 1.8 | 1.4 | 2.2 |
65 years and over | 2.9 | 2.6 | 3.1 |
Minimum wage workers tend to be young. Although workers under age 25 represented only about one-fifth of hourly paid workers, they made up about half of those paid the federal minimum wage or less. Among employed teenagers paid by the hour, about 21 percent earned the minimum wage or less, compared with about 3 percent of workers age 25 and over.
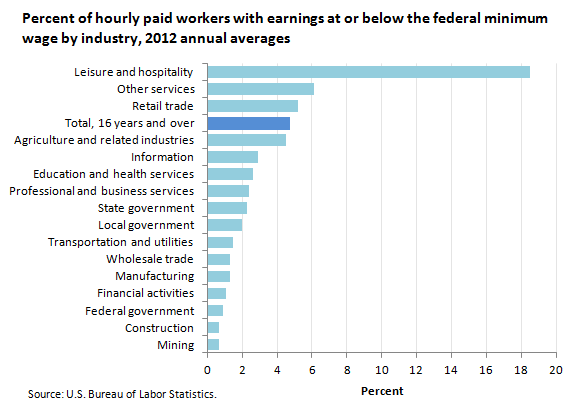
The industry with the highest proportion of workers with hourly wages at or below the federal minimum wage was leisure and hospitality (about 19 percent). About half of all workers paid at or below the federal minimum wage were employed in this industry, the vast majority in restaurants and other food services. For many of these workers, tips and commissions supplement the hourly wages received.
| Industry | Percent |
|---|---|
Total, 16 years and over | 4.7 |
Leisure and hospitality | 18.5 |
Other services | 6.1 |
Retail trade | 5.2 |
Agriculture and related industries | 4.5 |
Information | 2.9 |
Education and health services | 2.6 |
Professional and business services | 2.4 |
State government | 2.3 |
Local government | 2.0 |
Transportation and utilities | 1.5 |
Manufacturing | 1.3 |
Wholesale trade | 1.3 |
Financial activities | 1.1 |
Federal government | 0.9 |
Mining | 0.7 |
Construction | 0.7 |
These data are from the Current Population Survey. For more information, see “Characteristics of Minimum Wage Workers: 2012” (HTML) (PDF). Data are for wage and salary workers age 16 and over and refer to earnings on a person's sole or principal job. Hourly earnings for hourly paid workers do not include overtime pay, commissions, or tips received. The estimates of the numbers of minimum and subminimum wage workers pertain to workers paid at hourly rates; salaried and other workers are excluded. All self-employed persons also are excluded, regardless of whether their businesses are incorporated.
Bureau of Labor Statistics, U.S. Department of Labor, The Economics Daily, Minimum wage workers account for 4.7 percent of hourly paid workers in 2012 at https://www.bls.gov/opub/ted/2013/ted_20130325.htm (visited July 29, 2026).
