An official website of the United States government
An official website of the United States government
The .gov means it's official.
Federal government websites often end in .gov or .mil. Before sharing sensitive information,
make sure you're on a federal government site.
The site is secure.
The
https:// ensures that you are connecting to the official website and that any
information you provide is encrypted and transmitted securely.
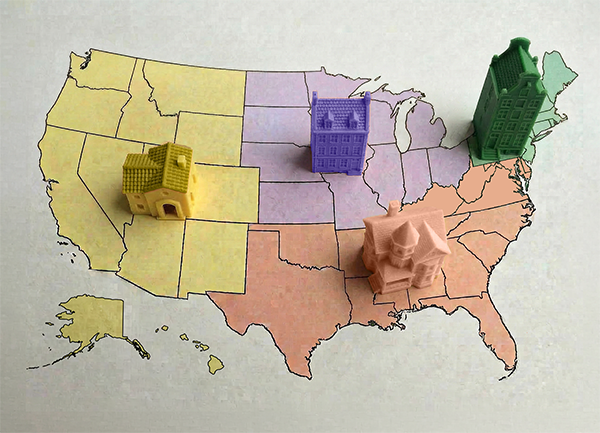
The Consumer Price Index (CPI) for rent of primary residence (rent) index measures the costs of shelter for renter-occupied housing. This article discusses movements in rents among the four U.S. census regions (West, Northeast, South, Midwest), from 2013 to 2023, with specific focus on how the COVID-19 pandemic affected previous regional trends. The pandemic affected rental inflation across the nation, but those impacts varied by region. Using contribution calculations, this article identifies and examines those impacts within each region.
The COVID-19 pandemic led to significant increases in the cost of shelter. These increases were a major contributor to the national level of consumer inflation, with rent increases in 2022 accounting for nearly half of all consumer inflation, as measured by the Consumer Price Index (CPI).1 However, the change in rental costs has been larger in some places than in others.
This article discusses movements in rents among the four U.S. census regions (West, Northeast, South, Midwest), from 2013 to 2023, with specific focus on how the COVID-19 pandemic affected previous regional trends.
The U.S. Bureau of Labor Statistics (BLS) constructs the rent of primary residence (rent) index using data from the BLS Consumer Expenditure (CE) Surveys, the BLS CPI Housing Survey, the U.S. Census Bureau’s American Community Survey (ACS), and the U.S. Department of Energy’s Residential Energy Consumption Survey (RECS). The CE Survey asks households for their total spending on different categories of goods and services; survey responses are subsequently used by BLS to create spending weights for the indexes. The RECS is used to make monthly quality adjustments for parameters such as the type of structure, age of structure, and number of rooms. The Housing Survey collects data on the rents of housing units across the United States.2
The CPI geographic sample is selected to be representative of the urban population of the United States. BLS selects 75 metropolitan areas across the nation in which to conduct CPI and CE surveys.3 Using data from the Decennial Census of Population and Housing, BLS selects representative neighborhoods within each of the select metropolitan areas for housing unit sampling.4 The weight of each neighborhood is based upon the latest 5-year ACS data. BLS data collectors contact a sample of renter-occupied housing units selected to represent each segment in the CPI Housing Survey, collecting rent data from each sampled housing unit every 6 months. Using the sample of rental units, BLS calculates a measure of price change for each CPI index area for the rent index.5
The CPI is computed for several geographic areas that are either large metropolitan areas or groups of smaller metropolitan areas in the same region. Large metropolitan areas, or areas in a region with more than 2.5 million people, are self-representing and CPI data are published for those specific areas. Smaller metropolitan areas, or areas in a region with fewer than 2.5 million people, are grouped together to form a nonself-representing size class for each region and CPI data are published for that size class in its relative region.6
| Period | All items index | Rent index | All items less shelter index |
|---|---|---|---|
Jan 2013 | 230.28 | 264.70 | 221.25 |
Feb 2013 | 232.17 | 265.26 | 223.63 |
Mar 2013 | 232.77 | 265.82 | 224.24 |
Apr 2013 | 232.53 | 265.98 | 223.77 |
May 2013 | 232.95 | 266.56 | 224.11 |
Jun 2013 | 233.50 | 266.91 | 224.65 |
Jul 2013 | 233.60 | 267.48 | 224.56 |
Aug 2013 | 233.88 | 268.51 | 224.73 |
Sep 2013 | 234.15 | 269.14 | 224.99 |
Oct 2013 | 233.55 | 269.96 | 223.99 |
Nov 2013 | 233.07 | 270.70 | 223.09 |
Dec 2013 | 233.05 | 271.69 | 222.83 |
Jan 2014 | 233.92 | 272.32 | 223.71 |
Feb 2014 | 234.78 | 272.73 | 224.67 |
Mar 2014 | 236.29 | 273.49 | 226.39 |
Apr 2014 | 237.07 | 274.10 | 227.30 |
May 2014 | 237.90 | 274.71 | 228.12 |
Jun 2014 | 238.34 | 275.32 | 228.53 |
Jul 2014 | 238.25 | 276.25 | 228.08 |
Aug 2014 | 237.85 | 277.05 | 227.30 |
Sep 2014 | 238.03 | 278.00 | 227.36 |
Oct 2014 | 237.43 | 278.99 | 226.27 |
Nov 2014 | 236.15 | 280.12 | 224.29 |
Dec 2014 | 234.81 | 280.87 | 222.27 |
Jan 2015 | 233.71 | 281.57 | 220.32 |
Feb 2015 | 234.72 | 282.39 | 221.43 |
Mar 2015 | 236.12 | 283.13 | 223.01 |
Apr 2015 | 236.60 | 283.60 | 223.45 |
May 2015 | 237.81 | 284.25 | 224.91 |
Jun 2015 | 238.64 | 285.03 | 225.73 |
Jul 2015 | 238.65 | 286.09 | 225.32 |
Aug 2015 | 238.32 | 287.07 | 224.63 |
Sep 2015 | 237.95 | 288.31 | 223.82 |
Oct 2015 | 237.84 | 289.43 | 223.40 |
Nov 2015 | 237.34 | 290.32 | 222.53 |
Dec 2015 | 236.53 | 291.20 | 221.20 |
Jan 2016 | 236.92 | 292.00 | 221.32 |
Feb 2016 | 237.11 | 292.78 | 221.23 |
Mar 2016 | 238.13 | 293.49 | 222.36 |
Apr 2016 | 239.26 | 294.18 | 223.69 |
May 2016 | 240.23 | 295.04 | 224.63 |
Jun 2016 | 241.02 | 295.90 | 225.28 |
Jul 2016 | 240.63 | 296.86 | 224.46 |
Aug 2016 | 240.85 | 297.92 | 224.45 |
Sep 2016 | 241.43 | 298.96 | 224.93 |
Oct 2016 | 241.73 | 300.40 | 224.98 |
Nov 2016 | 241.35 | 301.59 | 224.24 |
Dec 2016 | 241.43 | 302.74 | 224.10 |
Jan 2017 | 242.84 | 303.47 | 225.70 |
Feb 2017 | 243.60 | 304.21 | 226.42 |
Mar 2017 | 243.80 | 304.87 | 226.47 |
Apr 2017 | 244.52 | 305.48 | 227.22 |
May 2017 | 244.73 | 306.38 | 227.21 |
Jun 2017 | 244.96 | 307.31 | 227.15 |
Jul 2017 | 244.79 | 308.17 | 226.73 |
Aug 2017 | 245.52 | 309.48 | 227.27 |
Sep 2017 | 246.82 | 310.27 | 228.83 |
Oct 2017 | 246.66 | 311.50 | 228.22 |
Nov 2017 | 246.67 | 312.67 | 228.10 |
Dec 2017 | 246.52 | 313.90 | 227.58 |
Jan 2018 | 247.87 | 314.79 | 229.08 |
Feb 2018 | 248.99 | 315.28 | 230.36 |
Mar 2018 | 249.55 | 315.88 | 230.69 |
Apr 2018 | 250.55 | 316.76 | 231.74 |
May 2018 | 251.59 | 317.49 | 232.73 |
Jun 2018 | 251.99 | 318.32 | 233.05 |
Jul 2018 | 252.01 | 319.35 | 232.76 |
Aug 2018 | 252.15 | 320.65 | 232.62 |
Sep 2018 | 252.44 | 321.53 | 232.87 |
Oct 2018 | 252.89 | 322.63 | 233.23 |
Nov 2018 | 252.04 | 323.97 | 231.86 |
Dec 2018 | 251.23 | 324.82 | 230.49 |
Jan 2019 | 251.71 | 325.60 | 230.77 |
Feb 2019 | 252.78 | 326.35 | 231.79 |
Mar 2019 | 254.20 | 327.51 | 233.29 |
Apr 2019 | 255.55 | 328.68 | 234.72 |
May 2019 | 256.09 | 329.33 | 235.13 |
Jun 2019 | 256.14 | 330.65 | 234.79 |
Jul 2019 | 256.57 | 331.61 | 235.07 |
Aug 2019 | 256.56 | 332.64 | 234.85 |
Sep 2019 | 256.76 | 333.83 | 234.80 |
Oct 2019 | 257.35 | 334.68 | 235.54 |
Nov 2019 | 257.21 | 335.82 | 235.16 |
Dec 2019 | 256.97 | 336.79 | 234.66 |
Jan 2020 | 257.97 | 337.83 | 235.55 |
Feb 2020 | 258.68 | 338.62 | 236.08 |
Mar 2020 | 258.12 | 339.52 | 235.18 |
Apr 2020 | 256.39 | 340.14 | 232.86 |
May 2020 | 256.39 | 340.81 | 232.60 |
Jun 2020 | 257.80 | 341.29 | 234.32 |
Jul 2020 | 259.10 | 341.95 | 235.82 |
Aug 2020 | 259.92 | 342.44 | 236.79 |
Sep 2020 | 260.28 | 342.91 | 237.24 |
Oct 2020 | 260.39 | 343.62 | 237.33 |
Nov 2020 | 260.23 | 344.04 | 237.05 |
Dec 2020 | 260.47 | 344.46 | 237.29 |
Jan 2021 | 261.58 | 344.76 | 238.59 |
Feb 2021 | 263.01 | 345.24 | 240.29 |
Mar 2021 | 264.88 | 345.72 | 242.43 |
Apr 2021 | 267.05 | 346.27 | 244.96 |
May 2021 | 269.20 | 347.02 | 247.48 |
Jun 2021 | 271.70 | 347.83 | 250.26 |
Jul 2021 | 273.00 | 348.47 | 251.47 |
Aug 2021 | 273.57 | 349.71 | 252.07 |
Sep 2021 | 274.31 | 351.26 | 252.66 |
Oct 2021 | 276.59 | 352.89 | 255.34 |
Nov 2021 | 277.95 | 354.53 | 256.71 |
Dec 2021 | 278.80 | 355.93 | 257.43 |
Jan 2022 | 281.15 | 357.74 | 260.16 |
Feb 2022 | 283.72 | 359.63 | 262.95 |
Mar 2022 | 287.50 | 361.08 | 267.42 |
Apr 2022 | 289.11 | 362.95 | 268.97 |
May 2022 | 292.30 | 365.12 | 272.55 |
Jun 2022 | 296.31 | 367.93 | 277.19 |
Jul 2022 | 296.28 | 370.45 | 276.42 |
Aug 2022 | 296.17 | 373.28 | 275.41 |
Sep 2022 | 296.81 | 376.57 | 275.38 |
Oct 2022 | 298.01 | 379.44 | 276.15 |
Nov 2022 | 297.71 | 382.56 | 274.96 |
Dec 2022 | 296.80 | 385.65 | 272.71 |
Jan 2023 | 299.17 | 388.37 | 274.98 |
Note: CPI = Consumer Price Index. Source: U.S. Bureau of Labor Statistics. | |||
The U.S. all items index, U.S. rent index, and U.S. all items less shelter index all rose steadily from January 2013 to January 2023. (See chart 1.) The U.S. all items index rose nearly 30 percent, averaging a 2.65-percent rise annually, while the U.S. rent index rose over 45 percent, averaging a 3.91-percent rise annually. The all items less shelter index rose more slowly than the all items index, with an average annual increase of 2.20 percent throughout the 10-year period. All three indexes had higher average annual increases from 2018 to 2023 than they did from 2013 to 2018. (See table 1.) This acceleration is similarly reflected during the time in which the COVID-19 pandemic was particularly strong, from March 2020 to January 2023, when all three indexes had higher average annual advances compared to any other 3-year period from 2013 to 2023. These findings indicate the pandemic’s impact on consumer inflation and how increasing rental costs have continued to drive rising price changes in the U.S. all items index.
Period | All items index | Rent index | All items less shelter index |
|---|---|---|---|
2013–23 | 2.65 | 3.91 | 2.20 |
2013–18 | 1.48 | 3.53 | 0.70 |
2018–23 | 3.83 | 4.29 | 3.72 |
March 2020–January 2023 | 5.35 | 4.86 | 5.67 |
Note: CPI = Consumer Price Index. Source: U.S. Bureau of Labor Statistics. | |||
To understand how rates of rent inflation have changed since the onset of the COVID-19 pandemic, changes in rental prices can be examined by region to determine where regional trends have shifted. Rent inflation rates nationally and in the Northeast, Midwest, and South trended together from the start of 2013 until the effects of the COVID-19 pandemic began in the United States in March 2020.7 From the end of 2013 until the beginning of the pandemic, rent changes in the West trended higher than the other U.S. regions and the national average, increasing threefold. However, at the onset of the pandemic, all four regions experienced disinflation in their housing rental prices, with the rate of rent inflation temporarily slowing down. Changes in rental inflation from March 2020 to January 2023 have revealed new trends among the regions that differ from those present prior to the beginning of the pandemic.
Period | Northeast | Midwest | South | West | U.S. average |
|---|---|---|---|---|---|
Jan 2013 | 2.3 | 2.4 | 3.1 | 2.8 | 2.7 |
Feb 2013 | 2.7 | 2.3 | 3.0 | 2.8 | 2.7 |
Mar 2013 | 2.9 | 2.2 | 3.0 | 2.8 | 2.8 |
Apr 2013 | 2.7 | 2.1 | 2.9 | 2.9 | 2.7 |
May 2013 | 2.7 | 2.1 | 3.0 | 3.1 | 2.8 |
Jun 2013 | 2.7 | 2.2 | 3.3 | 3.0 | 2.9 |
Jul 2013 | 2.6 | 2.3 | 3.2 | 3.0 | 2.8 |
Aug 2013 | 2.6 | 2.2 | 3.5 | 3.2 | 3.0 |
Sep 2013 | 2.6 | 2.1 | 3.3 | 3.3 | 3.0 |
Oct 2013 | 2.7 | 2.0 | 2.6 | 3.3 | 2.8 |
Nov 2013 | 2.8 | 2.2 | 2.6 | 3.2 | 2.8 |
Dec 2013 | 2.8 | 2.2 | 2.9 | 3.2 | 2.9 |
Jan 2014 | 3.0 | 2.3 | 2.6 | 3.3 | 2.9 |
Feb 2014 | 2.6 | 2.3 | 2.8 | 3.3 | 2.8 |
Mar 2014 | 2.4 | 2.1 | 3.2 | 3.3 | 2.9 |
Apr 2014 | 2.7 | 2.1 | 3.4 | 3.4 | 3.1 |
May 2014 | 2.6 | 2.1 | 3.5 | 3.5 | 3.1 |
Jun 2014 | 2.6 | 2.1 | 3.4 | 3.9 | 3.2 |
Jul 2014 | 2.7 | 2.1 | 3.4 | 4.1 | 3.3 |
Aug 2014 | 2.7 | 2.1 | 3.3 | 3.9 | 3.2 |
Sep 2014 | 2.7 | 2.5 | 3.5 | 3.9 | 3.3 |
Oct 2014 | 2.5 | 2.6 | 3.6 | 4.1 | 3.3 |
Nov 2014 | 2.7 | 2.6 | 3.9 | 4.1 | 3.5 |
Dec 2014 | 2.6 | 2.6 | 3.8 | 3.9 | 3.4 |
Jan 2015 | 2.4 | 2.4 | 3.9 | 4.0 | 3.4 |
Feb 2015 | 2.8 | 2.6 | 4.0 | 4.2 | 3.5 |
Mar 2015 | 2.7 | 2.8 | 3.8 | 4.2 | 3.5 |
Apr 2015 | 2.4 | 2.8 | 3.7 | 4.3 | 3.5 |
May 2015 | 2.5 | 2.8 | 3.5 | 4.4 | 3.5 |
Jun 2015 | 2.6 | 3.0 | 3.7 | 4.3 | 3.5 |
Jul 2015 | 2.8 | 2.9 | 3.8 | 4.2 | 3.6 |
Aug 2015 | 2.5 | 2.8 | 4.1 | 4.3 | 3.6 |
Sep 2015 | 3.0 | 2.6 | 4.0 | 4.4 | 3.7 |
Oct 2015 | 3.1 | 2.6 | 4.1 | 4.5 | 3.7 |
Nov 2015 | 2.9 | 2.6 | 3.8 | 4.5 | 3.6 |
Dec 2015 | 3.0 | 2.6 | 3.5 | 4.8 | 3.7 |
Jan 2016 | 3.0 | 2.7 | 3.5 | 4.8 | 3.7 |
Feb 2016 | 3.0 | 2.8 | 3.3 | 4.9 | 3.7 |
Mar 2016 | 3.0 | 2.7 | 3.3 | 4.9 | 3.7 |
Apr 2016 | 3.1 | 2.8 | 3.4 | 4.9 | 3.7 |
May 2016 | 3.0 | 2.9 | 3.6 | 4.9 | 3.8 |
Jun 2016 | 2.9 | 2.8 | 3.5 | 5.2 | 3.8 |
Jul 2016 | 2.8 | 2.9 | 3.3 | 5.3 | 3.8 |
Aug 2016 | 2.9 | 3.0 | 3.1 | 5.4 | 3.8 |
Sep 2016 | 2.5 | 2.9 | 3.1 | 5.4 | 3.7 |
Oct 2016 | 2.7 | 2.8 | 3.2 | 5.6 | 3.8 |
Nov 2016 | 2.7 | 2.8 | 3.3 | 5.7 | 3.9 |
Dec 2016 | 2.8 | 2.9 | 3.5 | 5.7 | 4.0 |
Jan 2017 | 2.7 | 2.9 | 3.5 | 5.7 | 3.9 |
Feb 2017 | 2.6 | 2.6 | 3.6 | 5.6 | 3.9 |
Mar 2017 | 2.7 | 2.8 | 3.4 | 5.6 | 3.9 |
Apr 2017 | 2.6 | 3.0 | 3.4 | 5.5 | 3.8 |
May 2017 | 2.5 | 3.0 | 3.5 | 5.5 | 3.8 |
Jun 2017 | 2.6 | 2.9 | 3.6 | 5.4 | 3.9 |
Jul 2017 | 2.4 | 2.9 | 3.6 | 5.4 | 3.8 |
Aug 2017 | 2.7 | 2.8 | 3.8 | 5.3 | 3.9 |
Sep 2017 | 2.5 | 2.9 | 3.9 | 4.9 | 3.8 |
Oct 2017 | 2.2 | 3.0 | 3.9 | 4.8 | 3.7 |
Nov 2017 | 2.3 | 3.1 | 3.9 | 4.7 | 3.7 |
Dec 2017 | 2.2 | 3.2 | 3.8 | 4.8 | 3.7 |
Jan 2018 | 2.4 | 3.3 | 3.8 | 4.7 | 3.7 |
Feb 2018 | 2.4 | 3.3 | 3.7 | 4.6 | 3.6 |
Mar 2018 | 2.4 | 3.3 | 3.8 | 4.4 | 3.6 |
Apr 2018 | 2.6 | 3.1 | 3.7 | 4.7 | 3.7 |
May 2018 | 2.5 | 3.0 | 3.7 | 4.6 | 3.6 |
Jun 2018 | 2.4 | 3.0 | 3.6 | 4.6 | 3.6 |
Jul 2018 | 2.5 | 3.0 | 3.7 | 4.6 | 3.6 |
Aug 2018 | 2.4 | 3.2 | 3.5 | 4.7 | 3.6 |
Sep 2018 | 2.4 | 3.1 | 3.3 | 4.9 | 3.6 |
Oct 2018 | 2.5 | 3.3 | 3.2 | 4.8 | 3.6 |
Nov 2018 | 2.5 | 3.3 | 3.2 | 4.8 | 3.6 |
Dec 2018 | 2.5 | 3.2 | 3.1 | 4.6 | 3.5 |
Jan 2019 | 2.4 | 3.1 | 3.1 | 4.5 | 3.4 |
Feb 2019 | 2.5 | 3.2 | 3.2 | 4.6 | 3.5 |
Mar 2019 | 2.5 | 3.3 | 3.3 | 5.0 | 3.7 |
Apr 2019 | 2.8 | 3.3 | 3.4 | 5.0 | 3.8 |
May 2019 | 2.7 | 3.4 | 3.4 | 4.9 | 3.7 |
Jun 2019 | 3.0 | 3.4 | 3.5 | 5.0 | 3.9 |
Jul 2019 | 3.0 | 3.2 | 3.4 | 5.0 | 3.8 |
Aug 2019 | 3.0 | 3.0 | 3.5 | 4.8 | 3.7 |
Sep 2019 | 3.2 | 3.2 | 3.5 | 4.8 | 3.8 |
Oct 2019 | 2.9 | 3.0 | 3.4 | 4.9 | 3.7 |
Nov 2019 | 3.1 | 2.9 | 3.3 | 4.7 | 3.7 |
Dec 2019 | 3.0 | 3.1 | 3.4 | 4.6 | 3.7 |
Jan 2020 | 3.0 | 3.3 | 3.6 | 4.6 | 3.8 |
Feb 2020 | 3.0 | 3.3 | 3.6 | 4.6 | 3.8 |
Mar 2020 | 2.9 | 3.2 | 3.7 | 4.3 | 3.7 |
Apr 2020 | 2.7 | 3.2 | 3.5 | 4.2 | 3.5 |
May 2020 | 2.6 | 3.1 | 3.4 | 4.2 | 3.5 |
Jun 2020 | 2.4 | 3.3 | 3.1 | 3.8 | 3.2 |
Jul 2020 | 2.3 | 3.3 | 3.3 | 3.4 | 3.1 |
Aug 2020 | 2.1 | 3.4 | 3.1 | 3.2 | 2.9 |
Sep 2020 | 2.1 | 3.0 | 2.9 | 2.8 | 2.7 |
Oct 2020 | 2.1 | 3.0 | 3.1 | 2.4 | 2.7 |
Nov 2020 | 2.0 | 3.0 | 2.8 | 2.1 | 2.4 |
Dec 2020 | 1.8 | 2.7 | 2.8 | 1.9 | 2.3 |
Jan 2021 | 1.5 | 2.4 | 2.7 | 1.7 | 2.1 |
Feb 2021 | 1.5 | 2.4 | 2.5 | 1.6 | 2.0 |
Mar 2021 | 1.4 | 2.5 | 2.2 | 1.5 | 1.8 |
Apr 2021 | 1.3 | 2.5 | 2.2 | 1.5 | 1.8 |
May 2021 | 1.3 | 2.5 | 2.2 | 1.5 | 1.8 |
Jun 2021 | 1.3 | 2.6 | 2.4 | 1.6 | 1.9 |
Jul 2021 | 1.1 | 3.0 | 2.2 | 1.6 | 1.9 |
Aug 2021 | 1.2 | 3.0 | 2.5 | 2.0 | 2.1 |
Sep 2021 | 1.1 | 3.5 | 3.1 | 2.2 | 2.4 |
Oct 2021 | 1.3 | 3.5 | 3.4 | 2.6 | 2.7 |
Nov 2021 | 1.3 | 3.7 | 3.8 | 3.1 | 3.0 |
Dec 2021 | 1.7 | 3.7 | 4.1 | 3.4 | 3.3 |
Jan 2022 | 2.0 | 4.2 | 4.6 | 3.9 | 3.8 |
Feb 2022 | 2.3 | 4.3 | 5.3 | 4.2 | 4.2 |
Mar 2022 | 2.3 | 4.6 | 5.7 | 4.5 | 4.4 |
Apr 2022 | 2.5 | 4.8 | 6.3 | 4.9 | 4.8 |
May 2022 | 2.8 | 5.0 | 7.1 | 5.0 | 5.2 |
Jun 2022 | 3.3 | 5.3 | 7.9 | 5.6 | 5.8 |
Jul 2022 | 3.7 | 5.4 | 8.8 | 6.1 | 6.3 |
Aug 2022 | 4.0 | 5.8 | 9.4 | 6.4 | 6.7 |
Sep 2022 | 4.5 | 5.9 | 9.9 | 6.9 | 7.2 |
Oct 2022 | 4.8 | 6.3 | 10.2 | 7.2 | 7.5 |
Nov 2022 | 5.3 | 6.6 | 10.9 | 7.3 | 7.9 |
Dec 2022 | 5.8 | 7.0 | 11.4 | 7.7 | 8.3 |
Jan 2023 | 6.2 | 7.1 | 11.3 | 8.1 | 8.6 |
Note: CPI = Consumer Price Index. Source: U.S. Bureau of Labor Statistics. | |||||
Excluding the period of disinflation at the beginning of the pandemic, changes in rent inflation in all four regions rose consistently from January 2013 to January 2023. (See chart 2.) Rent prices in the West saw the highest acceleration throughout the decade, averaging a 4.52-percent increase annually. Rent inflation was the slowest in the Northeast, averaging a 2.86-percent rise annually. (See table 2.) Changes in rent prices also rose in the South and in the Midwest from 2013 to 2023, with an average annual increase of 4.24 percent and 3.35 percent, respectively. All four regions had higher average annual increases in the 2018–23 period than they did in the 2013–18 period. The difference between the two 5-year periods was most prevalent in the South and least prevalent in the West, where average annual price changes increased 1.54 percent and 0.03 percent, respectively. All four regions experienced higher average annual increases in rental prices from March 2020 to January 2023, during the COVID-19 pandemic, compared with any other interval within the 10-year period. These findings show the pandemic’s broad impact on regional rent prices and how that impact has varied among the four regions.
Period | Northeast | Midwest | South | West |
|---|---|---|---|---|
2013–23 | 2.86 | 3.35 | 4.24 | 4.52 |
2013–18 | 2.71 | 2.72 | 3.47 | 4.51 |
2018–23 | 3.02 | 3.99 | 5.01 | 4.54 |
March 2020–January 2023 | 3.30 | 4.65 | 6.27 | 4.59 |
Note: CPI = Consumer Price Index. Source: U.S. Bureau of Labor Statistics. | ||||
Changes in rent prices in the West for most of the 2013–23 period were higher in comparison with the other three regions, as well as the United States as a whole. (See chart 2.) However, as the effects of the COVID-19 pandemic began to take hold in the latter half of 2020, Western rent price changes began to slow to a lower rate than in the South, the Midwest, and across the nation. Even as rent price changes in all regions accelerated upward beginning in mid-2021, rent prices in the West never took back their position as the region with the highest rate of inflation. Instead, the rate of rent increases in the West was more similar to the national average than they had been in the prior 5-year period.
From October 2020 to January 2023, the three self-representing Western metropolitan areas that contributed the most to the region’s rent inflation were Los Angeles–Long Beach–Anaheim, CA; Phoenix–Mesa–Scottsdale, AZ; and Seattle–Tacoma–Bellevue, WA, which represented nearly 30 percent of the region’s change in rental prices.8 (See table 3.) The contribution of an index area to its regional rental price movement is a function of its spending weight share and price change over time. For example, the increase in rents in the Los Angeles–Long Beach–Anaheim area contributed 11.78 percent of the overall rent increase in the West from October 2020 to January 2023. In other words, the Los Angeles–Long Beach–Anaheim area alone accounted for 1.47 percentage points of the overall 12.50-percent increase in rents. The ratio of the difference in the change in weight for each Western metropolitan area to the change in weight of Western rents overall indicates the contribution.
Area | Contribution | |
|---|---|---|
West—size class B/C | 49.56 | |
Los Angeles–Long Beach–Anaheim, CA | 11.78 | |
Phoenix–Mesa–Scottsdale, AZ | 9.40 | |
Seattle–Tacoma–Bellevue, WA | 7.80 | |
Denver–Aurora–Lakewood, CO | 7.66 | |
Riverside–San Bernadino–Ontario, CA | 5.78 | |
San Diego–Carlsbad, CA | 5.03 | |
San Francisco–Oakland–Hayward, CA | 3.00 | |
Total | 100.00 | |
Note: Values may not sum to total because of rounding. Size class B/C includes all areas in the region with 2.5 million people or fewer. Source: U.S. Bureau of Labor Statistics. | ||
For a majority of the 2013–23 period, changes in rental prices in the Northeast trended near those of the Midwest and were lower in comparison with the U.S. average, the West, and the South. (See chart 2.) However, the COVID-19 pandemic also impacted rent inflation in the Northeast. By August 2020, changes in rental prices in the Northeast were lower than in any other region and in the United States overall. Even as rents were subject to disinflation in every region at the beginning of the pandemic, rent changes in the Northeast continued to be the lowest among the other regions and the national average. This trend continued into the beginning of 2023. Although lower rental inflation in the Northeast relative to other regions and the national average did occur prior to the beginning of the COVID-19 pandemic, once the pandemic began, increases in Northeastern rents were and remained markedly lower than that of any other region.
From August 2020 to March 2022, the self-representing metropolitan area that contributed the most to rental increases in the Northeast was Philadelphia–Camden–Wilmington, PA–NJ–DE–MD, representing over 15 percent of the region’s rent inflation. (See table 4.) For example, the increase in rents in the Philadelphia–Camden–Wilmington area contributed 15.79 percent of the overall rent increase in the Northeast from August 2020 to March 2022, accounting for 0.48 percentage points of the overall 3.04-percent increase in rents. The ratio of the difference in the change in weight for each Northeastern metropolitan area to the change in weight of Northeastern rents overall indicates the contribution.
Area | Contribution | |
|---|---|---|
Northeast—size class B/C | 66.20 | |
Philadelphia–Camden–Wilmington, PA–NJ–DE–MD | 15.79 | |
New York–Newark–Jersey City, NY–NJ–PA | 10.10 | |
Boston–Cambridge–Newtown, MA–NH | 7.91 | |
Total | 100.00 | |
Note: Values may not sum to total because of rounding. Size class B/C includes all areas in the region with 2.5 million people or fewer. Source: U.S. Bureau of Labor Statistics. | ||
Changes in rent prices in the South for the past decade have trended consistently with those in the Midwest, as well as nationally. (See chart 2.) However, the COVID-19 pandemic also influenced changes in rents in the South. Halfway through 2020, Southern rent price increases exceeded the national average, and by the end of 2021, the South became the region with the highest rate of rent inflation. This trend continued into the beginning of 2023. Although advances in the rate of rental prices in all regions increased markedly since the COVID-19 pandemic began, rent inflation in the South outpaced all other regions, reaching record high rates for the 10-year period.
From November 2021 to January 2023, the three self-representing metropolitan areas that contributed the most to rental increases in the South were Miami–Ft. Lauderdale–West Palm Beach, FL; Dallas–Fort Worth–Arlington, TX; and Atlanta–Sandy Springs–Roswell, GA, representing over 20 percent of the region’s rent inflation. (See table 5.) For example, the increase in rents in the Miami–Ft. Lauderdale–West Palm Beach, FL area contributed 9.22 percent of the overall rent increase in the South from November 2021 to January 2023 and so accounted for 1.17 percentage points of the overall 12.68-percent increase in rents. The ratio of the difference in the change in weight for each Southern metropolitan area to the change in weight of Southern rents overall indicates the contribution.
Area | Contribution | |
|---|---|---|
South—size class B/C | 62.01 | |
Miami–Ft. Lauderdale–West Palm Beach, FL | 9.22 | |
Dallas–Fort Worth–Arlington, TX | 7.00 | |
Atlanta–Sandy Springs–Roswell, GA | 6.55 | |
Houston–Woodlands–Sugar Land, TX | 5.59 | |
Washington–Arlington–Alexandria, DC–VA–MD–WV | 4.30 | |
Tampa–St. Petersburg–Clearwater, FL | 4.01 | |
Baltimore–Columbia–Towson, MD | 1.33 | |
Total | 100.00 | |
Note: Values may not sum to total because of rounding. Size class B/C includes all areas in the region with 2.5 million people or fewer. Source: U.S. Bureau of Labor Statistics. | ||
Changes in rental prices in the Midwest from 2013 to 2023 trended with those in the South and in the Northeast and remained consistently below the national average. (See chart 2.) In June 2020, Midwestern rental price increases trended higher than the national average for the first time in the 2013–23 decade; this trend continued through March 2022. Furthermore, from March 2021 to October 2021, rent inflation in the Midwest was higher than the national average and all other regions.
From June 2020 to March 2022, the two self-representing metropolitan areas that contributed the most to rental increases in the Midwest were Detroit–Warren–Dearborn, MI, and Chicago–Naperville–Elgin, IL–IN–WI, representing over a quarter of the region’s rent inflation. (See table 6.) For example, the increase in rents in the Detroit–Warren–Dearborn area contributed 15.34 percent of the overall rent increase in the Midwest from June 2020 to March 2022, accounting for 0.98 percentage points of the overall 6.41-percent increase in rents. The ratio of the difference in the change in weight for each Midwestern metropolitan area to the change in weight of Midwestern rents overall indicates the contribution.
Area | Contribution | |
|---|---|---|
Midwest—size class B/C | 60.89 | |
Detroit–Warren–Dearborn, MI | 15.34 | |
Chicago–Naperville–Elgin, IL–IN–WI | 12.94 | |
Minneapolis–St. Paul–Bloomington, MN–WI | 6.37 | |
St. Louis, MO–IL | 4.46 | |
Total | 100.00 | |
Note: Values may not sum to total because of rounding. Size class B/C includes all areas in the region with 2.5 million people or fewer. Source: U.S. Bureau of Labor Statistics. | ||
Since the beginning of the COVID-19 pandemic, the change in rents across the nation has varied by geographic region. In the West, changes in rents mirrored the national average more closely than they had prior to 2020, when the region had some of the highest rates of rent inflation in the nation. Whereas in the Midwest, changes in rents reached new heights for the decade after the pandemic began, trending higher than other regions and the national average. Soon after the pandemic's onset, changes in rents in the South accelerated faster than in the other regions and continued to do so through the beginning of 2023. In the Northeast, rent changes were and remain markedly low compared with other regions, despite the impacts of the pandemic. Rents are a major contributor to the U.S. all items index, but changes in rents vary geographically, and so the effects of rent increases on the larger economy will also vary by region. These results provide insight into how rent inflation changed before and after the start of the COVID-19 pandemic, how the pandemic’s impact varied between each geographic region, and how increases in rents have driven inflation overall.
Nachelle Jackson, "CPI rent regional trends and the impact of the COVID-19 pandemic," Monthly Labor Review, U.S. Bureau of Labor Statistics, April 2026, https://doi.org/10.21916/mlr.2026.8
1 Consumer Price Index—December 2022, USDL-23-0017 (U.S. Department of Labor, January 12, 2023), https://www.bls.gov/news.release/archives/cpi_01122023.htm.
2 “Measuring price change in the CPI: rent and rental equivalence,” Consumer Price Index (U.S. Bureau of Labor Statistics, March 17, 2023), https://www.bls.gov/cpi/factsheets/owners-equivalent-rent-and-rent.htm.
3 For a map of the sampling units, see U.S. Bureau of Labor Statistics, Consumer Price Index PSUs in the United States, 2018 Revision (U.S. Department of Labor, 2018), https://www.bls.gov/cpi/additional-resources/geographic-revision-map.pdf.
4 “Measuring price change in the CPI,” Consumer Price Index.
5 “Measuring price change in the CPI,” Consumer Price Index.
6 For more information on the program’s concepts and methods, see “Consumer Price Index” in Handbook of Methods (U.S. Bureau of Labor Statistics, last modified February 29, 2025), https://www.bls.gov/opub/hom/cpi/concepts.htm.
7 For more information on the four census regions, see “Geographic levels” (U.S. Census Bureau, last updated October 8, 2021), https://www.census.gov/programs-surveys/economic-census/guidance-geographies/levels.html.
8 The period for each region was chosen to reflect when that respective region was likely most impacted by the effects of the COVID-19 pandemic. The timing and effects of the pandemic vary in each region’s housing market because each region’s housing market is unique.