An official website of the United States government
 United States Department of Labor
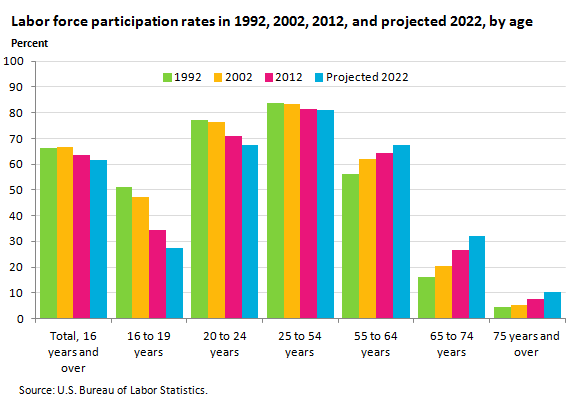
The labor force participation rate increased in the 1970s, 1980s, and 1990s and reached an all-time high during the 1997–2000 period. The rate declined during and after the 2001 recession before stabilizing from 2004 to 2008. The labor force participation rate fell in 2009 and continued to fall after the 2007–2009 recession ended. As the baby-boom generation ages and begins to retire, BLS projects that the overall labor force participation rate will continue to decline to 2022.

| Age | 1992 | 2002 | 2012 | Projected 2022 |
|---|---|---|---|---|
Total, 16 years and over | 66.4 | 66.6 | 63.7 | 61.6 |
16 to 19 years | 51.3 | 47.4 | 34.3 | 27.3 |
20 to 24 years | 77.1 | 76.4 | 70.9 | 67.3 |
25 to 54 years | 83.6 | 83.3 | 81.4 | 81.0 |
55 to 64 years | 56.2 | 61.9 | 64.5 | 67.5 |
65 to 74 years | 16.3 | 20.4 | 26.8 | 31.9 |
75 years and over | 4.5 | 5.1 | 7.6 | 10.5 |
The labor force participation rate is the percentage of the civilian noninstitutional population in the labor force. The rate is typically lower for 16- to 19-year-olds than for other age groups. The rate is highest among 25- to 54-year-olds and then declines sharply after age 55.
Declining labor force participation rates of young people are pushing down the overall participation rate. The major reason for this decrease has been an increase in school attendance at all levels. The participation rate for people ages 16 to 19 years fell from 47.4 percent in 2002 to 34.3 percent in 2012. BLS projects this rate to decrease further, to 27.3 percent in 2022. In a similar manner, the participation rate of 20- to 24-year-olds decreased from 76.4 percent in 2002 to 70.9 percent in 2012. BLS projects that this rate will decrease as well, to 67.3 percent in 2022.
The labor force participation rate is highest among 25- to 54-year-olds, surpassing 80 percent for the last several decades. Since 2000, however, the rate has trended downward. The participation rate of 25- to 54-year-olds dropped from 83.3 percent in 2002 to 81.4 percent in 2012. BLS projects the rate to decline slightly further, to 81.0 percent in 2022.
Labor force participation rates of people age 55 and over have risen in recent decades, and BLS projects the rates to rise further. Among 55- to 64-year-olds, the participation rate was 61.9 percent in 2002 and increased to 64.5 percent in 2012. BLS projects their participation rate to increase further, to 67.5 percent in 2022. The participation rate for people ages 65 to 74 years was 20.4 percent in 2002 and rose to 26.8 percent in 2012. BLS projects the rate for this age group to continue increasing, to 31.9 percent in 2022. People age 75 and over participate in the labor force at comparatively low rates, but BLS also projects their participation rate to rise from 7.6 percent in 2012 to 10.5 percent in 2022.
These projections are from the BLS Employment Projections program. To learn more, see “Labor force projections to 2022: the labor force participation rate continues to fall,” by Mitra Toossi, Monthly Labor Review, December 2013.
Bureau of Labor Statistics, U.S. Department of Labor, The Economics Daily, Labor force participation projected to fall for people under age 55 and rise for older age groups at https://www.bls.gov/opub/ted/2014/ted_20140106.htm (visited November 19, 2025).

