An official website of the United States government
An official website of the United States government
The .gov means it's official.
Federal government websites often end in .gov or .mil. Before sharing sensitive information,
make sure you're on a federal government site.
The site is secure.
The
https:// ensures that you are connecting to the official website and that any
information you provide is encrypted and transmitted securely.
24-2622-CHI
Friday, January 03, 2025
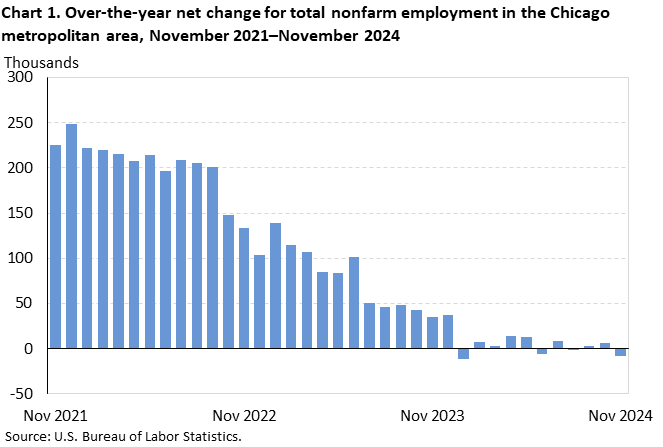
Total nonfarm employment for Chicago-Naperville-Elgin, IL-IN-WI, metropolitan area stood at 4,817,600 in November 2024 compared to 4,825,100 a year ago, the U.S. Bureau of Labor Statistics reported today. (See chart 1 and table 1.) Regional Commissioner Jason Palmer noted that the employment change over the year was not statistically significant. Nationally, employment rose 1.4 percent over the year. (All data in this release are not seasonally adjusted; accordingly, over-the-year analysis is used throughout.)
Chicago-Naperville-Elgin, IL-IN-WI, is made up of four metropolitan divisions—separately identifiable employment centers within the greater metropolitan area. Employment in Chicago-Naperville-Arlington Heights, IL, was 3,840,900 and accounted for 80 percent of the metropolitan area's total nonfarm employment. Lake County-Kenosha County, IL-WI, employed 421,500, accounting for 9 percent of the area’s employment, while Elgin, IL, and Gary, IN, each accounted for 6 percent of the area’s employment. Employment levels for these four divisions were little changed over the year.
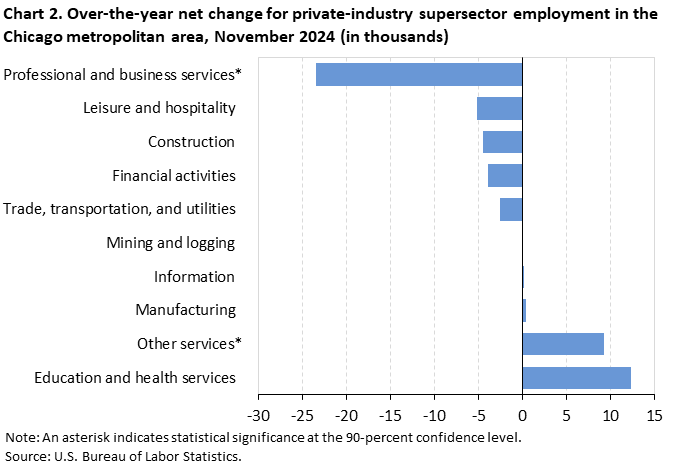
Industry employmentAmong the private-industry supersectors in Chicago-Naperville-Elgin, IL-IN-WI, professional and business services lost 23,400 jobs. (See chart 2.) The Chicago-Naperville-Arlington Heights, IL, division lost 19,100 jobs, or 82 percent of the metropolitan area's employment decline in this industry. The 2.8-percent decrease in the metropolitan area’s professional and business services supersector compared to the 0.3-percent gain at the national level.
Other services added 9,300 jobs in the metropolitan area. The Chicago-Naperville-Arlington Heights, IL, division added 8,500 jobs, or 91 percent of the metropolitan area's employment increase in this industry. The 4.7-percent increase in the metropolitan area’s other services supersector compared to the 1.1-percent gain at the national level.
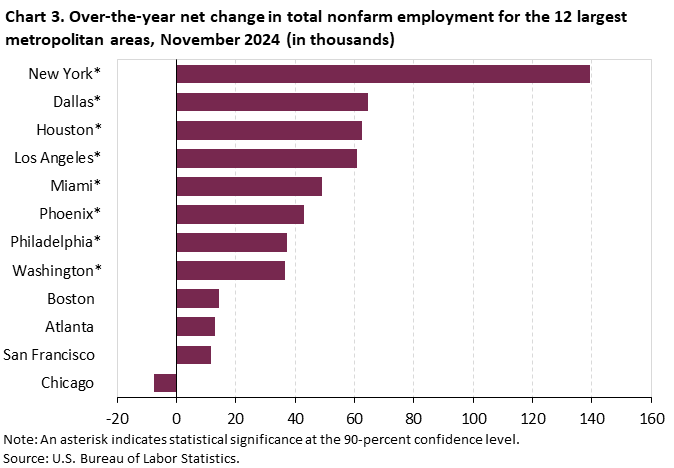
Chicago-Naperville-Elgin, IL-IN-WI, was 1 of the nation’s 12 largest metropolitan statistical areas in November 2024. Eight of twelve areas gained total nonfarm payroll employment over the year. The largest job gain occurred in New York-Newark-Jersey City, NY-NJ-PA (+139,200). Washington-Arlington-Alexandria, DC-VA-MD-WV (+36,600), had the smallest employment increase, followed by Philadelphia-Camden-Wilmington, PA-NJ-DE-MD (+37,400), among the areas with significant changes. (See table 2 and chart 3.)
Significant increases in employment ranged from 1.8 percent (Houston-The Woodlands-Sugar Land, TX) to 1.0 percent (Los Angeles-Long Beach-Anaheim, CA).
The Metropolitan Area Employment and Unemployment release for December 2024 is scheduled to be released on Wednesday, February 5, 2025, at 10:00 a.m. (ET).
With the release of January 2025 data on March 17, 2025, the Current Employment Statistics (CES) metropolitan statistical area (MSA) estimates will be updated to reflect the revised delineations based on the 2020 Census, available in OMB Bulletin No. 23-01. As a result of this update, new MSAs will be added to publication, some existing MSAs will undergo name and/or compositional changes, and other existing areas will be dropped from publication. Details of these changes will be published in the annual CES State and Area benchmark article on March 17, 2025. More information about MSA definitions in the CES program, including current and previous definitions used, is available online.
This release presents nonfarm payroll employment estimates from the CES program. More information about the CES data is available in the State Employment and Unemployment Summary and the Metropolitan Area Employment and Unemployment Summary. See the Metropolitan Area Employment and Unemployment Technical Note for more information on definitions and methodology.
Reliability of the employment estimates. The estimates presented in this release are based on sample surveys, administrative data, and modeling and, thus, are subject to sampling and other types of errors. Changes in metropolitan area nonfarm payroll employment are cited in the analysis of this release only if they have been determined to be statistically significant at the 90-percent confidence level. Documentation on the reliability of state and area estimates is available for metropolitan areas and metropolitan divisions.
Area definitions. The substate area data published in this news release reflect the U.S. Office of Management and Budget delineations issued on April 10, 2018. The 12 metropolitan areas discussed in this release are the metropolitan areas with the largest population according to the U.S. Census Bureau.
The Chicago-Naperville-Elgin, IL-IN-WI Metropolitan Statistical Area includes Cook, DeKalb, DuPage, Grundy, Kane, Kendall, Lake, McHenry, and Will Counties in Illinois; Jasper, Lake, Newton, and Porter Counties in Indiana; and Kenosha County in Wisconsin.
The Chicago-Naperville-Arlington Heights, IL Metropolitan Division includes Cook, DuPage, Grundy, Kendall, McHenry, and Will Counties in Illinois.
The Elgin, IL Metropolitan Division includes DeKalb and Kane Counties.
The Lake County-Kenosha County, IL-WI Metropolitan Division includes Lake County in Illinois and Kenosha County in Wisconsin.
The Gary, IN Metropolitan Division includes Jasper, Lake, Newton, and Porter Counties in Indiana.
Additional information
State and area employment data from the CES program are available on the BLS website.
Information in this release will be made available to individuals with sensory impairments upon request. Voice phone: (202) 691-5200; Telecommunications Relay Service: 7-1-1.
| Area and Industry | Nov 2023 |
Sep 2024 |
Oct 2024 |
Nov 2024(p) |
Nov 2023 to Nov 2024(p) |
|
|---|---|---|---|---|---|---|
| Net change |
Percent change |
|||||
|
Chicago-Naperville-Elgin, IL-IN-WI Metropolitan Statistical Area |
||||||
|
Total nonfarm |
4,825.1 | 4,809.9 | 4,824.1 | 4,817.6 | -7.5 | -0.2 |
|
Mining and logging |
1.6 | 1.6 | 1.7 | 1.6 | 0.0 | 0.0 |
|
Construction |
188.5 | 191.7 | 191.7 | 184.0 | -4.5 | -2.4 |
|
Manufacturing |
418.4 | 420.0 | 419.8 | 418.8 | 0.4 | 0.1 |
|
Trade, transportation, and utilities |
988.8 | 967.5 | 973.0 | 986.2 | -2.6 | -0.3 |
|
Information |
77.0 | 75.3 | 75.6 | 77.2 | 0.2 | 0.3 |
|
Financial activities |
320.6 | 316.6 | 317.8 | 316.7 | -3.9 | -1.2 |
|
Professional and business services |
841.1 | 820.6 | 825.5 | 817.7 | -23.4 | -2.8 |
|
Education and health services |
777.8 | 782.3 | 787.6 | 790.1 | 12.3 | 1.6 |
|
Leisure and hospitality |
467.7 | 475.2 | 471.0 | 462.5 | -5.2 | -1.1 |
|
Other services |
197.5 | 202.5 | 204.2 | 206.8 | 9.3 | 4.7 |
|
Government |
546.1 | 556.6 | 556.2 | 556.0 | 9.9 | 1.8 |
|
Chicago-Naperville-Arlington Heights, IL Metropolitan Division |
||||||
|
Total nonfarm |
3,847.6 | 3,833.2 | 3,845.1 | 3,840.9 | -6.7 | -0.2 |
|
Mining and logging |
1.3 | 1.3 | 1.3 | 1.3 | 0.0 | 0.0 |
|
Construction |
140.1 | 142.2 | 142.3 | 136.9 | -3.2 | -2.3 |
|
Manufacturing |
283.8 | 285.5 | 285.1 | 284.1 | 0.3 | 0.1 |
|
Trade, transportation, and utilities |
775.6 | 758.7 | 762.7 | 771.6 | -4.0 | -0.5 |
|
Information |
70.1 | 68.5 | 68.8 | 70.4 | 0.3 | 0.4 |
|
Financial activities |
280.4 | 277.3 | 278.8 | 277.8 | -2.6 | -0.9 |
|
Professional and business services |
702.4 | 684.9 | 690.0 | 683.3 | -19.1 | -2.7 |
|
Education and health services |
644.6 | 647.7 | 652.0 | 653.7 | 9.1 | 1.4 |
|
Leisure and hospitality |
369.9 | 374.2 | 370.8 | 365.8 | -4.1 | -1.1 |
|
Other services |
159.7 | 164.4 | 165.9 | 168.2 | 8.5 | 5.3 |
|
Government |
419.7 | 428.5 | 427.4 | 427.8 | 8.1 | 1.9 |
|
Elgin, IL Metropolitan Division |
||||||
|
Total nonfarm |
267.6 | 266.2 | 267.9 | 267.2 | -0.4 | -0.1 |
|
Mining and logging |
0.1 | 0.1 | 0.2 | 0.1 | 0.0 | 0.0 |
|
Construction |
14.9 | 15.3 | 15.3 | 14.7 | -0.2 | -1.3 |
|
Manufacturing |
36.7 | 36.8 | 36.8 | 36.7 | 0.0 | 0.0 |
|
Trade, transportation, and utilities |
52.0 | 51.8 | 52.2 | 52.8 | 0.8 | 1.5 |
|
Information |
2.2 | 2.2 | 2.2 | 2.2 | 0.0 | 0.0 |
|
Financial activities |
9.9 | 9.8 | 9.8 | 9.8 | -0.1 | -1.0 |
|
Professional and business services |
38.6 | 37.4 | 37.5 | 37.1 | -1.5 | -3.9 |
|
Education and health services |
33.8 | 34.2 | 34.5 | 34.5 | 0.7 | 2.1 |
|
Leisure and hospitality |
25.1 | 24.6 | 24.3 | 23.8 | -1.3 | -5.2 |
|
Other services |
10.1 | 10.2 | 10.4 | 10.5 | 0.4 | 4.0 |
|
Government |
44.2 | 43.8 | 44.7 | 45.0 | 0.8 | 1.8 |
|
Lake County-Kenosha County, IL-WI Metropolitan Division |
||||||
|
Total nonfarm |
425.1 | 423.5 | 423.2 | 421.5 | -3.6 | -0.8 |
|
Mining and logging |
0.1 | 0.1 | 0.1 | 0.1 | 0.0 | 0.0 |
|
Construction |
15.9 | 16.2 | 16.2 | 15.5 | -0.4 | -2.5 |
|
Manufacturing |
63.5 | 63.2 | 63.2 | 63.3 | -0.2 | -0.3 |
|
Trade, transportation, and utilities |
99.2 | 96.8 | 97.3 | 99.2 | 0.0 | 0.0 |
|
Information |
2.9 | 2.8 | 2.8 | 2.8 | -0.1 | -3.4 |
|
Financial activities |
20.9 | 20.2 | 19.9 | 19.9 | -1.0 | -4.8 |
|
Professional and business services |
70.9 | 68.6 | 68.2 | 67.9 | -3.0 | -4.2 |
|
Education and health services |
49.2 | 49.4 | 49.8 | 50.3 | 1.1 | 2.2 |
|
Leisure and hospitality |
39.9 | 42.2 | 41.5 | 39.2 | -0.7 | -1.8 |
|
Other services |
13.4 | 13.5 | 13.6 | 13.7 | 0.3 | 2.2 |
|
Government |
49.2 | 50.5 | 50.6 | 49.6 | 0.4 | 0.8 |
|
Gary, IN Metropolitan Division |
||||||
|
Total nonfarm |
284.8 | 287.0 | 287.9 | 288.0 | 3.2 | 1.1 |
|
Mining and logging |
0.1 | 0.1 | 0.1 | 0.1 | 0.0 | 0.0 |
|
Construction |
17.6 | 18.0 | 17.9 | 16.9 | -0.7 | -4.0 |
|
Manufacturing |
34.4 | 34.5 | 34.7 | 34.7 | 0.3 | 0.9 |
|
Trade, transportation, and utilities |
62.0 | 60.2 | 60.8 | 62.6 | 0.6 | 1.0 |
|
Information |
1.8 | 1.8 | 1.8 | 1.8 | 0.0 | 0.0 |
|
Financial activities |
9.4 | 9.3 | 9.3 | 9.2 | -0.2 | -2.1 |
|
Professional and business services |
29.2 | 29.7 | 29.8 | 29.4 | 0.2 | 0.7 |
|
Education and health services |
50.2 | 51.0 | 51.3 | 51.6 | 1.4 | 2.8 |
|
Leisure and hospitality |
32.8 | 34.2 | 34.4 | 33.7 | 0.9 | 2.7 |
|
Other services |
14.3 | 14.4 | 14.3 | 14.4 | 0.1 | 0.7 |
|
Government |
33.0 | 33.8 | 33.5 | 33.6 | 0.6 | 1.8 |
| Area | Nov 2023 |
Sep 2024 |
Oct 2024 |
Nov 2024(p) |
Nov 2023 to Nov 2024(p) |
|
|---|---|---|---|---|---|---|
| Net change |
Percent change |
|||||
|
United States(1) |
||||||
|
Total nonfarm |
158,347 | 159,184 | 160,035 | 160,560 | 2,213 | 1.4 |
|
Mining and logging |
642 | 641 | 642 | 642 | 0 | 0.0 |
|
Construction |
8,173 | 8,446 | 8,465 | 8,381 | 208 | 2.5 |
|
Manufacturing |
12,953 | 12,926 | 12,868 | 12,888 | -65 | -0.5 |
|
Trade, transportation, and utilities |
29,407 | 28,948 | 29,152 | 29,584 | 177 | 0.6 |
|
Information |
3,015 | 2,993 | 2,990 | 2,999 | -16 | -0.5 |
|
Financial activities |
9,239 | 9,257 | 9,284 | 9,295 | 56 | 0.6 |
|
Professional and business services |
23,067 | 23,008 | 23,128 | 23,129 | 62 | 0.3 |
|
Education and health services |
26,023 | 26,524 | 26,831 | 26,987 | 964 | 3.7 |
|
Leisure and hospitality |
16,496 | 17,079 | 16,946 | 16,763 | 267 | 1.6 |
|
Other services |
5,866 | 5,910 | 5,922 | 5,929 | 63 | 1.1 |
|
Government |
23,466 | 23,452 | 23,807 | 23,963 | 497 | 2.1 |
|
Atlanta-Sandy Springs-Roswell, GA |
||||||
|
Total nonfarm |
3,099.2 | 3,093.0 | 3,102.5 | 3,112.1 | 12.9 | 0.4 |
|
Mining and logging |
2.0 | 2.1 | 2.1 | 2.1 | 0.1 | 5.0 |
|
Construction |
146.5 | 149.7 | 150.6 | 149.0 | 2.5 | 1.7 |
|
Manufacturing |
183.7 | 180.4 | 179.3 | 179.2 | -4.5 | -2.4 |
|
Trade, transportation, and utilities |
671.4 | 650.1 | 652.9 | 660.8 | -10.6 | -1.6 |
|
Information |
98.5 | 95.0 | 93.4 | 95.8 | -2.7 | -2.7 |
|
Financial activities |
206.8 | 208.3 | 208.4 | 210.3 | 3.5 | 1.7 |
|
Professional and business services |
593.2 | 580.1 | 580.8 | 579.7 | -13.5 | -2.3 |
|
Education and health services |
421.9 | 430.7 | 433.3 | 435.9 | 14.0 | 3.3 |
|
Leisure and hospitality |
314.1 | 325.1 | 327.8 | 324.7 | 10.6 | 3.4 |
|
Other services |
104.8 | 108.1 | 107.6 | 106.3 | 1.5 | 1.4 |
|
Government |
356.3 | 363.4 | 366.3 | 368.3 | 12.0 | 3.4 |
|
Boston-Cambridge-Nashua, MA-NH (NECTA) |
||||||
|
Total nonfarm |
2,829.7 | 2,829.1 | 2,841.4 | 2,844.1 | 14.4 | 0.5 |
|
Mining, logging, and construction |
132.4 | 133.7 | 134.8 | 133.3 | 0.9 | 0.7 |
|
Manufacturing |
183.5 | 179.4 | 179.6 | 179.6 | -3.9 | -2.1 |
|
Trade, transportation, and utilities |
410.6 | 399.5 | 402.5 | 408.6 | -2.0 | -0.5 |
|
Information |
80.0 | 76.2 | 76.2 | 77.0 | -3.0 | -3.8 |
|
Financial activities |
185.3 | 184.3 | 184.8 | 184.8 | -0.5 | -0.3 |
|
Professional and business services |
531.7 | 527.3 | 530.8 | 528.7 | -3.0 | -0.6 |
|
Education and health services |
623.6 | 623.1 | 630.9 | 635.2 | 11.6 | 1.9 |
|
Leisure and hospitality |
257.2 | 278.6 | 272.4 | 265.3 | 8.1 | 3.1 |
|
Other services |
102.8 | 104.5 | 105.5 | 104.5 | 1.7 | 1.7 |
|
Government |
322.6 | 322.5 | 323.9 | 327.1 | 4.5 | 1.4 |
|
Chicago-Naperville-Elgin, IL-IN-WI |
||||||
|
Total nonfarm |
4,825.1 | 4,809.9 | 4,824.1 | 4,817.6 | -7.5 | -0.2 |
|
Mining and logging |
1.6 | 1.6 | 1.7 | 1.6 | 0.0 | 0.0 |
|
Construction |
188.5 | 191.7 | 191.7 | 184.0 | -4.5 | -2.4 |
|
Manufacturing |
418.4 | 420.0 | 419.8 | 418.8 | 0.4 | 0.1 |
|
Trade, transportation, and utilities |
988.8 | 967.5 | 973.0 | 986.2 | -2.6 | -0.3 |
|
Information |
77.0 | 75.3 | 75.6 | 77.2 | 0.2 | 0.3 |
|
Financial activities |
320.6 | 316.6 | 317.8 | 316.7 | -3.9 | -1.2 |
|
Professional and business services |
841.1 | 820.6 | 825.5 | 817.7 | -23.4 | -2.8 |
|
Education and health services |
777.8 | 782.3 | 787.6 | 790.1 | 12.3 | 1.6 |
|
Leisure and hospitality |
467.7 | 475.2 | 471.0 | 462.5 | -5.2 | -1.1 |
|
Other services |
197.5 | 202.5 | 204.2 | 206.8 | 9.3 | 4.7 |
|
Government |
546.1 | 556.6 | 556.2 | 556.0 | 9.9 | 1.8 |
|
Dallas-Fort Worth-Arlington, TX |
||||||
|
Total nonfarm |
4,303.4 | 4,318.2 | 4,353.8 | 4,367.9 | 64.5 | 1.5 |
|
Mining, logging, and construction |
251.8 | 258.9 | 258.0 | 258.6 | 6.8 | 2.7 |
|
Manufacturing |
310.4 | 315.0 | 315.7 | 314.8 | 4.4 | 1.4 |
|
Trade, transportation, and utilities |
923.9 | 908.8 | 920.4 | 932.6 | 8.7 | 0.9 |
|
Information |
91.3 | 91.7 | 91.8 | 93.1 | 1.8 | 2.0 |
|
Financial activities |
368.7 | 378.5 | 382.6 | 383.9 | 15.2 | 4.1 |
|
Professional and business services |
792.1 | 786.8 | 792.9 | 789.1 | -3.0 | -0.4 |
|
Education and health services |
513.7 | 524.0 | 525.6 | 527.4 | 13.7 | 2.7 |
|
Leisure and hospitality |
427.2 | 429.1 | 430.9 | 429.9 | 2.7 | 0.6 |
|
Other services |
137.8 | 143.2 | 142.9 | 142.0 | 4.2 | 3.0 |
|
Government |
486.5 | 482.2 | 493.0 | 496.5 | 10.0 | 2.1 |
|
Houston-The Woodlands-Sugar Land, TX |
||||||
|
Total nonfarm |
3,434.0 | 3,461.9 | 3,476.2 | 3,496.5 | 62.5 | 1.8 |
|
Mining and logging |
71.3 | 72.3 | 72.6 | 72.5 | 1.2 | 1.7 |
|
Construction |
233.3 | 249.3 | 249.2 | 249.4 | 16.1 | 6.9 |
|
Manufacturing |
235.8 | 239.4 | 238.9 | 238.8 | 3.0 | 1.3 |
|
Trade, transportation, and utilities |
703.3 | 692.2 | 698.8 | 710.3 | 7.0 | 1.0 |
|
Information |
33.2 | 32.3 | 32.5 | 32.9 | -0.3 | -0.9 |
|
Financial activities |
186.9 | 192.1 | 193.2 | 194.7 | 7.8 | 4.2 |
|
Professional and business services |
567.8 | 563.8 | 564.6 | 566.7 | -1.1 | -0.2 |
|
Education and health services |
460.7 | 470.8 | 470.6 | 473.3 | 12.6 | 2.7 |
|
Leisure and hospitality |
356.5 | 362.3 | 363.9 | 362.9 | 6.4 | 1.8 |
|
Other services |
127.3 | 133.5 | 132.2 | 131.7 | 4.4 | 3.5 |
|
Government |
457.9 | 453.9 | 459.7 | 463.3 | 5.4 | 1.2 |
|
Los Angeles-Long Beach-Anaheim, CA |
||||||
|
Total nonfarm |
6,304.4 | 6,285.0 | 6,346.1 | 6,365.2 | 60.8 | 1.0 |
|
Mining and logging |
1.9 | 1.9 | 1.9 | 1.9 | 0.0 | 0.0 |
|
Construction |
260.0 | 258.3 | 260.5 | 255.0 | -5.0 | -1.9 |
|
Manufacturing |
475.0 | 466.3 | 463.6 | 462.0 | -13.0 | -2.7 |
|
Trade, transportation, and utilities |
1,112.3 | 1,095.0 | 1,107.0 | 1,125.6 | 13.3 | 1.2 |
|
Information |
206.2 | 202.5 | 203.2 | 206.6 | 0.4 | 0.2 |
|
Financial activities |
316.2 | 315.9 | 319.7 | 318.3 | 2.1 | 0.7 |
|
Professional and business services |
971.2 | 963.3 | 972.0 | 974.3 | 3.1 | 0.3 |
|
Education and health services |
1,210.5 | 1,237.2 | 1,255.9 | 1,265.0 | 54.5 | 4.5 |
|
Leisure and hospitality |
773.1 | 780.8 | 782.9 | 775.2 | 2.1 | 0.3 |
|
Other services |
217.0 | 218.0 | 217.8 | 218.1 | 1.1 | 0.5 |
|
Government |
761.0 | 745.8 | 761.6 | 763.2 | 2.2 | 0.3 |
|
Miami-Fort Lauderdale-West Palm Beach, FL |
||||||
|
Total nonfarm |
2,960.7 | 2,965.5 | 2,977.9 | 3,009.9 | 49.2 | 1.7 |
|
Construction |
157.8 | 168.1 | 166.5 | 168.0 | 10.2 | 6.5 |
|
Manufacturing |
100.4 | 97.1 | 96.4 | 96.6 | -3.8 | -3.8 |
|
Trade, transportation, and utilities |
672.0 | 655.6 | 661.4 | 677.5 | 5.5 | 0.8 |
|
Information |
55.2 | 54.6 | 54.3 | 54.8 | -0.4 | -0.7 |
|
Financial activities |
219.2 | 216.0 | 216.3 | 217.2 | -2.0 | -0.9 |
|
Professional and business services |
521.9 | 522.7 | 524.4 | 524.2 | 2.3 | 0.4 |
|
Education and health services |
459.6 | 463.5 | 469.0 | 471.7 | 12.1 | 2.6 |
|
Leisure and hospitality |
339.6 | 342.0 | 341.8 | 349.7 | 10.1 | 3.0 |
|
Other services |
116.2 | 120.0 | 120.9 | 121.9 | 5.7 | 4.9 |
|
Government |
317.9 | 325.0 | 326.0 | 327.4 | 9.5 | 3.0 |
|
New York-Newark-Jersey City, NY-NJ-PA |
||||||
|
Total nonfarm |
10,199.8 | 10,220.8 | 10,291.6 | 10,339.0 | 139.2 | 1.4 |
|
Mining, logging, and construction |
402.0 | 404.5 | 402.1 | 400.2 | -1.8 | -0.4 |
|
Manufacturing |
349.0 | 348.4 | 348.4 | 348.1 | -0.9 | -0.3 |
|
Trade, transportation, and utilities |
1,704.8 | 1,671.4 | 1,686.8 | 1,708.4 | 3.6 | 0.2 |
|
Information |
307.0 | 293.7 | 295.9 | 291.5 | -15.5 | -5.0 |
|
Financial activities |
828.5 | 824.4 | 823.4 | 824.5 | -4.0 | -0.5 |
|
Professional and business services |
1,673.9 | 1,640.1 | 1,647.1 | 1,655.1 | -18.8 | -1.1 |
|
Education and health services |
2,278.0 | 2,345.4 | 2,386.0 | 2,413.6 | 135.6 | 6.0 |
|
Leisure and hospitality |
920.4 | 965.4 | 953.2 | 936.7 | 16.3 | 1.8 |
|
Other services |
412.9 | 411.1 | 415.4 | 419.1 | 6.2 | 1.5 |
|
Government |
1,323.3 | 1,316.4 | 1,333.3 | 1,341.8 | 18.5 | 1.4 |
|
Philadelphia-Camden-Wilmington, PA-NJ-DE-MD |
||||||
|
Total nonfarm |
3,123.3 | 3,131.8 | 3,147.3 | 3,160.7 | 37.4 | 1.2 |
|
Mining, logging, and construction |
124.5 | 129.6 | 130.4 | 128.7 | 4.2 | 3.4 |
|
Manufacturing |
182.3 | 179.8 | 179.2 | 179.7 | -2.6 | -1.4 |
|
Trade, transportation, and utilities |
557.9 | 538.3 | 544.3 | 557.1 | -0.8 | -0.1 |
|
Information |
53.6 | 52.5 | 52.4 | 52.0 | -1.6 | -3.0 |
|
Financial activities |
229.1 | 231.0 | 230.3 | 230.3 | 1.2 | 0.5 |
|
Professional and business services |
501.9 | 500.4 | 501.4 | 500.2 | -1.7 | -0.3 |
|
Education and health services |
729.1 | 743.1 | 752.2 | 758.4 | 29.3 | 4.0 |
|
Leisure and hospitality |
271.7 | 285.6 | 280.3 | 275.2 | 3.5 | 1.3 |
|
Other services |
124.6 | 123.9 | 124.9 | 125.0 | 0.4 | 0.3 |
|
Government |
348.6 | 347.6 | 351.9 | 354.1 | 5.5 | 1.6 |
|
Phoenix-Mesa-Scottsdale, AZ |
||||||
|
Total nonfarm |
2,464.5 | 2,459.7 | 2,480.9 | 2,507.4 | 42.9 | 1.7 |
|
Mining and logging |
3.7 | 3.9 | 4.0 | 4.0 | 0.3 | 8.1 |
|
Construction |
175.9 | 172.0 | 172.2 | 172.2 | -3.7 | -2.1 |
|
Manufacturing |
149.8 | 145.7 | 145.4 | 147.8 | -2.0 | -1.3 |
|
Trade, transportation, and utilities |
486.2 | 476.7 | 482.6 | 497.8 | 11.6 | 2.4 |
|
Information |
42.1 | 40.6 | 40.8 | 41.3 | -0.8 | -1.9 |
|
Financial activities |
212.2 | 212.9 | 215.3 | 215.4 | 3.2 | 1.5 |
|
Professional and business services |
395.3 | 395.6 | 396.2 | 398.1 | 2.8 | 0.7 |
|
Education and health services |
409.0 | 424.7 | 430.4 | 434.5 | 25.5 | 6.2 |
|
Leisure and hospitality |
252.6 | 244.8 | 249.5 | 250.6 | -2.0 | -0.8 |
|
Other services |
77.1 | 77.7 | 78.6 | 78.1 | 1.0 | 1.3 |
|
Government |
260.6 | 265.1 | 265.9 | 267.6 | 7.0 | 2.7 |
|
San Francisco-Oakland-Hayward, CA |
||||||
|
Total nonfarm |
2,482.8 | 2,469.2 | 2,487.3 | 2,494.3 | 11.5 | 0.5 |
|
Mining and logging |
0.4 | 0.4 | 0.4 | 0.4 | 0.0 | 0.0 |
|
Construction |
125.5 | 124.4 | 124.4 | 122.8 | -2.7 | -2.2 |
|
Manufacturing |
149.8 | 146.7 | 146.0 | 145.7 | -4.1 | -2.7 |
|
Trade, transportation, and utilities |
355.1 | 350.4 | 354.0 | 361.4 | 6.3 | 1.8 |
|
Information |
139.2 | 130.8 | 130.8 | 130.3 | -8.9 | -6.4 |
|
Financial activities |
137.5 | 135.7 | 137.8 | 137.2 | -0.3 | -0.2 |
|
Professional and business services |
505.1 | 498.3 | 502.8 | 503.9 | -1.2 | -0.2 |
|
Education and health services |
405.2 | 411.0 | 416.6 | 418.3 | 13.1 | 3.2 |
|
Leisure and hospitality |
253.8 | 259.8 | 257.8 | 256.3 | 2.5 | 1.0 |
|
Other services |
86.5 | 89.3 | 89.1 | 87.5 | 1.0 | 1.2 |
|
Government |
324.7 | 322.4 | 327.6 | 330.5 | 5.8 | 1.8 |
|
Washington-Arlington-Alexandria, DC-VA-MD-WV |
||||||
|
Total nonfarm |
3,396.9 | 3,396.8 | 3,415.0 | 3,433.5 | 36.6 | 1.1 |
|
Mining, logging, and construction |
163.6 | 167.0 | 168.3 | 169.5 | 5.9 | 3.6 |
|
Manufacturing |
57.8 | 59.8 | 59.9 | 60.5 | 2.7 | 4.7 |
|
Trade, transportation, and utilities |
417.2 | 403.9 | 409.0 | 420.0 | 2.8 | 0.7 |
|
Information |
79.6 | 79.1 | 78.7 | 78.4 | -1.2 | -1.5 |
|
Financial activities |
153.1 | 149.6 | 151.1 | 151.6 | -1.5 | -1.0 |
|
Professional and business services |
809.3 | 813.4 | 821.0 | 820.9 | 11.6 | 1.4 |
|
Education and health services |
464.8 | 467.7 | 472.7 | 476.1 | 11.3 | 2.4 |
|
Leisure and hospitality |
321.1 | 328.5 | 319.5 | 314.5 | -6.6 | -2.1 |
|
Other services |
195.3 | 200.1 | 199.6 | 202.3 | 7.0 | 3.6 |
|
Government |
735.1 | 727.7 | 735.2 | 739.7 | 4.6 | 0.6 |
|
Footnotes |
||||||
Last Modified Date: Friday, January 03, 2025