
An official website of the United States government
An official website of the United States government
The .gov means it's official.
Federal government websites often end in .gov or .mil. Before sharing sensitive information,
make sure you're on a federal government site.
The site is secure.
The
https:// ensures that you are connecting to the official website and that any
information you provide is encrypted and transmitted securely.

Crossref 0
Career Preparation and Choices of Fundamental Christian School Students, Journal of Research on Christian Education, 2019.
Using data from the Job Openings and Labor Turnover Survey, this article takes a unique, simultaneous look at job openings, hires, and separations for individual industries and then categorizes industries as having high or low job openings and high or low hires. Studying the data items in relation to each other helps point out the differences among industries: some have high turnover, some have low turnover, some easily find the workers they need and hence have few job openings at the end of the month, and some need more workers than they can find. The author also includes fill rates and churn rates by industry and looks briefly at earnings by industry. The analysis of labor turnover patterns by industry may prove useful to jobseekers and career changers as well as employers.
Where should new graduates look for jobs? What about career changers? In what direction should career counselors and job placement programs direct clients? Which statistics can government officials use to help determine how to stimulate job growth? How do employers know if their turnover and worker demands are typical? Industries differ in employee turnover patterns, demand for workers, and ability to hire the workers they need. Understanding the labor turnover characteristics of the different industries may help jobseekers, those assisting them, employers, and government officials better focus their efforts.
Each data element in the Job Openings and Labor Turnover Survey (JOLTS)—job openings, hires, and separations—provides information about the labor market. However, when all three data elements are studied together, an even more informative picture emerges. The job openings data tell us about the unmet demand for workers; the hires and separations data provide information about the flow of labor. Industries with high turnover and low job openings, such as construction, are easily able to hire the workers they need. But industries with high turnover and high job openings, such as professional and business services, still have open jobs at the end of the month despite their hiring efforts during the month. Those industries with consistently moderate turnover and high unmet demand for labor, such as health care, may be a good option for career changers and students selecting a major, and officials who develop training programs and guide people into them can benefit from knowing which industries these are. Hence, analyzing the demand for and flow of workers by industry could prove helpful both to people looking for work and to those trying to help or hire them.
| Industry | Job openings rate | Hires rate |
|---|---|---|
| Total nonfarm | 3.2 | 3.5 |
| Total private | 3.4 | 3.9 |
| Mining and logging | 3.1 | 3.8 |
| Construction | 2.0 | 5.1 |
| Durable goods manufacturing | 2.3 | 2.0 |
| Nondurable goods manufacturing | 2.4 | 2.4 |
| Wholesale trade | 2.6 | 2.5 |
| Retail trade | 3.1 | 4.8 |
| Transportation, warehousing, and utilities | 3.1 | 3.5 |
| Information | 3.6 | 2.8 |
| Finance and insurance | 3.7 | 2.2 |
| Real estate and rental and leasing | 2.9 | 3.2 |
| Professional and business services | 4.4 | 5.3 |
| Educational services | 2.3 | 2.5 |
| Health care and social assistance | 3.9 | 2.7 |
| Arts, entertainment, and recreation | 3.2 | 6.7 |
| Accommodation and food services | 4.5 | 5.8 |
| Other services | 2.6 | 3.4 |
| Federal government | 2.2 | 1.2 |
| State and local government | 2.0 | 1.4 |
| Source: U.S. Bureau of Labor Statistics. | ||
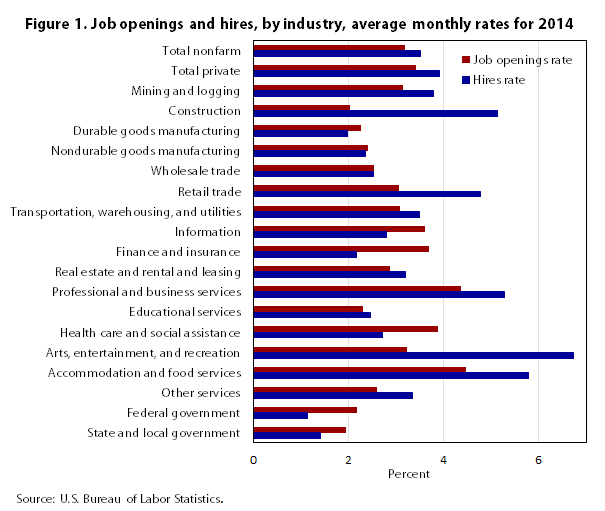
Studying job openings relative to hires reveals substantial differences among the industries. In some cases, hires (measured over the course of a month) are much greater than openings (on the last day of the month); in other cases, the gap between them is small.1 For a few select industries, openings exceed hires. Comparing industries by analyzing the number of openings or hires yields little information because industries vary greatly by size. Converting the number of hires and openings to rates—by dividing the number of hires or openings by the number of people employed in the industry—allows for meaningful cross-industry comparison. Figure 1 presents the hires and job openings rates by industry. For the United States (total nonfarm industries), the job openings rate averaged about 91 percent of the hires rate in 2014. In several industries, the hires rate far exceeded the average job openings rate: construction; arts, entertainment, and recreation; and retail trade. In several industries—for instance, mining and logging, professional and business services, and accommodation and food services—the hires rate exceeded the job openings rate to a lesser degree. The exceptional industries in which the job openings rate exceeded the hires rate were information; finance and insurance; health care and social assistance; federal government; and state and local government.
This first glance at the industries raises many questions. Why is there a large difference between the hires rate and job openings rate for some industries but not for others? What does a gap of any size mean, and is a gap good, bad, or neutral for the labor market and economy? Why do so few industries have a higher job openings rate than hires rate? Will a person looking for a job or looking to change fields have better success targeting an industry with high openings or with high hires or where openings exceed hires? Some of these questions can be answered rather easily, but others require further analysis. Before we can answer any questions, some definitions and background are needed.
The Bureau of Labor Statistics (BLS) has published JOLTS estimates for job openings, hires, quits, layoffs and discharges, other separations, and total separations by industry and region for each month from December 2000 forward.
For JOLTS to consider a job “open,” three requirements must be met: a particular job must exist, work can start within 30 days whether or not a suitable candidate is found, and the job must be actively advertised outside the establishment. The requirements reflect the survey’s goal of measuring current job demand in which a person seeking a job from outside the establishment has an opportunity to be hired. Job openings are a stock measure, with the count taken on the last business day of the month. Therefore, the job openings measurement represents positions that hires did not fill during the month.
The hires data are designed to capture all employer–employee relationships established during the month. A hire occurs each time an employer brings on any worker, including part-time, full-time, and seasonal. Also included are rehires of people who had previously worked for the same establishment. The hires count is a flow measure that sums all hires that occurred during the month.
Separations data are similar to those of hires in that separations include all instances in which an employer–employee relationship ended during the month. JOLTS breaks out separations into voluntary quits, involuntary layoffs and discharges, and other separations (retirements, transfers, and separations due to death or disability).
For hires and separations, we convert the levels (counts) to rates by dividing the level by the employment and multiplying by 100.2 Therefore, the rates show hires or separations during the month as a percentage of employment. The job openings rate is calculated slightly differently, with the job openings level divided by the sum of job openings and employment, times 100. The job openings rate indicates what percentage of all potential jobs—filled or unfilled—remained unfilled at the end of the month.
The above definitions and reference periods already answer one question: Why is it unusual for job openings to exceed hires? Given that the job openings level is a count of jobs left unfilled on the last day of the month, yet hires is a cumulative count of all employees hired throughout the month, openings outnumbering hires is noteworthy. Until 2014, only two industries had a higher job openings rate than hires rate; in 2014, however, 10 of the 18 industries had a higher job openings rate than average hires rate.
This paper focuses on the year 2014, the most recent full year for which data are available. Because JOLTS does not seasonally adjust the data for every industry, this article uses not seasonally adjusted data and calculates monthly averages for each year by industry. For the remainder of this article, “rate” will be used as a succinct way to refer to the average monthly rate for the year 2014 unless otherwise noted.

| Industry | Job openings rate | Hires rate | Employment (in thousands) |
|---|---|---|---|
| Total nonfarm | 3.2 | 3.5 | 139,042 |
| Total private | 3.4 | 3.9 | 117,180 |
| Mining and logging | 3.1 | 3.8 | 896 |
| Construction | 2.0 | 5.1 | 6,138 |
| Durable goods manufacturing | 2.3 | 2.0 | 7,685 |
| Nondurable goods manufacturing | 2.4 | 2.4 | 4,503 |
| Wholesale trade | 2.6 | 2.5 | 5,826 |
| Retail trade | 3.1 | 4.8 | 15,364 |
| Transportation, warehousing, and utilities | 3.1 | 3.5 | 5,193 |
| Information | 3.6 | 2.8 | 2,740 |
| Finance and insurance | 3.7 | 2.2 | 5,933 |
| Real estate and rental and leasing | 2.9 | 3.2 | 2,046 |
| Professional and business services | 4.4 | 5.3 | 19,096 |
| Educational services | 2.3 | 2.5 | 3,417 |
| Health care and social assistance | 3.9 | 2.7 | 18,057 |
| Arts, entertainment, and recreation | 3.2 | 6.7 | 1,967 |
| Accommodation and food services | 4.5 | 5.8 | 12,629 |
| Other services | 2.6 | 3.4 | 5,573 |
| Federal government | 2.2 | 1.2 | 2,729 |
| State and local government | 2.0 | 1.4 | 19,134 |
| Source: U.S. Bureau of Labor Statistics. | |||
For the United States (total nonfarm industries), the average hires rate for 2014 was 3.5 percent and the average job openings rate was 3.2 percent. The individual industries vary widely around these averages. Those industries which differ most noticeably can be grouped into four categories: (1) high hires and high job openings, (2) low hires and high job openings, (3) high hires and low job openings, and (4) low hires and low job openings. Figure 2 graphically represents the hires rate and job openings rate by industry along with the employment level of each industry. The hires rate is along the horizontal axis, the job openings rate is along the vertical axis, and the size of each industry bubble reflects the level of industry employment.
High hires and high job openings. Industries with a high hires rate and a high job openings rate in 2014 were professional and business services (5.3, 4.4)3 and accommodation and food services (5.8, 4.5). The simultaneous high rates indicate that, in spite of strong hiring, even more employees are needed.
The professional and business services sector comprises services such as legal, accounting, architecture, engineering, computer, and temporary help agencies. The professional and business services industry is considered by economists to act as an early warning sign of an upcoming recession or as an early indicator of recovery.4 At the beginning of a recovery, when employers need more workers but are not ready to commit to hiring new staff, they may hire temporary workers.5 Employment services—which includes temporary help firms—was about 18 percent of professional and business services employment in 2014. Average monthly employment in 2014 in employment services was 38 percent higher than in 2009, which is when the recession ended. With employment of over 19 million and a high job openings rate, the professional and business services industry provides vast opportunities for jobseekers.
The accommodation and food services industry has a high turnover of workers and is affected by changes in both the season and the business cycle. The high hires reflect replacement hiring due to the high turnover, as well as seasonal hiring, and also expansion with the improving economy. The high job openings in accommodation and food services indicate an industry that is experiencing modest growth, with employment rising by just over 3 percent from 2013 to 2014.
Low hires and high job openings. These industries need workers but are not hiring them for one reason or another: information (2.8, 3.6), finance and insurance (2.2, 3.7), and health care and social assistance (2.7, 3.9). These industries may not be able to find qualified workers or they might not be offering a wage high enough to attract new employees. These industries may be of interest to jobseekers with the right skills and to job training programs preparing people for available jobs.
The reasons companies in the information industry and the finance and insurance industry need workers are not immediately obvious. The information industry includes broadcasting (radio and television), motion pictures and video, publishing (magazines, books, and newspapers), software publishing, and telecommunications. The JOLTS sample size does not allow for a finer level of industry detail to see which sections of the information industry have unmet demand. However, according to the BLS Occupational Outlook Handbook,6 many computer-related occupations are projected to grow faster than average. Particularly in the information industry, employment in computer occupations is projected to rise in software publishers and other information services. Finance and insurance includes banking (including mortgage processing), financial investment, insurance, and trusts and funds (pensions, trusts, and estates). As baby boomers age, they will need these services even more, and boomers employed in these careers will need to be replaced as they retire.7 Looking again at the Occupational Outlook Handbook, we find that the numbers of financial analysts and personal financial advisors are projected to grow faster than average and much faster than average, respectively, in 2012–22.
The health care industry had an especially high demand for workers, with employment of over 18 million and an average monthly job openings rate of 3.9 percent in 2014. The Bureau of Labor Statistics projects 5.0 million new jobs in health care between 2012 and 2022. The compound annual rate of change, 2.6 percent, is tied only with that of construction for highest of all industries. (See table 1.) Health care workers will be needed because of the aging of the population: the number of people needing health care will increase, as will the number of workers needed to replace retiring workers. Many of these jobs provide good pay, job security, and also job portability. The BLS Employment Projections program estimates that over 296,000 physicians and surgeons and over 1 million registered nurses will be needed in the 2012–22 timespan to fill jobs because of occupational growth and replacement hiring. Many organizations, including the federal government, are offering college scholarships and grants in order to recruit people into the field of nursing. Many jobs in the health care industry require a doctoral or professional degree, such as pharmacists and surgeons. Because these occupations require many years of education, even if more people begin training, the supply may lag the demand. However, not all upcoming jobs related to health care require a 4-year college degree or professional degree. Dental hygienist and nuclear medicine technologist jobs typically require only an associate’s degree for entry. Phlebotomist and dental assistant positions typically require only some postsecondary study or on-the-job training for entry. Personal care aides and home health aides do not even need a high school diploma for entry, yet 1.3 million new jobs and jobs due to replacement are predicted for aides in the 2012–22 timeframe. Students selecting a field or career changers looking for retraining would find plentiful opportunities in health care.
| Industry | Job openings rate | Fill rate = hires/job openings | Hires rate | Separations rate | Churn rate = hires rate + separations rate | Projected annual rate of employment change 2012–22 |
|---|---|---|---|---|---|---|
| Total nonfarm | 3.2 | 1.1 | 3.5 | 3.3 | 6.9 | 1.1 |
| Total private | 3.4 | 1.1 | 3.9 | 3.7 | 7.6 | 1.2 |
| Mining and logging | 3.1 | 1.2 | 3.8 | 3.4 | 7.2 | 1.2 |
| Construction | 2.0 | 2.5 | 5.1 | 4.8 | 9.9 | 2.6 |
| Durable goods manufacturing | 2.3 | 0.9 | 2.0 | 1.8 | 3.8 | -0.3 |
| Nondurable goods manufacturing | 2.4 | 1.0 | 2.4 | 2.3 | 4.7 | -0.8 |
| Wholesale trade | 2.6 | 1.0 | 2.5 | 2.4 | 4.9 | 0.8 |
| Retail trade | 3.1 | 1.5 | 4.8 | 4.6 | 9.4 | 0.7 |
| Transportation, warehousing, and utilities | 3.1 | 1.1 | 3.5 | 3.2 | 6.7 | 0.5 |
| Information | 3.6 | 0.8 | 2.8 | 2.7 | 5.5 | -0.2 |
| Finance and insurance | 3.7 | 0.6 | 2.2 | 2.1 | 4.2 | 0.8 |
| Real estate and rental and leasing | 2.9 | 1.1 | 3.2 | 3.0 | 6.2 | 1.2 |
| Professional and business services | 4.4 | 1.2 | 5.3 | 5.0 | 10.3 | 1.8 |
| Educational services | 2.3 | 1.0 | 2.5 | 2.3 | 4.7 | 1.9 |
| Health care and social assistance | 3.9 | 0.7 | 2.7 | 2.5 | 5.3 | 2.6 |
| Arts, entertainment, and recreation | 3.2 | 2.0 | 6.7 | 6.5 | 13.2 | 1.1 |
| Accommodation and food services | 4.5 | 1.2 | 5.8 | 5.5 | 11.3 | 0.9 |
| Other services | 2.6 | 1.3 | 3.4 | 3.2 | 6.6 | 1.0 |
| Federal government | 2.2 | 0.5 | 1.2 | 1.2 | 2.3 | -1.6 |
| State and local government | 2.0 | 0.7 | 1.4 | 1.4 | 2.8 | 0.5 |
| Source: U.S. Bureau of Labor Statistics. | ||||||
High hires and low job openings. Two different scenarios describe industries with a high hires rate and low job openings rate: an industry could have a lot of turnover (separations with replacement hires) and an easy time finding new employees to fill open jobs so that few jobs are left open by the end of the month, or an industry could be expanding but is able to find the needed workers to fill the open jobs by the end of the month. These expanding industries could have any rate of turnover, from low to high. Three industries are of the high-hires-and-low-job-openings nature: construction (5.1, 2.0), retail trade (4.8, 3.1), and arts, entertainment, and recreation (6.7, 3.2).
Construction is the one industry in which hires are always high and job openings are always low. Turnover is high because workers can move from site to site and employer to employer. For example, construction workers who are trained in framing a house or operating construction equipment can apply that skill either at new worksites their employer moves them to or at worksites for different construction companies as they change employers. Unfilled openings are low because of employers’ ability to quickly find the workers they need. As already mentioned, construction has a 2.6 percent compound annual rate of change for 2012–22. According to BLS projections, the most rapid growth occupations in construction are mechanical insulation workers; helpers of brickmasons, blockmasons, stonemasons, and tile and marble setters; and segmental pavers. The construction industry has a wide variety of occupations. Even though construction is an average-sized industry, employing 6.1 million people on average in 2014, construction may provide jobs for many jobseekers given its predicted high rate of growth in the near future.
Two other industries with high hires and relatively low job openings are retail trade (4.8, 3.1) and arts, entertainment, and recreation (6.7, 3.2). Because retail experience can be applied at any number of retail establishments that are hiring, high separations in retail trade are quickly followed by high hires; the result is a low number of open jobs at the end of the month. Jobseekers tend to have success finding a job in retail because retail trade is a very large industry—with an employment level exceeding 15 million people on average in 2014—and high turnover generates a large amount of replacement hiring. Arts, entertainment, and recreation has the highest hires rate among all industries because of the high turnover and resulting replacement hiring. Also, the high hires cause arts, entertainment, and recreation to have the largest difference between the hires rate and job openings rate of any industry.
Low hires and low job openings. A number of industries fell into the category of low hires and low job openings in 2014. Very little labor market activity occurred in the following industries: durable goods manufacturing, nondurable goods manufacturing, wholesale trade, educational services, federal government, and state and local government. Although these industries employed over 37 million workers per month in 2014, very little hiring occurred and open jobs were scarce. Although workers with particular skills may find employment within these industries, workers seeking employment or career changes would likely not target these industries on the basis of the 2014 data.
In the federal government and state and local government, the situation is slightly different from the private sector because their job openings rates were higher than their hires rates. Even though the openings rate is low for the public sector, the fact that openings outnumber hires indicates a need for workers.
In public education (which is a subset of state and local government), the larger number of job openings than hires at first appears to support the claim that teachers are in demand. However, with the recession and slow recovery, this very large industry posted few openings relative to its average 10 million employees in 2014. The lack of posted openings reasonably can be attributed to declining tax revenue at the national, state, and local levels, resulting in budget cuts affecting school budgets in many states. According to a 2010 survey by the American Association of School Administrators, 77 percent of school districts experienced a cut in state and local funds between the 2009–10 and 2010–11 school years.8 A lack of adequately trained teachers may help explain why some jobs go unfilled at the end of the month. However, budget cuts and lack of trained teachers may not be the full story. The National Center for Education Statistics estimated 3,377,900 teachers were in public elementary and secondary schools in the United States in the 2011–12 school year, the most recent year for which statistics are available. Of those 3.4 million teachers, 8 percent left the profession the following year. Of those teachers who left the field, only 38 percent retired. That means 62 percent left the teaching field to find other work or exited the labor force for reasons other than retirement. These numbers indicate the demand for teachers, albeit relatively low, is due primarily to a high rate of departure from the occupation, although positions vacated by retiring baby boomers also contribute to the openings.9
The educational services industry includes private schools of all levels as well as tutoring establishments. As with state and local education, teacher turnover and rising student populations create the need for teachers and tutors. However, private schools depend on the limited number of families that can afford often costly tuition payments, and tutors can be too costly for families struggling to pay a mortgage. The low turnover likely indicates that employees are staying put because tight private-school budgets translate into few postings of openings for potential job changes.10
The appearance of the federal government in this category of low hires and low openings but with openings outnumbering hires reflects that qualified applicants are difficult to find for some positions. The government jobs website www.USAJobs.gov, which posts all federal jobs, lists the following as what it calls “highly targeted careers:” medical officers, attorneys, administrative law judges, senior executives, and federal cybersecurity careers. This varied list reflects both the need for health care workers in the federal government as we saw in the private sector and the need for senior executives because of a retiring workforce.
Both durable goods manufacturing and nondurable goods manufacturing appear in this low-hires-and-low-job-openings category. This could be due to a long-term trend of decreased U.S. manufacturing employment and suppressed production during and following the Great Recession; together, these factors result in fewer jobs being posted and fewer job-changing opportunities.
Average hires and average job openings. The remainder of the industries fell around the averages for hires, job openings, or both: mining and logging; transportation, warehousing, and utilities; real estate and rental and leasing; and other services. In these industries, the hires and the vacancies were not especially high or low compared with the other industries. Almost all the industries with an average rate of job openings or hires had fewer job openings than hires, indicating employers in these industries were able to find the workers they need. One industry—wholesale trade—had an openings rate slightly higher than the hires rate but only by one-tenth of a percentage point.

Figure 3 summarizes in which of the hires-and-job-openings quadrants industries fell. Not shown are the industries that were average in hires and openings.
Other measures allow us to further explore the industries—the fill rate, the churn rate, and employment projections data. The fill rate and churn rate are created from the JOLTS data, and we have already touched upon employment projections data earlier in this article.
Fill rate. The fill rate is the hires level divided by the job openings level and then multiplied by 100. The rate is a measurement of how much hiring is occurring relative to how many openings remain at the end of the month. The interpretation is slightly complicated by the fact that hires is a flow measure, capturing all hires during the month, and job openings is a stock measure, capturing only jobs remaining open at the end of the month. The fill rate is still useful, however, because it provides another way to visualize the differences among the industries.

| Industry | Fill rate |
|---|---|
| Federal government | 0.5 |
| Finance and insurance | 0.6 |
| Health care and social assistance | 0.7 |
| State and local government | 0.7 |
| Information | 0.8 |
| Durable goods manufacturing | 0.9 |
| Wholesale trade | 1.0 |
| Nondurable goods manufacturing | 1.0 |
| Educational services | 1.0 |
| Total nonfarm | 1.1 |
| Real estate and rental and leasing | 1.1 |
| Transportation, warehousing, and utilities | 1.1 |
| Professional and business services | 1.2 |
| Mining and logging | 1.2 |
| Accommodation and food services | 1.2 |
| Other services | 1.3 |
| Retail trade | 1.5 |
| Arts, entertainment, and recreation | 2.0 |
| Construction | 2.5 |
| Note: The fill rate is the ratio of hires to job openings. Source: U.S. Bureau of Labor Statistics. | |
Figure 4 shows the average monthly fill rate in 2014 was 1.1 percent for total nonfarm industries, indicating just slightly more hires during the month than unfilled jobs remaining at the end of the month. The fill rate for the industries ranged from 0.5 percent for the federal government to 2.5 percent for construction in 2014.
Recalling the full-month reference period for hires versus the 1-day reference period for job openings, we find industries with a fill rate less than 1.0 noteworthy because they have more job openings than hires. In 2014, 6 industries had a fill rate less than 1.0, 3 had a fill rate of exactly 1.0, and 10 (including total nonfarm industries) had a fill rate greater than 1.0. Note that a fill rate close to 1.0 indicates the hires and job openings levels are close together but does not indicate if the individual rates are high or low. The fill rate can be close to 1.0 when both hires and openings are high or when both are low. A fill rate of less than 1.0 (more job openings than hires) is historically unusual; the unfilled jobs indicate a labor market with excess demand for workers. A later section of this article looks at the labor demand and turnover patterns of the industries across the years.
The high-demand industries are toward the bottom of the figure and have the lower fill rates; jobseekers may best focus their efforts on these industries. The industries with the lowest fill rates are those which had both low hires and high job openings or low hires and low job openings, as shown in figure 3.
Toward the top of figure 4, industries with the highest fill rates are construction; arts, entertainment, and recreation; and retail trade, which had high hires and low openings. These industries are still a good source of jobs because of the vast number of hires taking place. Table 1 provides data on job openings, hires, and fill rates by industry and also includes churn rates, which are discussed next.
Churn rate. One thing missing from this analysis so far is separations. Without separations, we do not know if the hires are for expansion of an industry or for replacement hiring following separations within the industry. To fully understand industries’ labor turnover, we need to consider separations as well as hires. When hires exceed separations, the industry is expanding. When hires and separations are at about the same level, industry employment is steady and we can deduce that the hires are mainly replacement hires. When hires are below separations, the industry is contracting.
The “churn rate” is defined in this article as the sum of the hires rate and the separations rate. Therefore, a high churn rate indicates an industry with high hires or high separations or both. A low churn rate indicates an industry with little turnover—that is, with low hires and low separations. As we did with the other data series in this article, we calculated the churn rate using the average monthly hires rate and average monthly separations rate for each industry. Figure 5 provides the average churn rate and average job openings rate by industry for 2014.

| Industry | Churn rate | Hires rate | Separation rate | Job openings rate |
|---|---|---|---|---|
| Total nonfarm | 6.9 | 3.5 | 3.3 | 3.2 |
| Total private | 7.6 | 3.9 | 3.7 | 3.4 |
| Mining and logging | 7.2 | 3.8 | 3.4 | 3.1 |
| Construction | 9.9 | 5.1 | 4.8 | 2.0 |
| Durable goods manufacturing | 3.8 | 2.0 | 1.8 | 2.3 |
| Nondurable goods manufacturing | 4.7 | 2.4 | 2.3 | 2.4 |
| Wholesale trade | 4.9 | 2.5 | 2.4 | 2.6 |
| Retail trade | 9.4 | 4.8 | 4.6 | 3.1 |
| Transportation, warehousing, and utilities | 6.7 | 3.5 | 3.2 | 3.1 |
| Information | 5.5 | 2.8 | 2.7 | 3.6 |
| Finance and insurance | 4.2 | 2.2 | 2.1 | 3.7 |
| Real estate and rental and leasing | 6.2 | 3.2 | 3.0 | 2.9 |
| Professional and business services | 10.3 | 5.3 | 5.0 | 4.4 |
| Educational services | 4.7 | 2.5 | 2.3 | 2.3 |
| Health care and social assistance | 5.3 | 2.7 | 2.5 | 3.9 |
| Arts, entertainment and recreation | 13.2 | 6.7 | 6.5 | 3.2 |
| Accommodation and food services | 11.3 | 5.8 | 5.5 | 4.5 |
| Other services | 6.6 | 3.4 | 3.2 | 2.6 |
| Federal government | 2.3 | 1.2 | 1.2 | 2.2 |
| State and local government | 2.8 | 1.4 | 1.4 | 2.0 |
| Note: The churn rate is the sum of the hires rate and separations rate. Source: U.S. Bureau of Labor Statistics. | ||||
Figure 5 shows that the industries with the highest churn rates are arts, entertainment, and recreation; accommodation and food services; professional and business services; construction; and retail trade. These are high-turnover industries. Not surprisingly, the industries with the lowest churn rates are the federal government and state and local government. Not many people separate from government jobs and not many people are hired into government jobs. In 2014, almost all of the industries had fairly equal hires and separations rates with hires slightly exceeding separations, indicating employers generally were comfortable with replacement hiring plus a little more. None of the industries grew or shrank notably, but the mining and logging industry and the construction industry had the largest gap between average hires and separations rates for 2014, with a 0.4-percentage-point difference, indicating slight growth. The gap between hires and separations parallels the slight increase in employment in 2014.11 For both federal government and state and local government, the average hires and separations rates were equal in 2014, indicating replacement hiring but no expansion.
Combining the churn rate with the job openings rate provides additional perspective. For example, the churn rate in construction, at 9.9 percent in 2014, was very high relative to that of other industries. With a job openings rate of only 2.0 percent—one of the lowest job openings rates among the industries—construction establishments have many employees coming and going, but the businesses can easily hire needed workers. Two of the industries with high churn (arts, entertainment, and recreation; and retail trade) are mostly able to fill open positions by the end of the month, resulting in a low job openings rate. In contrast, professional and business services and accommodation and food services both have high churn and higher than average job openings rates, indicating they need more workers in addition to replacement hires.
Among the industries with low churn, several have higher than average job openings rates, including information, finance and insurance, and health care and social assistance. These industries have few employees separating, but they also have few employees to hire and they have a considerable need for workers. The remaining industries fall somewhere between with moderate churn and moderate openings.
We can see in figure 5 that, in 2014, the same industries that had low hires and high openings and some of the lowest fill rates also had below-average churn with job openings nearly as high as the churn. These industries were information, finance and insurance, and health care and social assistance. Both federal government and state and local government also had low hires and a job openings rate nearly as high as the churn. For these establishments, separations are low, hires are low, and open jobs are left unfilled. See table 1 for a full list of industries with their corresponding rates for job openings, hires, separations, fill, and churn.
A faster way to compare the industries on the basis of job openings and churn is to create a combined rank for both. Table 2 shows that accommodation and food services; professional and business services; arts, entertainment, and recreation; and mining and logging had the highest combined labor market activity in 2014 with regard to job openings and churn. The lowest activity industries in this regard are toward the bottom of the table, with federal government and state and local government being the lowest. The industries in the middle of the table have either low openings and high churn, high openings and low churn, or medium values of both.
| Industry | Rank by job openings rate | Rank by churn rate | Combined rank |
|---|---|---|---|
| Accommodation and food services | 1 | 2 | 1 |
| Professional and business services | 2 | 3 | 2 |
| Arts, entertainment, and recreation | 6 | 1 | 3 |
| Mining and logging | 7 | 6 | 4 |
| Retail trade | 9 | 5 | 5 |
| Health care and social assistance | 3 | 11 | 5 |
| Transportation, warehousing, and utilities | 8 | 7 | 6 |
| Information | 5 | 10 | 6 |
| Other services | 11 | 8 | 7 |
| Real estate and rental and leasing | 10 | 9 | 7 |
| Finance and Insurance | 4 | 15 | 7 |
| Construction | 17 | 4 | 8 |
| Wholesale trade | 12 | 12 | 9 |
| Educational services | 14 | 13 | 10 |
| Nondurable goods manufacturing | 13 | 14 | 10 |
| Durable goods manufacturing | 15 | 16 | 11 |
| Federal government | 16 | 18 | 12 |
| State and local government | 18 | 17 | 13 |
| Source: U.S. Bureau of Labor Statistics. | |||
So far, the analysis of industries has looked only at the year 2014. One question left to answer is whether the labor demand and turnover characteristics within industries changed over the course of the business cycle and with structural changes in the economy. In short, these characteristics did not change, for the most part, over the period for which we have JOLTS data, 2001 through 2014. Each industry retained its characteristics regarding rates for job openings, hires, separations, fill, and churn.

| Industry | Job openings rate (percent) | Hires rate (percent) | Employment (in thousands) |
|---|---|---|---|
| Mining and logging | 2.1 | 3.9 | 628 |
| Construction | 2.1 | 6.6 | 7,336 |
| Durable goods manufacturing | 2.2 | 2.6 | 8,956 |
| Nondurable goods manufacturing | 1.8 | 2.5 | 5,271 |
| Wholesale trade | 2.4 | 2.8 | 5,764 |
| Retail trade | 2.8 | 5.0 | 15,280 |
| Transportation, warehousing, and utilities | 2.4 | 3.7 | 4,915 |
| Information | 3.4 | 2.7 | 3,061 |
| Finance and insurance | 3.7 | 2.4 | 6,063 |
| Real estate and rental and leasing | 2.6 | 3.9 | 2,134 |
| Professional and business services | 4.5 | 5.9 | 16,954 |
| Educational services | 2.3 | 2.4 | 2,836 |
| Health care and social assistance | 3.8 | 3.0 | 14,794 |
| Arts, entertainment, and recreation | 3.3 | 7.0 | 1,892 |
| Accommodation and food services | 4.0 | 7.0 | 10,923 |
| Other services | 2.5 | 4.0 | 5,395 |
| Federal government | 1.6 | 1.4 | 2,732 |
| State and local government | 1.7 | 1.5 | 19,073 |
| Source: U.S. Bureau of Labor Statistics. | |||

| Industry | Job openings rate | Hires rate | Employment |
|---|---|---|---|
| Mining and logging | 1.1 | 2.2 | 694 |
| Construction | 0.9 | 5.1 | 6,016 |
| Durable goods manufacturing | 0.8 | 1.6 | 7,284 |
| Nondurable goods manufacturing | 1.3 | 2.4 | 4,564 |
| Wholesale trade | 1.3 | 2.1 | 5,587 |
| Retail trade | 1.7 | 3.6 | 14,522 |
| Transportation, warehousing, and utilities | 1.2 | 2.8 | 4,796 |
| Information | 1.8 | 2.0 | 2,804 |
| Finance and insurance | 2.0 | 1.7 | 5,844 |
| Real estate and rental and leasing | 2.0 | 3.4 | 1,994 |
| Professional and business services | 2.5 | 4.1 | 16,579 |
| Educational services | 1.6 | 2.3 | 3,090 |
| Health care and social assistance | 2.9 | 2.6 | 16,460 |
| Arts, entertainment, and recreation | 1.1 | 5.1 | 1,916 |
| Accommodation and food services | 2.1 | 4.9 | 11,162 |
| Other services | 2.1 | 3.4 | 5,367 |
| Federal government | 2.5 | 1.3 | 2,832 |
| State and local government | 1.3 | 1.2 | 19,723 |
| Source: U.S. Bureau of Labor Statistics. | |||
Although all the industries were affected by the Great Recession of December 2007–June 2009, the basic characteristics of the industries did not change across the business cycle. Figures 6 and 7 show bubble charts for 2005 (before the recession) and 2009 (the last year of the recession), which can be compared with figure 2 for 2014. In all 3 years, the same group of industries is on the right side of the figure, which indicates relatively high hires rates. Likewise, no changes occurred in which of the industries appear in the left part of the graph, indicating relatively low hires rates. For example, construction maintained a high hires rate and low job openings rate across the years, while health care and social assistance maintained a low hires rate and high job openings rate, and state and local government maintained low hires and low openings.
The one industry to experience some change over time is the federal government. In most years, it had very little labor market activity with low and nearly equal hires and openings, but in the years 2008, 2009, and 2010, job openings exceeded hires. The rise in job openings in 2009 and 2010 was due to increased labor demand and hiring for the preparation and administration of the 2010 Decennial Census. The higher job openings rate for the federal government in 2009 can be seen in figure 7.
Fill rates over time. Fill rates across the years from 2001 through 2013 have similarities to those for 2014. The industries with the highest fill rates year after year are construction; retail trade; arts, entertainment, and recreation; and accommodation and food services. These are mostly the industries with both high hires levels and high hires relative to openings. The industries with the lowest fill rates year after year include information; finance and insurance; health care and social assistance; federal government; and state and local government. These are the same industries that fell in the low-hires-and-high-openings or low-hires-and-low-openings categories. The exception, as mentioned before, is the federal government because of the 2010 Decennial Census. Table 3 provides the fill rates by industry across the years from 2001 through 2014.
| Industry | 2001 | 2002 | 2003 | 2004 | 2005 | 2006 | 2007 | 2008 | 2009 | 2010 | 2011 | 2012 | 2013 | 2014 |
|---|---|---|---|---|---|---|---|---|---|---|---|---|---|---|
| Total nonfarm | 1.2 | 1.4 | 1.5 | 1.4 | 1.3 | 1.2 | 1.2 | 1.2 | 1.6 | 1.4 | 1.3 | 1.2 | 1.2 | 1.1 |
| Total private | 1.3 | 1.5 | 1.5 | 1.5 | 1.3 | 1.2 | 1.2 | 1.3 | 1.7 | 1.5 | 1.4 | 1.2 | 1.2 | 1.1 |
| Mining and logging | 1.6 | 2.4 | 3.0 | 2.6 | 1.9 | 1.5 | 2.0 | 1.5 | 2.0 | 1.5 | 1.1 | 1.7 | 1.4 | 1.2 |
| Construction | 2.6 | 3.6 | 4.1 | 3.5 | 3.1 | 2.6 | 2.3 | 3.6 | 6.0 | 4.6 | 4.4 | 3.8 | 2.8 | 2.5 |
| Durable goods manufacturing | 1.1 | 1.5 | 1.7 | 1.5 | 1.2 | 1.0 | 1.0 | 1.2 | 1.9 | 1.2 | 0.9 | 0.8 | 0.9 | 0.9 |
| Nondurable goods manufacturing | 1.6 | 1.7 | 1.7 | 1.5 | 1.4 | 1.3 | 1.2 | 1.2 | 1.9 | 1.8 | 1.5 | 1.0 | 1.0 | 1.0 |
| Wholesale trade | 1.1 | 1.5 | 1.5 | 1.3 | 1.2 | 1.0 | 0.9 | 1.2 | 1.6 | 1.4 | 1.1 | 1.0 | 0.9 | 1.0 |
| Retail trade | 1.9 | 2.0 | 2.0 | 1.9 | 1.8 | 1.8 | 1.8 | 1.9 | 2.1 | 2.1 | 1.8 | 1.6 | 1.5 | 1.5 |
| Transportation, warehousing, and utilities | 1.2 | 1.5 | 1.5 | 1.9 | 1.5 | 1.2 | 1.0 | 1.3 | 2.4 | 1.7 | 1.2 | 1.4 | 1.2 | 1.1 |
| Information | 0.9 | 1.1 | 1.1 | 0.9 | 0.8 | 0.6 | 0.5 | 0.8 | 1.0 | 0.7 | 0.6 | 0.7 | 0.7 | 0.8 |
| Finance and insurance | 0.7 | 0.8 | 0.8 | 0.7 | 0.6 | 0.6 | 0.8 | 0.8 | 0.8 | 0.6 | 0.6 | 0.6 | 0.6 | 0.6 |
| Real estate and rental and leasing | 1.4 | 1.7 | 1.6 | 2.0 | 1.4 | 1.3 | 1.4 | 1.2 | 1.7 | 1.7 | 1.4 | 1.1 | 1.3 | 1.1 |
| Professional and business services | 1.4 | 1.6 | 1.3 | 1.3 | 1.3 | 1.3 | 1.2 | 1.2 | 1.6 | 1.5 | 1.4 | 1.3 | 1.3 | 1.2 |
| Educational services | 1.3 | 1.1 | 1.4 | 1.2 | 1.0 | 1.0 | 1.1 | 1.2 | 1.4 | 1.3 | 1.3 | 1.2 | 1.1 | 1.0 |
| Health care and social assistance | 0.6 | 0.7 | 0.8 | 0.7 | 0.8 | 0.7 | 0.7 | 0.7 | 0.9 | 0.9 | 0.8 | 0.7 | 0.8 | 0.7 |
| Arts, entertainment, and recreation | 2.2 | 2.3 | 2.9 | 2.5 | 2.0 | 1.9 | 1.9 | 2.2 | 4.6 | 3.2 | 2.6 | 2.3 | 2.1 | 2.0 |
| Accommodation and food services | 1.5 | 2.0 | 2.0 | 1.9 | 1.7 | 1.6 | 1.5 | 1.7 | 2.3 | 2.2 | 1.8 | 1.6 | 1.5 | 1.2 |
| Other services | 0.9 | 1.4 | 1.6 | 1.4 | 1.6 | 1.2 | 1.0 | 1.1 | 1.6 | 1.2 | 1.6 | 1.4 | 1.3 | 1.3 |
| Federal government | 0.7 | 1.0 | 0.7 | 0.7 | 0.9 | 1.2 | 1.4 | 0.5 | 0.5 | 0.7 | 0.5 | 0.4 | 0.6 | 0.5 |
| State and local government | 0.8 | 0.8 | 0.8 | 0.9 | 0.8 | 0.8 | 0.7 | 0.8 | 0.9 | 0.9 | 0.8 | 0.8 | 0.8 | 0.7 |
| Source: U.S. Bureau of Labor Statistics. | ||||||||||||||
Although the nature of the industries relative to other industries remained the same across the business cycle with regard to the fill rate, differences in the labor market can be seen by comparing the fill rates from 2005 (prerecession), 2009 (end of recession), and 2014. In 2005, the fill rate for total private industries was 1.3, with 5 industries having a fill rate of less than 1.0 (openings outnumbering hires) and 12 industries having a fill rate greater than 1.0 (hires outnumbering openings). In contrast, in 2009 at the end of the recession, the fill rate for total private industries had risen to 1.7, which reflects the decline of hires but even steeper decline of openings during the recession. In 2014, a year when we had mostly recovered from the recession, the numbers resemble 2005 with a fill rate of 1.1 for total private industries, with nine industries having a fill rate greater than 1.0 and six industries having a fill rate of less than 1.0.
Churn rates over time. As with the other measures, the churn rates by industry for the years 2001–13 are similar to the 2014 churn rates regarding the labor turnover characteristics of the industries. However, they also illustrate the effect of the business cycle. As seen in table 4, the industries with consistently high churn rates year after year are construction; retail trade; professional and business services; arts, entertainment, and recreation; and accommodation and food services. The lowest churn rates each year are for the federal government and state and local government. The effect of the business cycle can be seen in the lower churn rates during the recession, specifically as hires and quits slowed in 2008 and 2009. Churn has increased steadily since the end of the recession as both hires and quits have risen but has not yet recovered to prerecession levels. As of 2014, the churn rate for total nonfarm industries was 6.9 compared with the 7.4 prerecession rate, and total private churn measured 7.6 in 2014 compared with 8.3 before the recession. The one different industry is construction, in which churn did not fall much during the recession. Construction is especially prone to layoffs, and the industry’s rise in layoffs counteracted its falling quits to keep churn steady through the recession.
| Industry | 2001 | 2002 | 2003 | 2004 | 2005 | 2006 | 2007 | 2008 | 2009 | 2010 | 2011 | 2012 | 2013 | 2014 |
|---|---|---|---|---|---|---|---|---|---|---|---|---|---|---|
| Total nonfarm | 8.0 | 7.5 | 7.3 | 7.5 | 7.7 | 7.6 | 7.4 | 6.9 | 6.2 | 6.2 | 6.2 | 6.4 | 6.5 | 6.9 |
| Total private | 9.0 | 8.4 | 8.2 | 8.4 | 8.6 | 8.5 | 8.3 | 7.7 | 6.9 | 6.9 | 7.0 | 7.1 | 7.2 | 7.6 |
| Mining and logging | 7.4 | 6.9 | 7.2 | 7.6 | 7.2 | 6.7 | 7.2 | 7.3 | 5.7 | 5.9 | 6.1 | 7.3 | 6.5 | 7.2 |
| Construction | 13.4 | 12.8 | 13.1 | 12.5 | 12.8 | 11.4 | 10.6 | 11.2 | 11.7 | 12.5 | 12.3 | 11.5 | 10.6 | 9.9 |
| Durable goods manufacturing | 5.1 | 5.2 | 5.0 | 5.3 | 5.3 | 5.0 | 5.1 | 4.7 | 4.5 | 4.1 | 3.8 | 3.8 | 3.7 | 3.8 |
| Nondurable goods manufacturing | 6.6 | 5.8 | 5.2 | 5.4 | 5.3 | 6.1 | 6.3 | 5.5 | 5.4 | 5.1 | 4.8 | 4.4 | 4.3 | 4.7 |
| Wholesale trade | 5.7 | 5.7 | 5.4 | 5.8 | 5.5 | 5.4 | 5.8 | 5.3 | 4.6 | 4.3 | 4.4 | 4.5 | 4.1 | 4.9 |
| Retail trade | 10.4 | 9.4 | 9.2 | 10.0 | 10.0 | 10.3 | 9.7 | 8.9 | 7.5 | 7.7 | 7.6 | 7.8 | 8.4 | 9.4 |
| Transportation, warehousing, and utilities | 6.5 | 6.0 | 5.9 | 6.8 | 7.3 | 6.9 | 6.0 | 6.0 | 6.2 | 5.4 | 5.6 | 6.2 | 6.1 | 6.7 |
| Information | 7.0 | 5.6 | 5.3 | 5.1 | 5.5 | 5.7 | 5.2 | 4.5 | 4.4 | 4.2 | 4.6 | 4.8 | 5.1 | 5.5 |
| Finance and insurance | 5.3 | 4.6 | 4.3 | 4.6 | 4.6 | 5.0 | 5.5 | 4.6 | 3.7 | 3.9 | 3.4 | 4.0 | 4.4 | 4.2 |
| Real estate and rental and leasing | 7.3 | 7.3 | 7.9 | 8.4 | 7.7 | 8.2 | 7.9 | 7.3 | 7.3 | 6.0 | 5.9 | 6.4 | 6.7 | 6.2 |
| Professional and business services | 11.9 | 12.1 | 11.2 | 11.0 | 11.5 | 10.9 | 10.4 | 9.7 | 8.6 | 9.1 | 9.8 | 9.6 | 9.6 | 10.3 |
| Educational services | 4.9 | 4.2 | 4.8 | 4.4 | 4.6 | 4.9 | 4.9 | 4.8 | 4.6 | 4.6 | 4.6 | 4.4 | 4.5 | 4.7 |
| Health care and social assistance | 6.4 | 5.9 | 5.6 | 5.5 | 5.7 | 5.8 | 5.6 | 5.5 | 5.1 | 4.8 | 4.6 | 4.9 | 5.1 | 5.3 |
| Arts, entertainment, and recreation | 16.2 | 13.7 | 14.8 | 14.2 | 13.8 | 13.0 | 13.3 | 12.3 | 10.6 | 11.2 | 12.6 | 12.7 | 12.5 | 13.2 |
| Accommodation and food services | 15.1 | 13.3 | 13.0 | 13.5 | 13.8 | 13.9 | 13.6 | 12.2 | 10.0 | 9.5 | 10.0 | 10.4 | 10.7 | 11.3 |
| Other services | 6.8 | 7.0 | 7.2 | 7.6 | 8.0 | 7.0 | 6.9 | 6.7 | 6.9 | 6.1 | 6.8 | 6.8 | 6.7 | 6.6 |
| Federal government | 2.6 | 3.1 | 2.7 | 2.7 | 2.9 | 4.1 | 4.9 | 1.9 | 2.5 | 5.5 | 2.1 | 2.2 | 2.4 | 2.3 |
| State and local government | 3.2 | 2.9 | 2.7 | 2.9 | 2.8 | 3.0 | 2.9 | 2.6 | 2.4 | 2.6 | 2.6 | 2.7 | 2.7 | 2.8 |
| Source: U.S. Bureau of Labor Statistics. | ||||||||||||||
No discussion of labor market data would be complete without at least mentioning how much the workers in the industry earn. Are high openings or high turnover due to low earnings? Or is the market more complicated than that? An analysis of earnings by industry or occupation as it relates to labor activity could be a whole article itself, but table 5 provides a quick look at job openings, churn, and average hourly earnings by industry. The earnings data are from the BLS Current Employment Statistics survey.12 The values range from an average of $13.03 per hour in the accommodation and food services industry to $34.01 per hour in the information industry. Not surprisingly, earnings are lowest in the accommodation and food services industry, which has the second highest churn rate and the highest job openings rate. However, professional and business services has one of the higher earnings rates yet has high churn and openings rates similar to accommodation and food services. The highest earnings are in the information industry in which the churn is modest and the openings rate is high. The construction industry has the sixth highest earnings but has high churn and very low openings. This combination of wages, churn, and openings suggests a more complicated labor market than one influenced simply by supply and demand and employee earnings. Much more analysis would be needed to sort through the interactions of these variables as well as to compare earnings, wages, and total compensation, all of which are different measurements.
| Industry | Job openings rate | Churn rate | Hourly earnings |
|---|---|---|---|
| Accommodation and food services | 4.5 | 11.3 | $13.03 |
| Professional and business services | 4.4 | 10.3 | 29.28 |
| Health care and social assistance | 3.9 | 5.3 | 24.98 |
| Finance and insurance | 3.7 | 4.2 | 33.00 |
| Information | 3.6 | 5.5 | 34.01 |
| Total private | 3.4 | 7.6 | 24.47 |
| Arts, entertainment, and recreation | 3.2 | 13.2 | 19.47 |
| Mining and logging | 3.1 | 7.2 | 30.78 |
| Transportation, warehousing, and utilities | 3.1 | 6.7 | 24.21 |
| Retail trade | 3.1 | 9.4 | 17.00 |
| Real estate and rental and leasing | 2.9 | 6.2 | 23.65 |
| Other services | 2.6 | 6.6 | 21.98 |
| Wholesale trade | 2.6 | 4.9 | 28.09 |
| Nondurable goods manufacturing | 2.4 | 4.7 | 22.40 |
| Durable goods manufacturing | 2.3 | 3.8 | 26.18 |
| Construction | 2.0 | 9.9 | 26.69 |
| Source: U.S. Bureau of Labor Statistics. | |||
Macroeconomic indicators such as employment, job openings, hires, separations, and earnings are essential for understanding the state of the economy and the labor market specifically. The data at the total nonfarm- or total private-industries level are quite informative. We learn even more by studying the data by industry. But analysis using only one or two of these data items misses much of the story. Studying more data items at once in relation to each other uncovers a much more complicated story of how different the industries within our economy are from each other. Some have very high turnover (arts, entertainment, and recreation), while some have very low turnover (government). Some easily find the workers they need and have few openings (construction), some need more workers than they can find (health care and social assistance), while others do not have much labor market activity at all (manufacturing). Because each industry is different, users of these labor data can benefit from studying the labor activity characteristics of the industries. Jobseekers and career changers can use the data to guide their education or job search. Job counselors could use the data to assist their clients. Employers might use the data to adjust benefits, wages, or on-the-job training opportunities if they are having trouble hiring. Government officials can learn from the data where to spend money, provide grants, develop training programs, or institute new policies. All of these people and entities are invested in the labor market and can benefit from the data series discussed in this article, all of which are readily available from the Bureau of Labor Statistics.
Charlotte Oslund, "Which industries need workers? Exploring differences in labor market activity," Monthly Labor Review, U.S. Bureau of Labor Statistics, January 2016, https://doi.org/10.21916/mlr.2016.1
1 The JOLTS job openings count excludes jobs to be filled only by internal transfers, promotions, demotions, or recall from layoffs; jobs with start dates more than 30 days in the future; jobs for which employees have been hired but have not yet reported for work; and jobs to be filled by employees of temporary help agencies, employee leasing companies, outside contractors, or consultants.
2 The employment levels used in calculating JOLTS rates at the estimation level are from the Current Employment Statistics program at the Bureau of Labor Statistics.
3 For this article, the data will be written as the ordered pair (hires rate, job openings rate).
4 Tian Luo, Amar Mann, and Richard Holden, “The expanding role of temporary help services from 1990 to 2008,” Monthly Labor Review, August 2010, https://www.bls.gov/opub/mlr/2010/08/art1full.pdf.
5 Stephen D. Simpson, “The 6 signs of an economic recovery,” Investopedia, August 16, 2010, http://www.investopedia.com/financial-edge/0810/the-6-signs-of-an-economic-recovery.aspx.
6 The Occupational Outlook Handbook is a publication of the Employment Projections program of the Bureau of Labor Statistics; see https://www.bls.gov/ooh/.
7 Lisa Baron, “Demand for financial advisors to grow,” Benefitspro, February 24, 2014, http://www.benefitspro.com/2014/02/24/demand-for-financial-advisors-to-grow.
8 Noelle M. Emerson, “Surviving a thousand cuts: America’s public schools and the recession,” American Association of School Administrators economic impact study series, December 2010, http://www.aasa.org/uploadedFiles/Policy_and_Advocacy/files/AASAThousandCutsFINAL121610.pdf.
9 Rebecca Goldring, Soheyla Taie, Minsun Riddles, and Chelsea Owens, “Teacher attrition and mobility: results from the 2012–13 teacher follow-up survey, first look,” National Center for Education Statistics, U.S. Department of Education, September 2014, http://nces.ed.gov/pubs2014/2014077.pdf.
10 The National Center for Education Statistics provides teacher demand estimates for public and private schools, among other statistics, from the Schools and Staffing Survey, http://nces.ed.gov/surveys/sass/.
11 Current Employment Statistics, www.bls.gov/ces.
12 Earnings are different from wages. For a discussion, see “Current Employment Statistics frequently asked questions,” https://www.bls.gov/web/empsit/cesfaq.htm.