
An official website of the United States government
An official website of the United States government
The .gov means it's official.
Federal government websites often end in .gov or .mil. Before sharing sensitive information,
make sure you're on a federal government site.
The site is secure.
The
https:// ensures that you are connecting to the official website and that any
information you provide is encrypted and transmitted securely.

Crossref 0
Strategies for Reducing Employee Turnover in Small- and Medium-Sized Enterprises, Westcliff International Journal of Applied Research, 2020.
Data from the Bureau of Labor Statistics Job Openings and Labor Turnover Survey continues to show improvements in the economy. All data series—job openings, hires, and total separations (and components quits, layoffs and discharges, and other separations)—increased in 2014.
Data from the Bureau of Labor Statistics Job Openings and Labor Turnover Survey (JOLTS) trended upward in 2014. Job openings rose to their highest monthly value since the series began in 2000, and the average job opening level rose 17.0 percent. Hires increased for the fifth year in a row, growing by 8.1 percent in 2014. Total separations grew as well. It is important to note that voluntary quits increased by 10.4 percent, contributing more to the increase in total separations than involuntary layoffs and discharges, which increased by 2.7 percent. Although a sharp increase in layoffs and discharges is indicative of an economic contraction, layoffs and discharges may grow slightly during times of economic growth. The larger gains in job openings, hires, and quits suggest an improvement in the labor market.
The JOLTS sample is comprised of 16,000 establishments from all 50 states and the District of Columbia, and all nonfarm industries as classified by the North American Industry Classification System (NAICS1). This allows publication of data by four regions,2 as well as by select 2-digit NAICS codes. This article examines 2014 JOLTS data, and compares the data to prior years for perspective on how the labor market has evolved. Current data will most frequently be compared with data from 2013 (the prior year) and 2007 (the start of the most recent recession).
Throughout this article, the Great Recession of 2007–2009 is frequently referenced, and is the only recession that is discussed. Because the recession began in December 2007, comparisons with 2007 help determine where various industries now stand relative to prerecession values. Levels at or above 2007 values for procyclical data elements—job openings, hires, and quits—generally indicate the industry or region has recovered. Levels at or below 2007 values for countercyclical data elements—layoffs and discharges—tend to indicate recovery as well.
Job openings, measured at a specific point in time (last business day of the month), trended upward for the fifth consecutive year in 2014—indicating continued improvement on the demand side of the labor force. Prior to the most recent recession, job openings peaked at 4.7 million in March 2007, a level that was surpassed each month from June 2014 through December 2014. There was an average of 4.6 million job openings each month in 2014, the highest monthly average for any year in JOLTS history. The next highest monthly average is 4.5 million, which occurred in 2007.
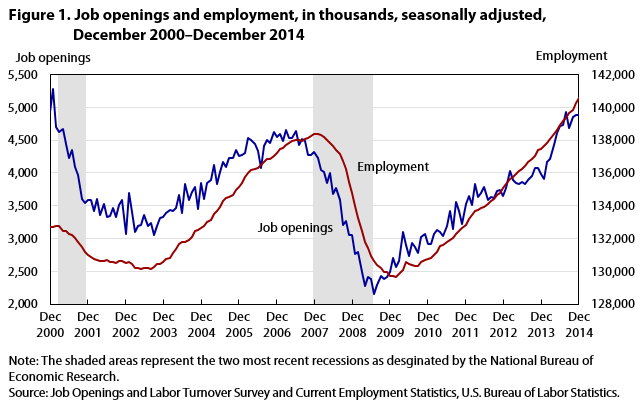
Job openings offer a procyclical measure of demand; they tend to increase during economic expansion and decrease during economic contraction. More job openings indicate that employers need additional workers, a sign of confidence in the economy. Job openings and employment3 are closely linked, and tend to rise and fall together. (See figure 1.)
| Date | Job openings | Employment |
|---|---|---|
| Dec 2000 | 4,934 | 132,723 |
| Jan 2001 | 5,273 | 132,696 |
| Feb 2001 | 4,706 | 132,767 |
| Mar 2001 | 4,618 | 132,742 |
| Apr 2001 | 4,668 | 132,460 |
| May 2001 | 4,444 | 132,422 |
| Jun 2001 | 4,232 | 132,291 |
| Jul 2001 | 4,354 | 132,179 |
| Aug 2001 | 4,095 | 132,019 |
| Sep 2001 | 3,973 | 131,778 |
| Oct 2001 | 3,594 | 131,453 |
| Nov 2001 | 3,545 | 131,159 |
| Dec 2001 | 3,586 | 130,988 |
| Jan 2002 | 3,587 | 130,849 |
| Feb 2002 | 3,412 | 130,715 |
| Mar 2002 | 3,605 | 130,695 |
| Apr 2002 | 3,357 | 130,615 |
| May 2002 | 3,525 | 130,607 |
| Jun 2002 | 3,325 | 130,663 |
| Jul 2002 | 3,343 | 130,579 |
| Aug 2002 | 3,462 | 130,563 |
| Sep 2002 | 3,319 | 130,503 |
| Oct 2002 | 3,502 | 130,628 |
| Nov 2002 | 3,585 | 130,638 |
| Dec 2002 | 3,074 | 130,481 |
| Jan 2003 | 3,686 | 130,572 |
| Feb 2003 | 3,402 | 130,421 |
| Mar 2003 | 3,101 | 130,211 |
| Apr 2003 | 3,182 | 130,167 |
| May 2003 | 3,201 | 130,157 |
| Jun 2003 | 3,356 | 130,166 |
| Jul 2003 | 3,195 | 130,190 |
| Aug 2003 | 3,239 | 130,147 |
| Sep 2003 | 3,054 | 130,250 |
| Oct 2003 | 3,196 | 130,446 |
| Nov 2003 | 3,316 | 130,463 |
| Dec 2003 | 3,334 | 130,586 |
| Jan 2004 | 3,391 | 130,746 |
| Feb 2004 | 3,437 | 130,792 |
| Mar 2004 | 3,420 | 131,123 |
| Apr 2004 | 3,466 | 131,371 |
| May 2004 | 3,658 | 131,679 |
| Jun 2004 | 3,384 | 131,753 |
| Jul 2004 | 3,835 | 131,786 |
| Aug 2004 | 3,578 | 131,918 |
| Sep 2004 | 3,704 | 132,080 |
| Oct 2004 | 3,779 | 132,425 |
| Nov 2004 | 3,456 | 132,489 |
| Dec 2004 | 3,846 | 132,618 |
| Jan 2005 | 3,595 | 132,752 |
| Feb 2005 | 3,842 | 132,991 |
| Mar 2005 | 3,891 | 133,126 |
| Apr 2005 | 4,115 | 133,489 |
| May 2005 | 3,824 | 133,665 |
| Jun 2005 | 4,018 | 133,908 |
| Jul 2005 | 4,162 | 134,283 |
| Aug 2005 | 4,085 | 134,479 |
| Sep 2005 | 4,227 | 134,545 |
| Oct 2005 | 4,230 | 134,629 |
| Nov 2005 | 4,341 | 134,966 |
| Dec 2005 | 4,249 | 135,124 |
| Jan 2006 | 4,278 | 135,401 |
| Feb 2006 | 4,308 | 135,716 |
| Mar 2006 | 4,537 | 135,997 |
| Apr 2006 | 4,495 | 136,179 |
| May 2006 | 4,432 | 136,203 |
| Jun 2006 | 4,331 | 136,280 |
| Jul 2006 | 4,081 | 136,486 |
| Aug 2006 | 4,411 | 136,671 |
| Sep 2006 | 4,498 | 136,827 |
| Oct 2006 | 4,454 | 136,830 |
| Nov 2006 | 4,622 | 137,039 |
| Dec 2006 | 4,552 | 137,211 |
| Jan 2007 | 4,590 | 137,448 |
| Feb 2007 | 4,481 | 137,536 |
| Mar 2007 | 4,657 | 137,724 |
| Apr 2007 | 4,534 | 137,802 |
| May 2007 | 4,531 | 137,947 |
| Jun 2007 | 4,639 | 138,018 |
| Jul 2007 | 4,430 | 137,984 |
| Aug 2007 | 4,508 | 137,967 |
| Sep 2007 | 4,481 | 138,053 |
| Oct 2007 | 4,278 | 138,136 |
| Nov 2007 | 4,278 | 138,253 |
| Dec 2007 | 4,323 | 138,350 |
| Jan 2008 | 4,223 | 138,365 |
| Feb 2008 | 4,039 | 138,278 |
| Mar 2008 | 4,012 | 138,199 |
| Apr 2008 | 3,850 | 137,986 |
| May 2008 | 4,000 | 137,803 |
| Jun 2008 | 3,670 | 137,631 |
| Jul 2008 | 3,762 | 137,421 |
| Aug 2008 | 3,584 | 137,162 |
| Sep 2008 | 3,210 | 136,710 |
| Oct 2008 | 3,273 | 136,234 |
| Nov 2008 | 3,059 | 135,469 |
| Dec 2008 | 3,049 | 134,773 |
| Jan 2009 | 2,763 | 133,977 |
| Feb 2009 | 2,794 | 133,274 |
| Mar 2009 | 2,493 | 132,450 |
| Apr 2009 | 2,271 | 131,766 |
| May 2009 | 2,413 | 131,411 |
| Jun 2009 | 2,388 | 130,944 |
| Jul 2009 | 2,146 | 130,619 |
| Aug 2009 | 2,294 | 130,402 |
| Sep 2009 | 2,434 | 130,175 |
| Oct 2009 | 2,376 | 129,974 |
| Nov 2009 | 2,419 | 129,968 |
| Dec 2009 | 2,490 | 129,685 |
| Jan 2010 | 2,706 | 129,717 |
| Feb 2010 | 2,561 | 129,649 |
| Mar 2010 | 2,652 | 129,810 |
| Apr 2010 | 3,097 | 130,057 |
| May 2010 | 2,900 | 130,575 |
| Jun 2010 | 2,728 | 130,445 |
| Jul 2010 | 2,929 | 130,381 |
| Aug 2010 | 2,869 | 130,342 |
| Sep 2010 | 2,782 | 130,293 |
| Oct 2010 | 3,026 | 130,541 |
| Nov 2010 | 3,072 | 130,662 |
| Dec 2010 | 2,909 | 130,751 |
| Jan 2011 | 2,917 | 130,826 |
| Feb 2011 | 3,065 | 130,993 |
| Mar 2011 | 3,132 | 131,199 |
| Apr 2011 | 3,099 | 131,520 |
| May 2011 | 3,032 | 131,623 |
| Jun 2011 | 3,194 | 131,808 |
| Jul 2011 | 3,417 | 131,925 |
| Aug 2011 | 3,138 | 132,053 |
| Sep 2011 | 3,557 | 132,276 |
| Oct 2011 | 3,422 | 132,459 |
| Nov 2011 | 3,215 | 132,605 |
| Dec 2011 | 3,527 | 132,831 |
| Jan 2012 | 3,653 | 133,211 |
| Feb 2012 | 3,517 | 133,458 |
| Mar 2012 | 3,837 | 133,674 |
| Apr 2012 | 3,627 | 133,761 |
| May 2012 | 3,696 | 133,874 |
| Jun 2012 | 3,785 | 133,909 |
| Jul 2012 | 3,587 | 134,086 |
| Aug 2012 | 3,637 | 134,274 |
| Sep 2012 | 3,614 | 134,418 |
| Oct 2012 | 3,729 | 134,631 |
| Nov 2012 | 3,741 | 134,795 |
| Dec 2012 | 3,640 | 135,088 |
| Jan 2013 | 3,770 | 135,293 |
| Feb 2013 | 4,023 | 135,607 |
| Mar 2013 | 3,891 | 135,722 |
| Apr 2013 | 3,840 | 135,909 |
| May 2013 | 3,829 | 136,128 |
| Jun 2013 | 3,864 | 136,255 |
| Jul 2013 | 3,829 | 136,419 |
| Aug 2013 | 3,893 | 136,675 |
| Sep 2013 | 3,955 | 136,825 |
| Oct 2013 | 4,076 | 137,050 |
| Nov 2013 | 4,073 | 137,367 |
| Dec 2013 | 3,977 | 137,476 |
| Jan 2014 | 3,906 | 137,642 |
| Feb 2014 | 4,160 | 137,830 |
| Mar 2014 | 4,210 | 138,055 |
| Apr 2014 | 4,417 | 138,385 |
| May 2014 | 4,608 | 138,621 |
| Jun 2014 | 4,710 | 138,907 |
| Jul 2014 | 4,726 | 139,156 |
| Aug 2014 | 4,925 | 139,369 |
| Sep 2014 | 4,678 | 139,619 |
| Oct 2014 | 4,849 | 139,840 |
| Nov 2014 | 4,886 | 140,263 |
| Dec 2014 | 4,877 | 140,592 |
| Source: Job Openings and Labor Turnover Survey and Current Employment Statistics, U.S. Bureau of Labor Statistics. | ||
Job openings and employment figures tend to follow a similar pattern, and in 2014 both trended higher than in previous years. Average monthly job openings rose from 3.9 million in 2013 to 4.6 million in 2014, a 17.0 percent increase. Average monthly employment increased by 1.9 percent over the same period. Monthly averages for both job openings and employment in 2014 were the highest values measured since the series began. Job openings fell to a series low in July 2009, one month after the end of the recession, but have steadily increased since then, rising by 127.3 percent. The post-recession low for employment occurred in February 2010 (7 months after the job openings low), but has risen 8.4 percent since.
Job openings remained relatively flat over the first and fourth quarters of 2014, with most of the growth occurring in the middle of the year. Average monthly job openings increased 1.2 percent in the first quarter, 11.9 percent in the second quarter, 4.3 percent in the third quarter, and 2.0 percent in the fourth quarter.
Job openings by industry and region
Average monthly job openings increased in all industries from 2013 to 2014. The largest over-the-year changes in average job openings occurred in mining and logging (40.7 percent), accommodation and food services (28.8 percent), and professional and business services (26.2 percent). The least growth occurred in other services (1.8 percent) and finance and insurance (3.6 percent). (See table 1.)
| Industry and region | Annual level | Change from 2013 to 2014 | |||
|---|---|---|---|---|---|
| 2012 | 2013 | 2014 | Level | Percent | |
| Total | 3,673 | 3,915 | 4,579 | 665 | 17.0 |
| Total private | 3,296 | 3,524 | 4,139 | 616 | 17.5 |
| Mining and logging | 19 | 21 | 29 | 8 | 40.7 |
| Construction | 88 | 116 | 128 | 12 | 10.5 |
| Manufacturing | 274 | 265 | 290 | 25 | 9.2 |
| Durable goods | 177 | 169 | 179 | 10 | 6.0 |
| Nondurable goods | 97 | 97 | 111 | 15 | 15.0 |
| Trade, transportation, and utilities | 609 | 713 | 807 | 94 | 13.2 |
| Wholesale trade | 129 | 129 | 153 | 24 | 18.5 |
| Retail trade | 366 | 446 | 488 | 42 | 9.4 |
| Transportation, warehousing, and utilities | 114 | 138 | 166 | 28 | 20.3 |
| Information | 97 | 97 | 103 | 6 | 6.3 |
| Financial activities | 246 | 274 | 289 | 14 | 5.2 |
| Finance and insurance | 185 | 220 | 228 | 8 | 3.6 |
| Real estate and rental and leasing | 61 | 55 | 61 | 6 | 11.5 |
| Professional and business services | 688 | 692 | 874 | 182 | 26.2 |
| Education and health services | 700 | 680 | 810 | 130 | 19.2 |
| Educational services | 60 | 66 | 80 | 14 | 21.3 |
| Health care and social assistance | 640 | 613 | 730 | 117 | 19.0 |
| Leisure and hospitality | 444 | 521 | 661 | 141 | 27.0 |
| Arts, entertainment, and recreation | 56 | 61 | 70 | 9 | 14.1 |
| Accommodation and food services | 388 | 459 | 591 | 132 | 28.8 |
| Other services | 132 | 146 | 149 | 3 | 1.8 |
| Government | 376 | 391 | 440 | 49 | 12.6 |
| Federal | 69 | 54 | 61 | 7 | 13.6 |
| State and local | 308 | 337 | 379 | 42 | 12.5 |
| Northeast | 668 | 680 | 757 | 77 | 11.3 |
| South | 1,429 | 1,494 | 1,744 | 250 | 16.7 |
| Midwest | 807 | 866 | 1,037 | 171 | 19.7 |
| West | 768 | 875 | 1,042 | 167 | 19.1 |
| Source: Job Openings and Labor Turnover Survey, U.S. Bureau of Labor Statistics. | |||||
In all regions, average monthly job openings increased in 2014. The largest gains occurred in the Midwest, at 19.7 percent, and the West, at 19.1 percent.
| Industry and region | Percent |
|---|---|
| Total | 102 |
| Mining and logging | 206 |
| Construction | 74 |
| Durable goods | 85 |
| Nondurable goods | 85 |
| Wholesale trade | 74 |
| Reatail trade | 118 |
| Transportation, warehousing, and utilities | 102 |
| Information | 72 |
| Finance and insurance | 108 |
| Real estate and rental and leasing | 97 |
| Professional and business services | 115 |
| Educational services | 118 |
| Health care and social assistance | 105 |
| Arts, entertainment, and recreation | 98 |
| Accommodation and food services | 111 |
| Other services | 81 |
| Federal government | 127 |
| State and local government | 96 |
| Northeast | 103 |
| South | 98 |
| Midwest | 125 |
| West | 92 |
| Source: Job Openings and Labor Turnover Survey, U.S. Bureau of Labor Statistics. | |
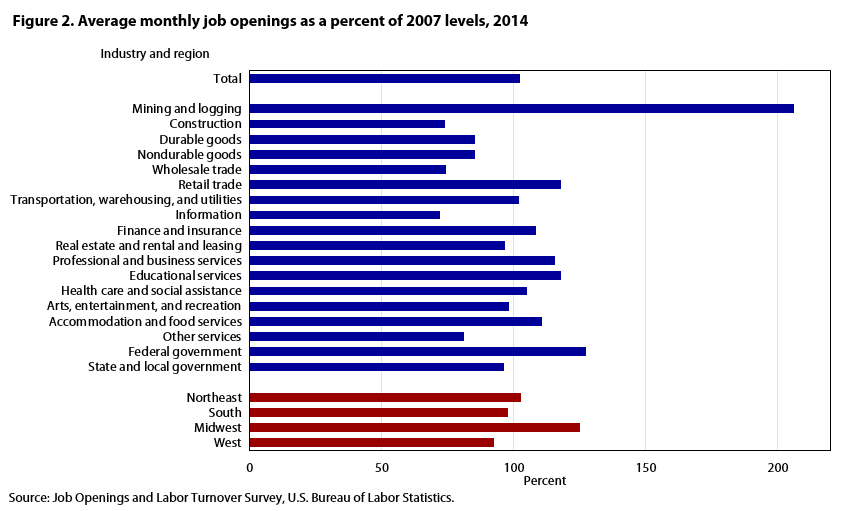
The 2014 total nonfarm average monthly job openings level increased slightly above the 2007 average level, the year the recession began; the monthly average was 4.6 million in 2014, compared with 4.5 million in 2007. Individual industries are notable for rising at different rates since the depth of the recession. Some industries have recovered to their prerecession values, while others have not. (See figure 2.) Mining and logging showed the largest increase, with a monthly average standing at 206 percent of its 2007 average level. Federal government rose to 127 percent of its 2007 level. While these industries grew, others fell behind. Information lagged the most, reaching only 72 percent of its prerecession average level. Construction and wholesale trade have also lagged. Each recovered to 74 percent of their 2007 average levels.
Among regions, average monthly job openings increased most in the Midwest, standing at 125 percent of its 2007 level. The Northeast also added job openings, improving to 103 percent of the 2007 level. Average monthly openings lagged in the West and South, standing at 92 and 98 percent, respectively.
Job openings and unemployment4
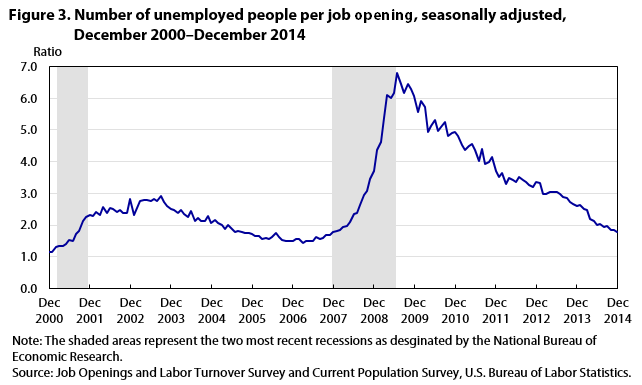
The job openings and unemployment levels generally move in opposite directions. During a robust economy, job openings are high and unemployment is low. During an economic contraction, the dynamics reverse—unemployment rises, while job openings fall. Accordingly, the ratio of the unemployed to job openings provides a metric that helps describe the state of the economy. Figure 3 graphs this ratio from December 2000 through December 2014. Since July 2009, 1 month after the end of the recession, this ratio has trended downward. In January 2014, the ratio stood at 2.6. By December 2014, it had fallen to 1.8, the same ratio present in December 2007, the start of the recession.
| Date | Ratio |
|---|---|
| Dec 2000 | 1.1 |
| Jan 2001 | 1.1 |
| Feb 2001 | 1.3 |
| Mar 2001 | 1.3 |
| Apr 2001 | 1.3 |
| May 2001 | 1.4 |
| Jun 2001 | 1.5 |
| Jul 2001 | 1.5 |
| Aug 2001 | 1.7 |
| Sep 2001 | 1.8 |
| Oct 2001 | 2.1 |
| Nov 2001 | 2.3 |
| Dec 2001 | 2.3 |
| Jan 2002 | 2.3 |
| Feb 2002 | 2.4 |
| Mar 2002 | 2.3 |
| Apr 2002 | 2.6 |
| May 2002 | 2.4 |
| Jun 2002 | 2.5 |
| Jul 2002 | 2.5 |
| Aug 2002 | 2.4 |
| Sep 2002 | 2.5 |
| Oct 2002 | 2.4 |
| Nov 2002 | 2.4 |
| Dec 2002 | 2.8 |
| Jan 2003 | 2.3 |
| Feb 2003 | 2.5 |
| Mar 2003 | 2.8 |
| Apr 2003 | 2.8 |
| May 2003 | 2.8 |
| Jun 2003 | 2.8 |
| Jul 2003 | 2.8 |
| Aug 2003 | 2.7 |
| Sep 2003 | 2.9 |
| Oct 2003 | 2.7 |
| Nov 2003 | 2.6 |
| Dec 2003 | 2.5 |
| Jan 2004 | 2.5 |
| Feb 2004 | 2.4 |
| Mar 2004 | 2.5 |
| Apr 2004 | 2.4 |
| May 2004 | 2.2 |
| Jun 2004 | 2.4 |
| Jul 2004 | 2.1 |
| Aug 2004 | 2.2 |
| Sep 2004 | 2.1 |
| Oct 2004 | 2.1 |
| Nov 2004 | 2.3 |
| Dec 2004 | 2.1 |
| Jan 2005 | 2.2 |
| Feb 2005 | 2.1 |
| Mar 2005 | 2.0 |
| Apr 2005 | 1.9 |
| May 2005 | 2.0 |
| Jun 2005 | 1.9 |
| Jul 2005 | 1.8 |
| Aug 2005 | 1.8 |
| Sep 2005 | 1.8 |
| Oct 2005 | 1.8 |
| Nov 2005 | 1.7 |
| Dec 2005 | 1.7 |
| Jan 2006 | 1.7 |
| Feb 2006 | 1.7 |
| Mar 2006 | 1.6 |
| Apr 2006 | 1.6 |
| May 2006 | 1.6 |
| Jun 2006 | 1.6 |
| Jul 2006 | 1.8 |
| Aug 2006 | 1.6 |
| Sep 2006 | 1.5 |
| Oct 2006 | 1.5 |
| Nov 2006 | 1.5 |
| Dec 2006 | 1.5 |
| Jan 2007 | 1.6 |
| Feb 2007 | 1.5 |
| Mar 2007 | 1.4 |
| Apr 2007 | 1.5 |
| May 2007 | 1.5 |
| Jun 2007 | 1.5 |
| Jul 2007 | 1.6 |
| Aug 2007 | 1.6 |
| Sep 2007 | 1.6 |
| Oct 2007 | 1.7 |
| Nov 2007 | 1.7 |
| Dec 2007 | 1.8 |
| Jan 2008 | 1.8 |
| Feb 2008 | 1.9 |
| Mar 2008 | 1.9 |
| Apr 2008 | 2.0 |
| May 2008 | 2.1 |
| Jun 2008 | 2.3 |
| Jul 2008 | 2.4 |
| Aug 2008 | 2.6 |
| Sep 2008 | 3.0 |
| Oct 2008 | 3.1 |
| Nov 2008 | 3.4 |
| Dec 2008 | 3.7 |
| Jan 2009 | 4.4 |
| Feb 2009 | 4.6 |
| Mar 2009 | 5.4 |
| Apr 2009 | 6.1 |
| May 2009 | 6.0 |
| Jun 2009 | 6.2 |
| Jul 2009 | 6.8 |
| Aug 2009 | 6.5 |
| Sep 2009 | 6.2 |
| Oct 2009 | 6.5 |
| Nov 2009 | 6.3 |
| Dec 2009 | 6.1 |
| Jan 2010 | 5.6 |
| Feb 2010 | 5.9 |
| Mar 2010 | 5.7 |
| Apr 2010 | 4.9 |
| May 2010 | 5.1 |
| Jun 2010 | 5.3 |
| Jul 2010 | 5.0 |
| Aug 2010 | 5.1 |
| Sep 2010 | 5.2 |
| Oct 2010 | 4.8 |
| Nov 2010 | 4.9 |
| Dec 2010 | 4.9 |
| Jan 2011 | 4.8 |
| Feb 2011 | 4.5 |
| Mar 2011 | 4.4 |
| Apr 2011 | 4.5 |
| May 2011 | 4.6 |
| Jun 2011 | 4.4 |
| Jul 2011 | 4.0 |
| Aug 2011 | 4.4 |
| Sep 2011 | 3.9 |
| Oct 2011 | 4.0 |
| Nov 2011 | 4.1 |
| Dec 2011 | 3.7 |
| Jan 2012 | 3.5 |
| Feb 2012 | 3.6 |
| Mar 2012 | 3.3 |
| Apr 2012 | 3.5 |
| May 2012 | 3.4 |
| Jun 2012 | 3.4 |
| Jul 2012 | 3.5 |
| Aug 2012 | 3.4 |
| Sep 2012 | 3.3 |
| Oct 2012 | 3.3 |
| Nov 2012 | 3.2 |
| Dec 2012 | 3.4 |
| Jan 2013 | 3.3 |
| Feb 2013 | 3.0 |
| Mar 2013 | 3.0 |
| Apr 2013 | 3.1 |
| May 2013 | 3.0 |
| Jun 2013 | 3.0 |
| Jul 2013 | 3.0 |
| Aug 2013 | 2.9 |
| Sep 2013 | 2.8 |
| Oct 2013 | 2.7 |
| Nov 2013 | 2.7 |
| Dec 2013 | 2.6 |
| Jan 2014 | 2.6 |
| Feb 2014 | 2.5 |
| Mar 2014 | 2.5 |
| Apr 2014 | 2.2 |
| May 2014 | 2.1 |
| Jun 2014 | 2.0 |
| Jul 2014 | 2.0 |
| Aug 2014 | 1.9 |
| Sep 2014 | 2.0 |
| Oct 2014 | 1.9 |
| Nov 2014 | 1.9 |
| Dec 2014 | 1.8 |
| Source: Job Openings and Labor Turnover Survey and Curent Population Survey, U.S. Bureau of Labor Statistics. | |
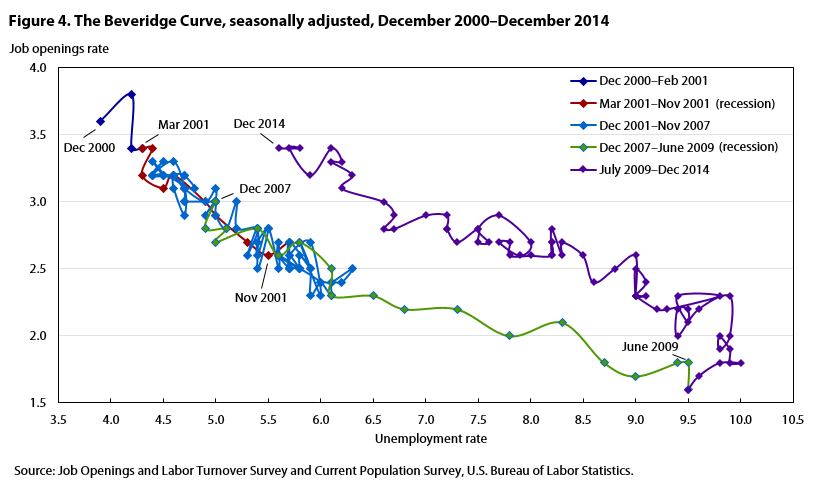
The inverse relationship between job openings and unemployment can be analyzed using the Beveridge Curve. (See figure 4.) Each month corresponds to a point on the curve—the unemployment rate is plotted on the x-axis while the job openings rate is plotted on the y-axis. During an economic expansion, the monthly point on the curve is expected to move high and to the left on the graph, indicating high job openings and low unemployment. During a contraction, the monthly point on the curve is expected to fall and move to the right, as happened during the recession. From 2009 (when the recession ended) through April 2010, the unemployment rate remained high toward the right on the curve, while the job openings rate moved up. Since April 2010, the point on the curve has moved up further and to the left, similar to the historical pattern. Therefore, the current post recession curve has shifted outward from the prerecession curve. There is historical evidence indicating that a shift immediately following a recession is natural and should be interpreted as a cyclical pattern.5 Another theory suggests that a shift may be due to structural changes—a change in the matching efficiency between prospective workers and potential employers;6 or that potential workers lack the skills that employers seek.7
| Date | Job openings rate | Unemployment rate |
|---|---|---|
| Dec 2000 | 3.6 | 3.9 |
| Jan 2001 | 3.8 | 4.2 |
| Feb 2001 | 3.4 | 4.2 |
| Mar 2001 | 3.4 | 4.3 |
| Apr 2001 | 3.4 | 4.4 |
| May 2001 | 3.2 | 4.3 |
| Jun 2001 | 3.1 | 4.5 |
| Jul 2001 | 3.2 | 4.6 |
| Aug 2001 | 3.0 | 4.9 |
| Sep 2001 | 2.9 | 5.0 |
| Oct 2001 | 2.7 | 5.3 |
| Nov 2001 | 2.6 | 5.5 |
| Dec 2001 | 2.7 | 5.7 |
| Jan 2002 | 2.7 | 5.7 |
| Feb 2002 | 2.5 | 5.7 |
| Mar 2002 | 2.7 | 5.7 |
| Apr 2002 | 2.5 | 5.9 |
| May 2002 | 2.6 | 5.8 |
| Jun 2002 | 2.5 | 5.8 |
| Jul 2002 | 2.5 | 5.8 |
| Aug 2002 | 2.6 | 5.7 |
| Sep 2002 | 2.5 | 5.7 |
| Oct 2002 | 2.6 | 5.7 |
| Nov 2002 | 2.7 | 5.9 |
| Dec 2002 | 2.3 | 6.0 |
| Jan 2003 | 2.7 | 5.8 |
| Feb 2003 | 2.5 | 5.9 |
| Mar 2003 | 2.3 | 5.9 |
| Apr 2003 | 2.4 | 6.0 |
| May 2003 | 2.4 | 6.1 |
| Jun 2003 | 2.5 | 6.3 |
| Jul 2003 | 2.4 | 6.2 |
| Aug 2003 | 2.4 | 6.1 |
| Sep 2003 | 2.3 | 6.1 |
| Oct 2003 | 2.4 | 6.0 |
| Nov 2003 | 2.5 | 5.8 |
| Dec 2003 | 2.5 | 5.7 |
| Jan 2004 | 2.5 | 5.7 |
| Feb 2004 | 2.6 | 5.6 |
| Mar 2004 | 2.5 | 5.8 |
| Apr 2004 | 2.6 | 5.6 |
| May 2004 | 2.7 | 5.6 |
| Jun 2004 | 2.5 | 5.6 |
| Jul 2004 | 2.8 | 5.5 |
| Aug 2004 | 2.6 | 5.4 |
| Sep 2004 | 2.7 | 5.4 |
| Oct 2004 | 2.8 | 5.5 |
| Nov 2004 | 2.5 | 5.4 |
| Dec 2004 | 2.8 | 5.4 |
| Jan 2005 | 2.6 | 5.3 |
| Feb 2005 | 2.8 | 5.4 |
| Mar 2005 | 2.8 | 5.2 |
| Apr 2005 | 3.0 | 5.2 |
| May 2005 | 2.8 | 5.1 |
| Jun 2005 | 2.9 | 5.0 |
| Jul 2005 | 3.0 | 5.0 |
| Aug 2005 | 2.9 | 4.9 |
| Sep 2005 | 3.0 | 5.0 |
| Oct 2005 | 3.0 | 5.0 |
| Nov 2005 | 3.1 | 5.0 |
| Dec 2005 | 3.0 | 4.9 |
| Jan 2006 | 3.1 | 4.7 |
| Feb 2006 | 3.1 | 4.8 |
| Mar 2006 | 3.2 | 4.7 |
| Apr 2006 | 3.2 | 4.7 |
| May 2006 | 3.2 | 4.6 |
| Jun 2006 | 3.1 | 4.6 |
| Jul 2006 | 2.9 | 4.7 |
| Aug 2006 | 3.1 | 4.7 |
| Sep 2006 | 3.2 | 4.5 |
| Oct 2006 | 3.2 | 4.4 |
| Nov 2006 | 3.3 | 4.5 |
| Dec 2006 | 3.2 | 4.4 |
| Jan 2007 | 3.2 | 4.6 |
| Feb 2007 | 3.2 | 4.5 |
| Mar 2007 | 3.3 | 4.4 |
| Apr 2007 | 3.2 | 4.5 |
| May 2007 | 3.2 | 4.4 |
| Jun 2007 | 3.3 | 4.6 |
| Jul 2007 | 3.1 | 4.7 |
| Aug 2007 | 3.2 | 4.6 |
| Sep 2007 | 3.1 | 4.7 |
| Oct 2007 | 3.0 | 4.7 |
| Nov 2007 | 3.0 | 4.7 |
| Dec 2007 | 3.0 | 5.0 |
| Jan 2008 | 3.0 | 5.0 |
| Feb 2008 | 2.8 | 4.9 |
| Mar 2008 | 2.8 | 5.1 |
| Apr 2008 | 2.7 | 5.0 |
| May 2008 | 2.8 | 5.4 |
| Jun 2008 | 2.6 | 5.6 |
| Jul 2008 | 2.7 | 5.8 |
| Aug 2008 | 2.5 | 6.1 |
| Sep 2008 | 2.3 | 6.1 |
| Oct 2008 | 2.3 | 6.5 |
| Nov 2008 | 2.2 | 6.8 |
| Dec 2008 | 2.2 | 7.3 |
| Jan 2009 | 2.0 | 7.8 |
| Feb 2009 | 2.1 | 8.3 |
| Mar 2009 | 1.8 | 8.7 |
| Apr 2009 | 1.7 | 9.0 |
| May 2009 | 1.8 | 9.4 |
| Jun 2009 | 1.8 | 9.5 |
| Jul 2009 | 1.6 | 9.5 |
| Aug 2009 | 1.7 | 9.6 |
| Sep 2009 | 1.8 | 9.8 |
| Oct 2009 | 1.8 | 10.0 |
| Nov 2009 | 1.8 | 9.9 |
| Dec 2009 | 1.9 | 9.9 |
| Jan 2010 | 2.0 | 9.8 |
| Feb 2010 | 1.9 | 9.8 |
| Mar 2010 | 2.0 | 9.9 |
| Apr 2010 | 2.3 | 9.9 |
| May 2010 | 2.2 | 9.6 |
| Jun 2010 | 2.0 | 9.4 |
| Jul 2010 | 2.2 | 9.4 |
| Aug 2010 | 2.2 | 9.5 |
| Sep 2010 | 2.1 | 9.5 |
| Oct 2010 | 2.3 | 9.4 |
| Nov 2010 | 2.3 | 9.8 |
| Dec 2010 | 2.2 | 9.3 |
| Jan 2011 | 2.2 | 9.2 |
| Feb 2011 | 2.3 | 9.0 |
| Mar 2011 | 2.3 | 9.0 |
| Apr 2011 | 2.3 | 9.1 |
| May 2011 | 2.3 | 9.0 |
| Jun 2011 | 2.4 | 9.1 |
| Jul 2011 | 2.5 | 9.0 |
| Aug 2011 | 2.3 | 9.0 |
| Sep 2011 | 2.6 | 9.0 |
| Oct 2011 | 2.5 | 8.8 |
| Nov 2011 | 2.4 | 8.6 |
| Dec 2011 | 2.6 | 8.5 |
| Jan 2012 | 2.7 | 8.3 |
| Feb 2012 | 2.6 | 8.3 |
| Mar 2012 | 2.8 | 8.2 |
| Apr 2012 | 2.6 | 8.2 |
| May 2012 | 2.7 | 8.2 |
| Jun 2012 | 2.7 | 8.2 |
| Jul 2012 | 2.6 | 8.2 |
| Aug 2012 | 2.6 | 8.0 |
| Sep 2012 | 2.6 | 7.8 |
| Oct 2012 | 2.7 | 7.8 |
| Nov 2012 | 2.7 | 7.7 |
| Dec 2012 | 2.6 | 7.9 |
| Jan 2013 | 2.7 | 8.0 |
| Feb 2013 | 2.9 | 7.7 |
| Mar 2013 | 2.8 | 7.5 |
| Apr 2013 | 2.7 | 7.6 |
| May 2013 | 2.7 | 7.5 |
| Jun 2013 | 2.8 | 7.5 |
| Jul 2013 | 2.7 | 7.3 |
| Aug 2013 | 2.8 | 7.2 |
| Sep 2013 | 2.8 | 7.2 |
| Oct 2013 | 2.9 | 7.2 |
| Nov 2013 | 2.9 | 7.0 |
| Dec 2013 | 2.8 | 6.7 |
| Jan 2014 | 2.8 | 6.6 |
| Feb 2014 | 2.9 | 6.7 |
| Mar 2014 | 3.0 | 6.6 |
| Apr 2014 | 3.1 | 6.2 |
| May 2014 | 3.2 | 6.3 |
| Jun 2014 | 3.3 | 6.1 |
| Jul 2014 | 3.3 | 6.2 |
| Aug 2014 | 3.4 | 6.1 |
| Sep 2014 | 3.2 | 5.9 |
| Oct 2014 | 3.4 | 5.7 |
| Nov 2014 | 3.4 | 5.8 |
| Dec 2014 | 3.4 | 5.6 |
| Source: Job Openings and Labor Turnover Survey and Current Population Survey, U.S. Bureau of Labor Statistics. | ||
In 2014, hires grew for the fifth consecutive year. Hires increased 8.1 percent, from 54.2 million to 58.7 million. In September, for the first time in nearly seven years, monthly hires returned to the level present when the recession began in December 2007 (5.0 million). Hires remained at or above 5.0 million the rest of the year. Growth remained consistent throughout the year; hires grew at a rate of 3.1 percent in the first quarter, 2.7 percent in the second quarter, 3.1 percent in the third quarter, and 3.5 percent in the fourth quarter.
Hires by industry and region
The growth in hires varied by industry—14 industries had more hires than in 2013, while 4 had fewer hires. The industries with the largest gains were wholesale trade, at 23.8 percent, and mining and logging, at 17.6 percent. The real estate and rental and leasing industry declined 4.5 percent, the largest of any single industry. Finance and insurance followed with a 2.9 percent decrease. (See table 2.)
Hires increased in all four regions in 2014. The Midwest experienced the greatest increase, 11.6 percent. The Northeast grew at the slowest rate, increasing 4.1 percent.
| Industry and region | Annual level | Change from 2013 to 2014 | |||
|---|---|---|---|---|---|
| 2012 | 2013 | 2014 | Level | Percent | |
| Total | 52,367 | 54,241 | 58,657 | 4,416 | 8.1 |
| Total private | 48,916 | 50,787 | 55,048 | 4,261 | 8.4 |
| Mining and logging | 379 | 346 | 407 | 61 | 17.6 |
| Construction | 3,969 | 3,844 | 3,799 | -45 | -1.2 |
| Manufacturing | 2,982 | 2,895 | 3,115 | 220 | 7.6 |
| Durable goods | 1,793 | 1,740 | 1,838 | 98 | 5.6 |
| Nondurable goods | 1,186 | 1,151 | 1,280 | 129 | 11.2 |
| Trade, transportation, and utilities | 10,480 | 11,153 | 12,776 | 1,623 | 14.6 |
| Wholesale trade | 1,558 | 1,422 | 1,760 | 338 | 23.8 |
| Retail trade | 6,999 | 7,810 | 8,827 | 1,017 | 13.0 |
| Transportation, warehousing, and utilities | 1,922 | 1,919 | 2,187 | 268 | 14.0 |
| Information | 767 | 844 | 926 | 82 | 9.7 |
| Financial activities | 2,183 | 2,406 | 2,322 | -84 | -3.5 |
| Finance and insurance | 1,412 | 1,580 | 1,534 | -46 | -2.9 |
| Real estate and rental and leasing | 771 | 825 | 788 | -37 | -4.5 |
| Professional and business services | 10,604 | 10,970 | 12,109 | 1,139 | 10.4 |
| Education and health services | 6,229 | 6,463 | 6,887 | 424 | 6.6 |
| Educational services | 883 | 900 | 992 | 92 | 10.2 |
| Health care and social assistance | 5,344 | 5,565 | 5,896 | 331 | 5.9 |
| Leisure and hospitality | 9,099 | 9,634 | 10,469 | 835 | 8.7 |
| Arts, entertainment, and recreation | 1,540 | 1,569 | 1,719 | 150 | 9.6 |
| Accommodation and food services | 7,559 | 8,063 | 8,749 | 686 | 8.5 |
| Other services | 2,226 | 2,241 | 2,238 | -3 | -.1 |
| Government | 3,450 | 3,453 | 3,611 | 158 | 4.6 |
| Federal | 364 | 368 | 375 | 7 | 1.9 |
| State and local | 3,086 | 3,084 | 3,237 | 153 | 5.0 |
| Northeast | 8,443 | 8,527 | 8,880 | 353 | 4.1 |
| South | 20,731 | 21,464 | 23,104 | 1,640 | 7.6 |
| Midwest | 11,623 | 11,878 | 13,256 | 1,378 | 11.6 |
| West | 11,568 | 12,377 | 13,420 | 1,043 | 8.4 |
| Source: Job Openings and Labor Turnover Survey, U.S. Bureau of Labor Statistics. | |||||
In 2014, annual hires nearly recovered their prerecession value, reaching 94 percent of the 2007 level. While hires in some individual industries surpassed 2007 levels, most fell short. The two industries with the largest gains were mining and logging, and transportation, warehousing, and utilities; these groups surpassed 2007 levels, standing at 123 percent and 117 percent respectively. Federal government hires experienced the least growth, tallying a mere 46 percent of the 2007 level; this occurred despite an increase in the federal government monthly average job openings between the two time periods. Hires were down across all four regions, compared to 2007 levels. (See figure 5.)
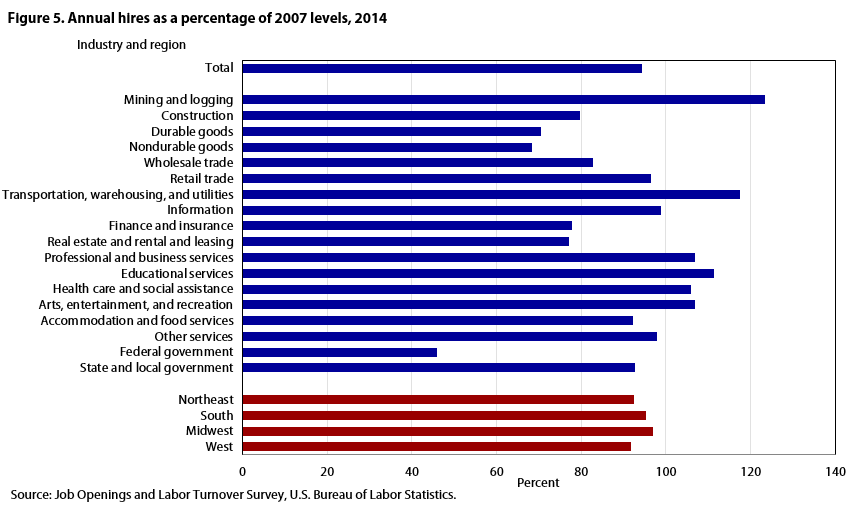
| Industry and region | Percent |
|---|---|
| Total | 94 |
| Mining and logging | 123 |
| Construction | 80 |
| Durable goods | 71 |
| Nondurable goods | 68 |
| Wholesale trade | 83 |
| Retail trade | 97 |
| Transportation, warehousing, and utilities | 117 |
| Information | 99 |
| Finance and insurance | 78 |
| Real estate and rental and leasing | 77 |
| Professional and business services | 107 |
| Educational services | 111 |
| Health care and social assistance | 106 |
| Arts, entertainment, and recreation | 107 |
| Accommodation and food services | 92 |
| Other services | 98 |
| Federal government | 46 |
| State and local government | 93 |
| Northeast | 93 |
| South | 95 |
| Midwest | 97 |
| West | 92 |
| Source: Job Openings and Labor Turnover Survey, U.S. Bureau of Labor Statistics. | |
Total separations—disaggregated into quits, layoffs and discharges, and other separations—increased in 2014, from 51.8 million to 55.5 million. This growth was driven mostly by quits, which rose from 27.6 million to 30.5 million, a 10.4 percent increase. Layoffs and discharges grew at a smaller rate—from 19.9 million to 20.4 million, an increase of 2.7 percent. Other separations (retirements, transfers, deaths, and separations caused by disability) increased as well, from 4.3 million to 4.6 million.
| Date | Hires | Total separations | Employment |
|---|---|---|---|
| Dec 2000 | 5,395 | 5,266 | 132,723 |
| Jan 2001 | 5,801 | 5,867 | 132,696 |
| Feb 2001 | 5,434 | 5,412 | 132,767 |
| Mar 2001 | 5,619 | 5,689 | 132,742 |
| Apr 2001 | 5,335 | 5,547 | 132,460 |
| May 2001 | 5,358 | 5,486 | 132,422 |
| Jun 2001 | 5,083 | 5,279 | 132,291 |
| Jul 2001 | 5,173 | 5,250 | 132,179 |
| Aug 2001 | 5,076 | 5,102 | 132,019 |
| Sep 2001 | 4,961 | 5,175 | 131,778 |
| Oct 2001 | 5,016 | 5,437 | 131,453 |
| Nov 2001 | 4,887 | 5,074 | 131,159 |
| Dec 2001 | 4,788 | 4,878 | 130,988 |
| Jan 2002 | 4,900 | 5,107 | 130,849 |
| Feb 2002 | 4,883 | 5,022 | 130,715 |
| Mar 2002 | 4,626 | 4,667 | 130,695 |
| Apr 2002 | 4,930 | 5,008 | 130,615 |
| May 2002 | 4,923 | 5,004 | 130,607 |
| Jun 2002 | 4,821 | 4,811 | 130,663 |
| Jul 2002 | 5,014 | 5,089 | 130,579 |
| Aug 2002 | 4,881 | 4,829 | 130,563 |
| Sep 2002 | 4,870 | 4,879 | 130,503 |
| Oct 2002 | 4,803 | 4,768 | 130,628 |
| Nov 2002 | 4,941 | 4,807 | 130,638 |
| Dec 2002 | 4,930 | 5,043 | 130,481 |
| Jan 2003 | 5,008 | 4,895 | 130,572 |
| Feb 2003 | 4,681 | 4,826 | 130,421 |
| Mar 2003 | 4,444 | 4,684 | 130,211 |
| Apr 2003 | 4,689 | 4,770 | 130,167 |
| May 2003 | 4,618 | 4,722 | 130,157 |
| Jun 2003 | 4,772 | 4,836 | 130,166 |
| Jul 2003 | 4,721 | 4,735 | 130,190 |
| Aug 2003 | 4,666 | 4,695 | 130,147 |
| Sep 2003 | 4,870 | 4,726 | 130,250 |
| Oct 2003 | 4,898 | 4,742 | 130,446 |
| Nov 2003 | 4,726 | 4,648 | 130,463 |
| Dec 2003 | 4,967 | 4,788 | 130,586 |
| Jan 2004 | 4,839 | 4,681 | 130,746 |
| Feb 2004 | 4,690 | 4,622 | 130,792 |
| Mar 2004 | 5,170 | 4,902 | 131,123 |
| Apr 2004 | 5,115 | 4,861 | 131,371 |
| May 2004 | 4,951 | 4,700 | 131,679 |
| Jun 2004 | 4,949 | 4,919 | 131,753 |
| Jul 2004 | 4,858 | 4,837 | 131,786 |
| Aug 2004 | 5,129 | 4,959 | 131,918 |
| Sep 2004 | 4,984 | 4,785 | 132,080 |
| Oct 2004 | 5,122 | 4,739 | 132,425 |
| Nov 2004 | 5,204 | 5,118 | 132,489 |
| Dec 2004 | 5,239 | 5,082 | 132,618 |
| Jan 2005 | 5,187 | 5,048 | 132,752 |
| Feb 2005 | 5,203 | 4,970 | 132,991 |
| Mar 2005 | 5,207 | 5,132 | 133,126 |
| Apr 2005 | 5,291 | 4,952 | 133,489 |
| May 2005 | 5,271 | 5,114 | 133,665 |
| Jun 2005 | 5,286 | 5,065 | 133,908 |
| Jul 2005 | 5,301 | 4,910 | 134,283 |
| Aug 2005 | 5,431 | 5,175 | 134,479 |
| Sep 2005 | 5,429 | 5,291 | 134,545 |
| Oct 2005 | 5,065 | 4,979 | 134,629 |
| Nov 2005 | 5,227 | 4,896 | 134,966 |
| Dec 2005 | 5,057 | 4,962 | 135,124 |
| Jan 2006 | 5,218 | 4,937 | 135,401 |
| Feb 2006 | 5,347 | 5,094 | 135,716 |
| Mar 2006 | 5,294 | 5,051 | 135,997 |
| Apr 2006 | 5,125 | 4,967 | 136,179 |
| May 2006 | 5,470 | 5,435 | 136,203 |
| Jun 2006 | 5,256 | 5,131 | 136,280 |
| Jul 2006 | 5,357 | 5,121 | 136,486 |
| Aug 2006 | 5,208 | 4,963 | 136,671 |
| Sep 2006 | 5,213 | 5,004 | 136,827 |
| Oct 2006 | 5,170 | 5,092 | 136,830 |
| Nov 2006 | 5,469 | 5,290 | 137,039 |
| Dec 2006 | 5,190 | 5,148 | 137,211 |
| Jan 2007 | 5,195 | 5,016 | 137,448 |
| Feb 2007 | 5,178 | 5,151 | 137,536 |
| Mar 2007 | 5,287 | 5,121 | 137,724 |
| Apr 2007 | 5,153 | 5,108 | 137,802 |
| May 2007 | 5,217 | 5,048 | 137,947 |
| Jun 2007 | 5,180 | 5,043 | 138,018 |
| Jul 2007 | 5,106 | 5,101 | 137,984 |
| Aug 2007 | 5,131 | 5,072 | 137,967 |
| Sep 2007 | 5,136 | 5,019 | 138,053 |
| Oct 2007 | 5,203 | 5,075 | 138,136 |
| Nov 2007 | 5,177 | 5,109 | 138,253 |
| Dec 2007 | 5,035 | 4,994 | 138,350 |
| Jan 2008 | 4,868 | 4,937 | 138,365 |
| Feb 2008 | 4,863 | 5,008 | 138,278 |
| Mar 2008 | 4,759 | 4,826 | 138,199 |
| Apr 2008 | 4,857 | 5,077 | 137,986 |
| May 2008 | 4,604 | 4,737 | 137,803 |
| Jun 2008 | 4,782 | 4,919 | 137,631 |
| Jul 2008 | 4,467 | 4,673 | 137,421 |
| Aug 2008 | 4,580 | 4,820 | 137,162 |
| Sep 2008 | 4,297 | 4,721 | 136,710 |
| Oct 2008 | 4,454 | 4,909 | 136,234 |
| Nov 2008 | 3,899 | 4,653 | 135,469 |
| Dec 2008 | 4,271 | 4,847 | 134,773 |
| Jan 2009 | 4,111 | 4,873 | 133,977 |
| Feb 2009 | 4,004 | 4,715 | 133,274 |
| Mar 2009 | 3,697 | 4,565 | 132,450 |
| Apr 2009 | 3,870 | 4,670 | 131,766 |
| May 2009 | 3,736 | 4,115 | 131,411 |
| Jun 2009 | 3,649 | 4,142 | 130,944 |
| Jul 2009 | 3,807 | 4,223 | 130,619 |
| Aug 2009 | 3,734 | 4,014 | 130,402 |
| Sep 2009 | 3,846 | 4,062 | 130,175 |
| Oct 2009 | 3,746 | 3,960 | 129,974 |
| Nov 2009 | 3,966 | 3,909 | 129,968 |
| Dec 2009 | 3,819 | 3,968 | 129,685 |
| Jan 2010 | 3,903 | 3,856 | 129,717 |
| Feb 2010 | 3,778 | 3,871 | 129,649 |
| Mar 2010 | 4,189 | 4,004 | 129,810 |
| Apr 2010 | 4,087 | 3,854 | 130,057 |
| May 2010 | 4,368 | 3,863 | 130,575 |
| Jun 2010 | 4,074 | 4,188 | 130,445 |
| Jul 2010 | 4,121 | 4,253 | 130,381 |
| Aug 2010 | 3,914 | 3,978 | 130,342 |
| Sep 2010 | 3,995 | 4,011 | 130,293 |
| Oct 2010 | 4,050 | 3,840 | 130,541 |
| Nov 2010 | 4,110 | 3,952 | 130,662 |
| Dec 2010 | 4,180 | 4,069 | 130,751 |
| Jan 2011 | 3,904 | 3,824 | 130,826 |
| Feb 2011 | 4,035 | 3,862 | 130,993 |
| Mar 2011 | 4,266 | 4,027 | 131,199 |
| Apr 2011 | 4,219 | 3,916 | 131,520 |
| May 2011 | 4,125 | 4,012 | 131,623 |
| Jun 2011 | 4,297 | 4,101 | 131,808 |
| Jul 2011 | 4,180 | 4,052 | 131,925 |
| Aug 2011 | 4,193 | 4,066 | 132,053 |
| Sep 2011 | 4,326 | 4,109 | 132,276 |
| Oct 2011 | 4,217 | 4,069 | 132,459 |
| Nov 2011 | 4,235 | 4,075 | 132,605 |
| Dec 2011 | 4,254 | 4,005 | 132,831 |
| Jan 2012 | 4,296 | 3,960 | 133,211 |
| Feb 2012 | 4,451 | 4,186 | 133,458 |
| Mar 2012 | 4,472 | 4,222 | 133,674 |
| Apr 2012 | 4,305 | 4,246 | 133,761 |
| May 2012 | 4,440 | 4,323 | 133,874 |
| Jun 2012 | 4,338 | 4,278 | 133,909 |
| Jul 2012 | 4,285 | 4,110 | 134,086 |
| Aug 2012 | 4,460 | 4,340 | 134,274 |
| Sep 2012 | 4,220 | 4,054 | 134,418 |
| Oct 2012 | 4,322 | 4,150 | 134,631 |
| Nov 2012 | 4,417 | 4,223 | 134,795 |
| Dec 2012 | 4,361 | 4,050 | 135,088 |
| Jan 2013 | 4,411 | 4,289 | 135,293 |
| Feb 2013 | 4,574 | 4,216 | 135,607 |
| Mar 2013 | 4,289 | 4,201 | 135,722 |
| Apr 2013 | 4,490 | 4,347 | 135,909 |
| May 2013 | 4,554 | 4,335 | 136,128 |
| Jun 2013 | 4,410 | 4,246 | 136,255 |
| Jul 2013 | 4,493 | 4,295 | 136,419 |
| Aug 2013 | 4,647 | 4,413 | 136,675 |
| Sep 2013 | 4,651 | 4,480 | 136,825 |
| Oct 2013 | 4,458 | 4,261 | 137,050 |
| Nov 2013 | 4,616 | 4,307 | 137,367 |
| Dec 2013 | 4,545 | 4,407 | 137,476 |
| Jan 2014 | 4,600 | 4,473 | 137,642 |
| Feb 2014 | 4,698 | 4,486 | 137,830 |
| Mar 2014 | 4,744 | 4,519 | 138,055 |
| Apr 2014 | 4,790 | 4,522 | 138,385 |
| May 2014 | 4,805 | 4,543 | 138,621 |
| Jun 2014 | 4,820 | 4,523 | 138,907 |
| Jul 2014 | 5,003 | 4,711 | 139,156 |
| Aug 2014 | 4,792 | 4,569 | 139,369 |
| Sep 2014 | 5,061 | 4,829 | 139,619 |
| Oct 2014 | 5,106 | 4,906 | 139,840 |
| Nov 2014 | 5,026 | 4,628 | 140,263 |
| Dec 2014 | 5,239 | 4,901 | 140,592 |
| Source: Job Openings and Labor Turnover Survey and Current Employment Statistics, U.S. Bureau of Labor Statistics. | |||
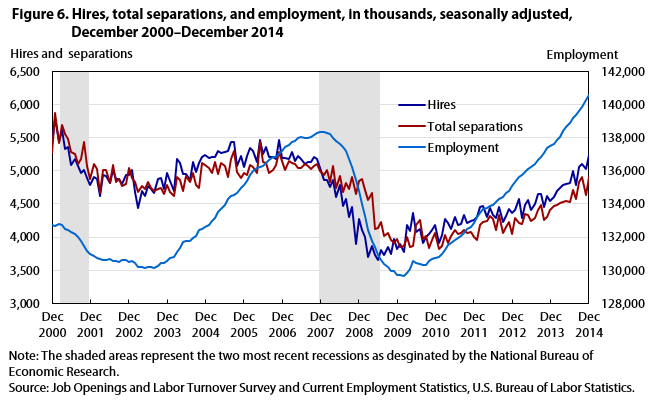
Analyzing hires and separations together offers a more complete picture of the economy than analyzing each data element separately. One advantage of this approach is that it allows an examination of employment change and gross worker flows. Employment change is derived by subtracting separations from hires. When hires are greater than separations, the employment level increases; when separations are greater than hires, the employment level decreases. This net employment change is known as gross worker flows. Figure 6 shows hires and separations graphically, alongside employment levels.
There were 55.5 million separations in 2014, an increase of 7.2 percent. This was the fifth straight year of growth for separations. (See table 3.) From January 2008 through November 2009, separations outpaced hires, resulting in negative gross worker flows. Since October 2010, there have been more hires than separations, resulting in positive gross worker flows. In 2014, there were 55.5 million separations and 58.7 million hires, matching the annual employment change of 3.2 million.8
| Industry and region | Annual level | Change from 2013 to 2014 | |||
|---|---|---|---|---|---|
| 2012 | 2013 | 2014 | Level | Percent | |
| Total | 50,047 | 51,783 | 55,524 | 3,741 | 7.2 |
| Total private | 46,545 | 48,280 | 51,992 | 3,712 | 7.7 |
| Mining and logging | 359 | 330 | 361 | 31 | 9.4 |
| Construction | 3,855 | 3,613 | 3,526 | -87 | -2.4 |
| Manufacturing | 2,808 | 2,776 | 2,899 | 123 | 4.4 |
| Durable goods | 1,648 | 1,649 | 1,643 | -6 | -.4 |
| Nondurable goods | 1,158 | 1,126 | 1,257 | 131 | 11.6 |
| Trade, transportation, and utilities | 10,067 | 10,592 | 12,184 | 1,592 | 15.0 |
| Wholesale trade | 1,467 | 1,363 | 1,654 | 291 | 21.3 |
| Retail trade | 6,832 | 7,420 | 8,525 | 1,105 | 14.9 |
| Transportation, warehousing, and utilities | 1,765 | 1,809 | 2,006 | 197 | 10.9 |
| Information | 781 | 802 | 883 | 81 | 10.1 |
| Financial activities | 2,092 | 2,320 | 2,194 | -126 | -5.4 |
| Finance and insurance | 1,351 | 1,535 | 1,469 | -66 | -4.3 |
| Real estate and rental and leasing | 739 | 783 | 728 | -55 | -7.0 |
| Professional and business services | 10,001 | 10,420 | 11,412 | 992 | 9.5 |
| Education and health services | 5,750 | 6,138 | 6,374 | 236 | 3.8 |
| Educational services | 862 | 863 | 903 | 40 | 4.6 |
| Health care and social assistance | 4,887 | 5,274 | 5,469 | 195 | 3.7 |
| Leisure and hospitality | 8,645 | 9,131 | 9,996 | 865 | 9.5 |
| Arts, entertainment, and recreation | 1,451 | 1,490 | 1,637 | 147 | 9.9 |
| Accommodation and food services | 7,193 | 7,641 | 8,360 | 719 | 9.4 |
| Other services | 2,191 | 2,158 | 2,165 | 7 | 0.3 |
| Government | 3,501 | 3,504 | 3,532 | 28 | 0.8 |
| Federal | 384 | 434 | 385 | -49 | -11.3 |
| State and local | 3,116 | 3,068 | 3,145 | 77 | 2.5 |
| Northeast | 8,233 | 8,441 | 8,772 | 331 | 3.9 |
| South | 19,759 | 20,295 | 22,049 | 1,754 | 8.6 |
| Midwest | 11,242 | 11,142 | 12,168 | 1,026 | 9.2 |
| West | 10,813 | 11,905 | 12,535 | 630 | 5.3 |
| Source: Job Openings and Labor Turnover Survey, U.S. Bureau of Labor Statistics. | |||||
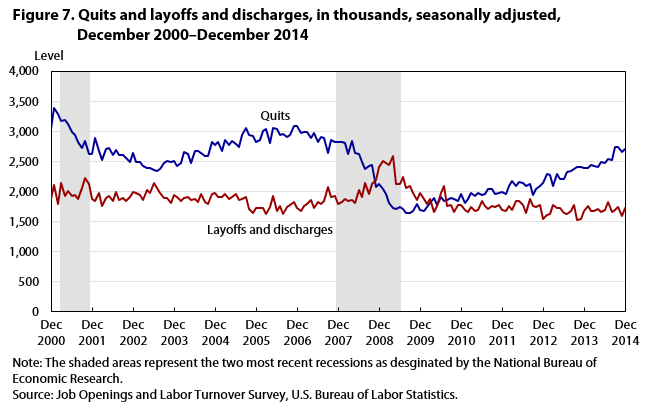
The types of separations offer a useful gauge of the existing economic climate. Quits are voluntary separations, and measure workers’ willingness or ability to leave the job. Layoffs and discharges are involuntary separations initiated by the employer. Other separations include retirements, transfers, disability, and deaths. Quits are procyclical, rising during an expansion and falling during a contraction. Conversely, layoffs and discharges are countercyclical, rising during a contraction and usually falling during an expansion. Due to population and employment growth, layoffs and discharges naturally increase over time. Cyclical effects usually outweigh underlying short-term layoffs and discharge growth. However, it is possible for layoffs and discharges to grow during an expansion. Rising layoffs and discharges, when exceeded by a larger rise in quits and total separations, is consistent with an economic expansion.
Hires usually outnumber total separations, but during the recession there were more separations than hires. This was due to both a cutback in hires and a surge in layoffs and discharges; the latter drove total separations higher even as quits declined. Other separations are a relatively small part of total separations, and are unlikely to influence any overall trend in total separations.
| Date | Quits | Layoffs and Discharges |
|---|---|---|
| Dec 2000 | 3,044 | 1,879 |
| Jan 2001 | 3,390 | 2,109 |
| Feb 2001 | 3,284 | 1,800 |
| Mar 2001 | 3,178 | 2,134 |
| Apr 2001 | 3,191 | 1,929 |
| May 2001 | 3,116 | 2,007 |
| Jun 2001 | 2,993 | 1,924 |
| Jul 2001 | 2,945 | 1,941 |
| Aug 2001 | 2,823 | 1,878 |
| Sep 2001 | 2,729 | 2,056 |
| Oct 2001 | 2,843 | 2,222 |
| Nov 2001 | 2,621 | 2,120 |
| Dec 2001 | 2,627 | 1,881 |
| Jan 2002 | 2,894 | 1,840 |
| Feb 2002 | 2,675 | 1,970 |
| Mar 2002 | 2,526 | 1,765 |
| Apr 2002 | 2,710 | 1,900 |
| May 2002 | 2,722 | 1,931 |
| Jun 2002 | 2,602 | 1,850 |
| Jul 2002 | 2,688 | 1,990 |
| Aug 2002 | 2,607 | 1,856 |
| Sep 2002 | 2,608 | 1,888 |
| Oct 2002 | 2,563 | 1,847 |
| Nov 2002 | 2,497 | 1,912 |
| Dec 2002 | 2,647 | 1,986 |
| Jan 2003 | 2,489 | 1,980 |
| Feb 2003 | 2,498 | 1,950 |
| Mar 2003 | 2,428 | 1,868 |
| Apr 2003 | 2,387 | 2,023 |
| May 2003 | 2,394 | 1,977 |
| Jun 2003 | 2,365 | 2,136 |
| Jul 2003 | 2,341 | 2,053 |
| Aug 2003 | 2,380 | 1,979 |
| Sep 2003 | 2,468 | 1,893 |
| Oct 2003 | 2,508 | 1,889 |
| Nov 2003 | 2,495 | 1,812 |
| Dec 2003 | 2,503 | 1,951 |
| Jan 2004 | 2,423 | 1,913 |
| Feb 2004 | 2,467 | 1,838 |
| Mar 2004 | 2,662 | 1,889 |
| Apr 2004 | 2,623 | 1,911 |
| May 2004 | 2,482 | 1,858 |
| Jun 2004 | 2,666 | 1,880 |
| Jul 2004 | 2,670 | 1,819 |
| Aug 2004 | 2,639 | 1,954 |
| Sep 2004 | 2,593 | 1,829 |
| Oct 2004 | 2,585 | 1,794 |
| Nov 2004 | 2,818 | 1,954 |
| Dec 2004 | 2,772 | 1,973 |
| Jan 2005 | 2,830 | 1,913 |
| Feb 2005 | 2,675 | 1,909 |
| Mar 2005 | 2,854 | 1,958 |
| Apr 2005 | 2,765 | 1,884 |
| May 2005 | 2,842 | 1,911 |
| Jun 2005 | 2,796 | 1,967 |
| Jul 2005 | 2,747 | 1,862 |
| Aug 2005 | 2,938 | 1,878 |
| Sep 2005 | 3,053 | 1,902 |
| Oct 2005 | 2,943 | 1,717 |
| Nov 2005 | 2,928 | 1,639 |
| Dec 2005 | 2,823 | 1,735 |
| Jan 2006 | 2,853 | 1,719 |
| Feb 2006 | 3,013 | 1,721 |
| Mar 2006 | 3,037 | 1,630 |
| Apr 2006 | 2,808 | 1,743 |
| May 2006 | 3,049 | 1,933 |
| Jun 2006 | 3,034 | 1,674 |
| Jul 2006 | 2,943 | 1,767 |
| Aug 2006 | 2,950 | 1,627 |
| Sep 2006 | 2,914 | 1,741 |
| Oct 2006 | 2,936 | 1,770 |
| Nov 2006 | 3,096 | 1,826 |
| Dec 2006 | 3,083 | 1,724 |
| Jan 2007 | 2,975 | 1,681 |
| Feb 2007 | 2,995 | 1,762 |
| Mar 2007 | 2,985 | 1,787 |
| Apr 2007 | 2,890 | 1,856 |
| May 2007 | 2,978 | 1,725 |
| Jun 2007 | 2,829 | 1,830 |
| Jul 2007 | 2,898 | 1,797 |
| Aug 2007 | 2,890 | 1,841 |
| Sep 2007 | 2,638 | 2,071 |
| Oct 2007 | 2,853 | 1,911 |
| Nov 2007 | 2,823 | 1,924 |
| Dec 2007 | 2,823 | 1,794 |
| Jan 2008 | 2,818 | 1,823 |
| Feb 2008 | 2,809 | 1,875 |
| Mar 2008 | 2,619 | 1,842 |
| Apr 2008 | 2,839 | 1,854 |
| May 2008 | 2,639 | 1,813 |
| Jun 2008 | 2,620 | 2,021 |
| Jul 2008 | 2,495 | 1,906 |
| Aug 2008 | 2,375 | 2,137 |
| Sep 2008 | 2,417 | 1,960 |
| Oct 2008 | 2,443 | 2,126 |
| Nov 2008 | 2,083 | 2,187 |
| Dec 2008 | 2,129 | 2,407 |
| Jan 2009 | 2,040 | 2,502 |
| Feb 2009 | 1,959 | 2,468 |
| Mar 2009 | 1,804 | 2,442 |
| Apr 2009 | 1,731 | 2,592 |
| May 2009 | 1,711 | 2,118 |
| Jun 2009 | 1,737 | 2,123 |
| Jul 2009 | 1,710 | 2,237 |
| Aug 2009 | 1,642 | 2,063 |
| Sep 2009 | 1,644 | 2,095 |
| Oct 2009 | 1,670 | 1,972 |
| Nov 2009 | 1,786 | 1,863 |
| Dec 2009 | 1,690 | 1,981 |
| Jan 2010 | 1,674 | 1,872 |
| Feb 2010 | 1,737 | 1,795 |
| Mar 2010 | 1,809 | 1,879 |
| Apr 2010 | 1,896 | 1,660 |
| May 2010 | 1,777 | 1,760 |
| Jun 2010 | 1,909 | 1,978 |
| Jul 2010 | 1,841 | 2,091 |
| Aug 2010 | 1,864 | 1,766 |
| Sep 2010 | 1,901 | 1,775 |
| Oct 2010 | 1,875 | 1,661 |
| Nov 2010 | 1,838 | 1,779 |
| Dec 2010 | 1,966 | 1,776 |
| Jan 2011 | 1,803 | 1,687 |
| Feb 2011 | 1,879 | 1,657 |
| Mar 2011 | 1,974 | 1,736 |
| Apr 2011 | 1,921 | 1,669 |
| May 2011 | 1,984 | 1,688 |
| Jun 2011 | 1,951 | 1,844 |
| Jul 2011 | 1,966 | 1,758 |
| Aug 2011 | 2,045 | 1,717 |
| Sep 2011 | 2,041 | 1,761 |
| Oct 2011 | 1,963 | 1,749 |
| Nov 2011 | 1,979 | 1,782 |
| Dec 2011 | 1,991 | 1,695 |
| Jan 2012 | 1,963 | 1,675 |
| Feb 2012 | 2,096 | 1,759 |
| Mar 2012 | 2,175 | 1,692 |
| Apr 2012 | 2,090 | 1,841 |
| May 2012 | 2,155 | 1,841 |
| Jun 2012 | 2,147 | 1,779 |
| Jul 2012 | 2,091 | 1,646 |
| Aug 2012 | 2,122 | 1,880 |
| Sep 2012 | 1,949 | 1,768 |
| Oct 2012 | 2,042 | 1,751 |
| Nov 2012 | 2,092 | 1,781 |
| Dec 2012 | 2,145 | 1,552 |
| Jan 2013 | 2,293 | 1,606 |
| Feb 2013 | 2,277 | 1,619 |
| Mar 2013 | 2,091 | 1,784 |
| Apr 2013 | 2,284 | 1,720 |
| May 2013 | 2,212 | 1,728 |
| Jun 2013 | 2,211 | 1,642 |
| Jul 2013 | 2,323 | 1,626 |
| Aug 2013 | 2,349 | 1,685 |
| Sep 2013 | 2,376 | 1,776 |
| Oct 2013 | 2,407 | 1,526 |
| Nov 2013 | 2,416 | 1,536 |
| Dec 2013 | 2,387 | 1,682 |
| Jan 2014 | 2,384 | 1,752 |
| Feb 2014 | 2,438 | 1,671 |
| Mar 2014 | 2,430 | 1,684 |
| Apr 2014 | 2,413 | 1,703 |
| May 2014 | 2,494 | 1,659 |
| Jun 2014 | 2,469 | 1,700 |
| Jul 2014 | 2,542 | 1,827 |
| Aug 2014 | 2,516 | 1,663 |
| Sep 2014 | 2,733 | 1,694 |
| Oct 2014 | 2,746 | 1,745 |
| Nov 2014 | 2,662 | 1,595 |
| Dec 2014 | 2,715 | 1,725 |
| Source: Job Openings and Labor Turnover Survey, U.S. Bureau of Labor Statistics. | ||
Quits generally account for a larger proportion of the total separations level than layoffs and discharges. The only year during the history of JOLTS in which there were more layoffs and discharges than quits was 2009. (See figure 7.) Since then, quits (as a percentage of total separations) have risen each year, while layoffs and discharges (as a percentage of total separations) have fallen each year. (See figure 8.) In 2014, quits made up 55 percent of total separations, while layoffs and discharges accounted for 37 percent. For quits, this was the largest contribution since 2007; for layoffs and discharges, it barely surpassed the 36 percent recorded in 2007.
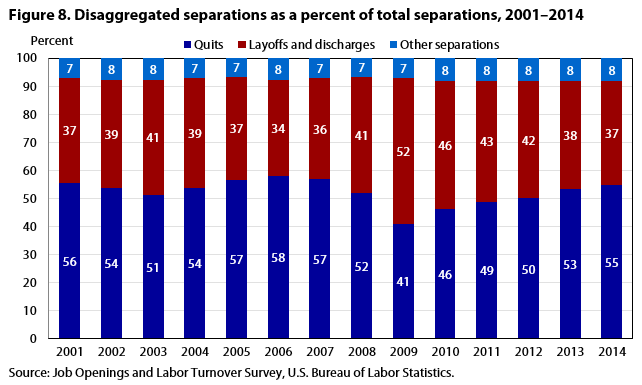
| Year | Quits | Layoffs and discharges | Other separations |
|---|---|---|---|
| 2001 | 55.6 | 37.4 | 7.0 |
| 2002 | 53.8 | 38.5 | 7.7 |
| 2003 | 51.2 | 41.2 | 7.5 |
| 2004 | 53.9 | 38.9 | 7.2 |
| 2005 | 56.6 | 36.8 | 6.6 |
| 2006 | 58.2 | 34.2 | 7.6 |
| 2007 | 56.8 | 36.1 | 7.1 |
| 2008 | 52.1 | 41.3 | 6.6 |
| 2009 | 41.1 | 51.7 | 7.1 |
| 2010 | 46.2 | 45.7 | 8.1 |
| 2011 | 48.8 | 43.1 | 8.1 |
| 2012 | 50.1 | 41.7 | 8.2 |
| 2013 | 53.4 | 38.4 | 8.2 |
| 2014 | 55.0 | 36.8 | 8.3 |
| Source: Job Openings and Labor Turnover Survey, U.S. Bureau of Labor Statistics. | |||
Quits
In 2014, quits grew for the fifth year in a row, increasing 10.4 percent, from 27.6 million to 30.5 million. It was the most quits in a single year since the start of the recession. The heaviest growth occurred during the latter half of the 2014. During the year, the quits level grew 0.6 percent in the first quarter, 1.7 in the second quarter, 5.6 percent in the third quarter, and 4.3 percent in the fourth quarter.
Quits grew in nearly all industries and in all regions in 2014. The largest over-the-year percent increase, 25.2 percent, occurred in wholesale trade. The finance and insurance industry and the federal government were the only two industries that declined, falling 2.7 percent and 6.0 percent respectively. In all four regions, quits increased by no less than 9 percent. (See table 4.)
| Industry and region | Annual level | Change from 2013 to 2014 | |||
|---|---|---|---|---|---|
| 2012 | 2013 | 2014 | Level | Percent | |
| Total | 25,074 | 27,636 | 30,522 | 2,886 | 10.4 |
| Total private | 23,530 | 26,079 | 28,842 | 2,763 | 10.6 |
| Mining and logging | 193 | 168 | 182 | 14 | 8.3 |
| Construction | 973 | 1,175 | 1,323 | 148 | 12.6 |
| Manufacturing | 1,294 | 1,318 | 1,450 | 132 | 10.0 |
| Durable goods | 710 | 746 | 798 | 52 | 7.0 |
| Nondurable goods | 584 | 576 | 652 | 76 | 13.2 |
| Trade, transportation, and utilities | 5,558 | 6,073 | 7,032 | 959 | 15.8 |
| Wholesale trade | 700 | 721 | 903 | 182 | 25.2 |
| Retail trade | 3,994 | 4,478 | 5,153 | 675 | 15.1 |
| Transportation, warehousing, and utilities | 864 | 873 | 976 | 103 | 11.8 |
| Information | 443 | 427 | 490 | 63 | 14.8 |
| Financial activities | 1,087 | 1,170 | 1,179 | 9 | 0.8 |
| Finance and insurance | 704 | 779 | 758 | -21 | -2.7 |
| Real estate and rental and leasing | 382 | 388 | 421 | 33 | 8.5 |
| Professional and business services | 4,384 | 5,269 | 5,614 | 345 | 6.5 |
| Education and health services | 3,304 | 3,621 | 3,856 | 235 | 6.5 |
| Educational services | 406 | 400 | 452 | 52 | 13.0 |
| Health care and social assistance | 2,895 | 3,222 | 3,402 | 180 | 5.6 |
| Leisure and hospitality | 5,223 | 5,698 | 6,468 | 770 | 13.5 |
| Arts, entertainment, and recreation | 530 | 574 | 607 | 33 | 5.7 |
| Accommodation and food services | 4,693 | 5,123 | 5,861 | 738 | 14.4 |
| Other services | 1,070 | 1,163 | 1,248 | 85 | 7.3 |
| Government | 1,545 | 1,557 | 1,679 | 122 | 7.8 |
| Federal | 130 | 133 | 125 | -8 | -6.0 |
| State and local | 1,416 | 1,423 | 1,555 | 132 | 9.3 |
| Northeast | 3,687 | 3,843 | 4,200 | 357 | 9.3 |
| South | 10,505 | 11,520 | 12,727 | 1,207 | 10.5 |
| Midwest | 5,651 | 6,195 | 6,817 | 622 | 10.0 |
| West | 5,230 | 6,077 | 6,778 | 701 | 11.5 |
| Source: Job Openings and Labor Turnover Survey, U.S. Bureau of Labor Statistics. | |||||
As of 2014, quits had not reached prerecession values in most industries. While some industries recovered fully to surpass 2007 values, overall, the annual quits level was 88 percent of its 2007 level. Educational services experienced the largest increase, 111 percent of its 2007 level. The transportation, warehousing, and utilities industry grew as well, reaching 109 percent of its 2007 level. The industry least recovered was federal government with an annual quits level of only 46 percent of its 2007 level. Finance and insurance, at 57 percent of its 2007 total, and both durable goods and nondurable goods manufacturing, at 57 and 60 percent respectively, have also lagged over this time period. No regional annual quits levels have recovered to 2007 levels. (See figure 9.)
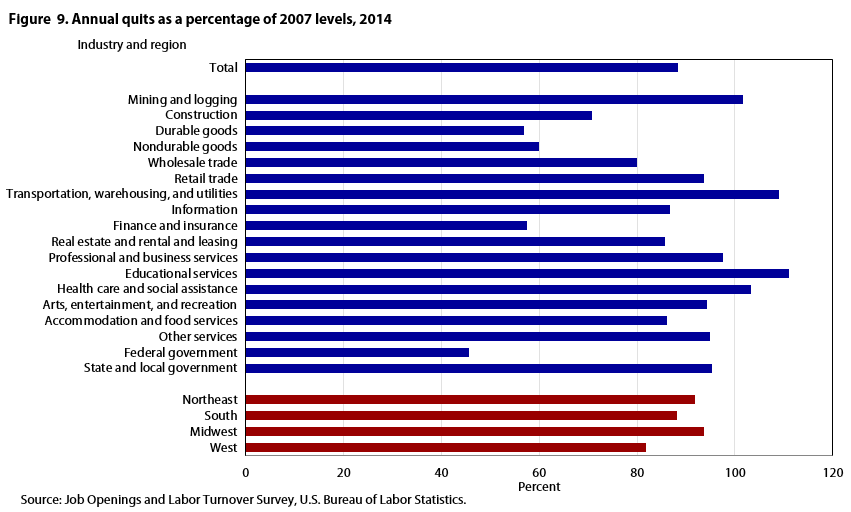
| Industry and region | Percentage |
|---|---|
| Total | 88 |
| Mining and logging | 102 |
| Construction | 71 |
| Durable goods | 57 |
| Nondurable goods | 60 |
| Wholesale trade | 80 |
| Retail trade | 94 |
| Transportation, warehousing, and utilities | 109 |
| Information | 87 |
| Finance and insurance | 57 |
| Real estate and rental and leasing | 86 |
| Professional and business services | 97 |
| Educational services | 111 |
| Health care and social assistance | 103 |
| Arts, entertainment, and recreation | 94 |
| Accommodation and food services | 86 |
| Other services | 95 |
| Federal government | 46 |
| State and local government | 95 |
| Northeast | 92 |
| South | 88 |
| Midwest | 94 |
| West | 82 |
| Source: Job Openings and Labor Turnover Survey, U.S. Bureau of Labor Statistics. | |
Layoffs and Discharges
In 2014, layoffs and discharges increased 2.7 percent, from 19.9 million to 20.4 million. Most of this growth occurred in the first quarter of the year; layoffs and discharges increased 7.7 percent in the first quarter, decreased 0.9 percent in the second quarter, increased 2.4 percent in the third quarter, and decreased 2.3 percent in the fourth quarter.
Across industries, changes in layoffs and discharges were far from uniform, increasing in half of industries and decreasing in the other half. The largest increase occurred in wholesale trade, which grew by 18.9 percent. Transportation, warehousing, and utilities experienced the next largest rate of growth, increasing by 17.0 percent. The heaviest decline in layoffs and discharges occurred in real estate and rental and leasing, which fell by 22.3 percent. (See table 5.)
| Industry and region | Annual level | Change from 2013 to 2014 | |||
|---|---|---|---|---|---|
| 2012 | 2013 | 2014 | Level | Percent | |
| Total | 20,872 | 19,889 | 20,418 | 529 | 2.7 |
| Total private | 19,686 | 18,725 | 19,347 | 622 | 3.3 |
| Mining and logging | 143 | 137 | 144 | 7 | 5.1 |
| Construction | 2,766 | 2,325 | 2,049 | -276 | -11.9 |
| Manufacturing | 1,252 | 1,191 | 1,163 | -28 | -2.4 |
| Durable goods | 778 | 743 | 679 | -64 | -8.6 |
| Nondurable goods | 473 | 444 | 483 | 39 | 8.8 |
| Trade, transportation, and utilities | 3,570 | 3,552 | 3,965 | 413 | 11.6 |
| Wholesale trade | 638 | 518 | 616 | 98 | 18.9 |
| Retail trade | 2,249 | 2,320 | 2,516 | 196 | 8.4 |
| Transportation, warehousing, and utilities | 685 | 713 | 834 | 121 | 17.0 |
| Information | 276 | 307 | 305 | -2 | -.7 |
| Financial activities | 625 | 716 | 650 | -66 | -9.2 |
| Finance and insurance | 339 | 406 | 411 | 5 | 1.2 |
| Real estate and rental and leasing | 286 | 309 | 240 | -69 | -22.3 |
| Professional and business services | 5,022 | 4,665 | 5,120 | 455 | 9.8 |
| Education and health services | 1,952 | 1,929 | 2,022 | 93 | 4.8 |
| Educational services | 390 | 407 | 393 | -14 | -3.4 |
| Health care and social assistance | 1,560 | 1,519 | 1,630 | 111 | 7.3 |
| Leisure and hospitality | 3,091 | 3,042 | 3,154 | 112 | 3.7 |
| Arts, entertainment, and recreation | 896 | 881 | 989 | 108 | 12.3 |
| Accommodation and food services | 2,193 | 2,161 | 2,163 | 2 | .1 |
| Other services | 998 | 865 | 777 | -88 | -10.2 |
| Government | 1,185 | 1,163 | 1,070 | -93 | -8.0 |
| Federal | 128 | 150 | 130 | -20 | -13.3 |
| State and local | 1,060 | 1,014 | 940 | -74 | -7.3 |
| Northeast | 3,753 | 3,745 | 3,742 | -3 | -.1 |
| South | 7,770 | 7,245 | 7,456 | 211 | 2.9 |
| Midwest | 4,645 | 4,015 | 4,431 | 416 | 10.4 |
| West | 4,701 | 4,884 | 4,791 | -93 | -1.9 |
| Source: Job Openings and Labor Turnover Survey, U.S. Bureau of Labor Statistics. | |||||
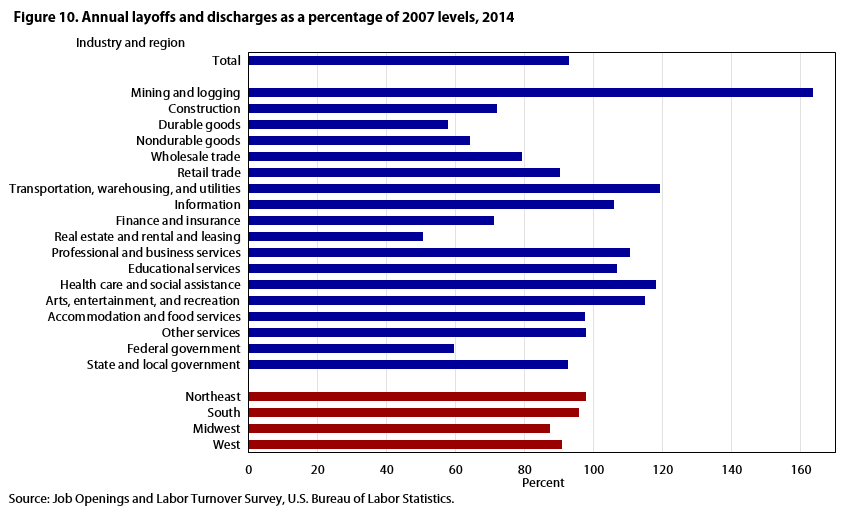
| Industry and region | Percentage |
|---|---|
| Total | 93 |
| Mining and logging | 164 |
| Construction | 72 |
| Durable goods | 58 |
| Nondurable goods | 64 |
| Wholesale trade | 79 |
| Retail trade | 90 |
| Transportation, warehousing, and utilities | 119 |
| Information | 106 |
| Finance and insurance | 71 |
| Real estate and rental and leasing | 50 |
| Professional and business services | 110 |
| Educational services | 107 |
| Health care and social assistance | 118 |
| Arts, entertainment, and recreation | 115 |
| Accommodation and food services | 98 |
| Other services | 98 |
| Federal government | 60 |
| State and local government | 93 |
| Northeast | 98 |
| South | 96 |
| Midwest | 87 |
| West | 91 |
| Source: Job Openings and Labor Turnover Survey, U.S. Bureau of Labor Statistics. | |
There were fewer layoffs and discharges than when the recession began, as the 2014 value held at 93 percent of the 2007 value. Additionally, all regions had fewer layoffs and discharges in 2014 than in 2007. Most industries experienced a decline, with the largest coming from real estate and rental and leasing, which reached only 50 percent of the 2007 total. A few industries surpassed their 2007 values; the mining and logging industry led standing at 164 percent of the 2007 value. (See figure 10.)
Other Separations
For the fifth consecutive year, other separations have increased. (See table 6.) In 2014, other separations grew by 7.6 percent, from 4.3 million to 4.6 million. That year, other separations were 106 percent of their 2007 level.
| Industry and region | Annual level | Change from 2013 to 2014 | |||
|---|---|---|---|---|---|
| 2012 | 2013 | 2014 | Level | Percent | |
| Total | 4,101 | 4,259 | 4,584 | 325 | 7.6 |
| Total private | 3,331 | 3,473 | 3,801 | 328 | 9.4 |
| Mining and logging | 21 | 25 | 34 | 9 | 36.0 |
| Construction | 119 | 113 | 154 | 41 | 36.3 |
| Manufacturing | 263 | 265 | 288 | 23 | 8.7 |
| Durable goods | 163 | 162 | 164 | 2 | 1.2 |
| Nondurable goods | 97 | 103 | 124 | 21 | 20.4 |
| Trade, transportation, and utilities | 938 | 969 | 1,187 | 218 | 22.5 |
| Wholesale trade | 127 | 124 | 137 | 13 | 10.5 |
| Retail trade | 592 | 625 | 854 | 229 | 36.6 |
| Transportation, warehousing, and utilities | 217 | 222 | 196 | -26 | -11.7 |
| Information | 65 | 68 | 89 | 21 | 30.9 |
| Financial activities | 376 | 432 | 364 | -68 | -15.7 |
| Finance and insurance | 305 | 349 | 298 | -51 | -14.6 |
| Real estate and rental and leasing | 73 | 83 | 67 | -16 | -19.3 |
| Professional and business services | 598 | 486 | 676 | 190 | 39.1 |
| Education and health services | 493 | 589 | 498 | -91 | -15.4 |
| Educational services | 65 | 56 | 60 | 4 | 7.1 |
| Health care and social assistance | 430 | 533 | 440 | -93 | -17.4 |
| Leisure and hospitality | 334 | 394 | 375 | -19 | -4.8 |
| Arts, entertainment, and recreation | 28 | 34 | 39 | 5 | 14.7 |
| Accommodation and food services | 305 | 357 | 332 | -25 | -7.0 |
| Other services | 122 | 129 | 141 | 12 | 9.3 |
| Government | 769 | 786 | 783 | -3 | -.4 |
| Federal | 127 | 155 | 130 | -25 | -16.1 |
| State and local | 642 | 633 | 649 | 16 | 2.5 |
| Northeast | 789 | 846 | 827 | -19 | -2.2 |
| South | 1,489 | 1,532 | 1,869 | 337 | 22.0 |
| Midwest | 945 | 932 | 919 | -13 | -1.4 |
| West | 876 | 945 | 969 | 24 | 2.5 |
| Source: Job Openings and Labor Turnover Survey, U.S. Bureau of Labor Statistics. | |||||
JOLTS data show a continuing resurgence in the labor market. The average job openings level has increased to its highest value since the series began, indicating increased demand for labor. Annual hires and quits levels, although not yet above prerecession levels, have steadily increased, so much so that many industries’ hires and quits levels now exceed prerecession values. This is likely indicative of increased confidence on the part of both employers and workers; the former being willing to make additional hires, the latter being assured enough of future prospects to leave their current positions. Layoffs and discharges have decreased as a percentage of total separations, due in part to employers’ increased confidence and in part to rising quits.
!--?pagebreak?-->!--?pagebreak?-->!--?pagebreak?-->!--?pagebreak?-->Kevin S. Dubina, "Job openings reach a new high, hires and quits also increase," Monthly Labor Review, U.S. Bureau of Labor Statistics, June 2015, https://doi.org/10.21916/mlr.2015.17
1The North American Industry Classification System (NAICS) is the standard used by Federal statistical agencies in classifying business establishments for the purpose of collecting, analyzing, and publishing statistical data related to the U.S. business economy. Out-of-scope NAICS industries are Agricultural establishments (NAICS 11), except logging (NAICS 1133), and Private households (NAICS 814110). For more information on the NAICS, see https://www.census.gov/eos/www/naics/.
2 The most detailed geographical breakout the JOLTS sample can provide by region is Northeast, South, Midwest, and West.
3 For Current Employment Statistics data on employment, see https://www.bls.gov/ces/.
4 For Current Population Survey data on unemployment, see https://www.bls.gov/cps/.
5 See Peter A. Diamond and Aysegül Sahin, “Shifts in the Beveridge Curve,” Federal Reserve Bank of New York
Staff Reports, No. 687 (August 2014), http://www.newyorkfed.org/research/staff_reports/sr687.pdf.
6 “European Social Statistics,” (Luxembourg: Publications Office of the European Union, 2013), page 164, http://ec.europa.eu/eurostat/documents/3930297/5968986/KS-FP-13-001-EN.PDF/.
7 See Sarah E. Needleman, “Skills Shortage Means Many Jobs Go Unfilled,” Wall Street Journal, July 9, 2014, http://www.wsj.com/articles/small-business-owners-work-to-fill-job-openings-1404940118, and Jason Faberman and Bhash Mazumder, “Is There a Skills Mismatch in the Labor Market?” Chicago Fed Letter, No. 300, July 2012,
https://www.chicagofed.org/publications/chicago-fed-letter/2012/july-300.
8 Slight differences between the JOLTS employment and employment levels are expected due to definitional differences https://www.bls.gov/jlt/joltsdivergenceinformation.pdf.