
An official website of the United States government
An official website of the United States government
The .gov means it's official.
Federal government websites often end in .gov or .mil. Before sharing sensitive information,
make sure you're on a federal government site.
The site is secure.
The
https:// ensures that you are connecting to the official website and that any
information you provide is encrypted and transmitted securely.
This article was corrected on January 6, 2016. In the last paragraph of the “Sector highlights” section, the word “nonagricultural” was removed because the data here refer to total wage and salary employment.
Crossref 0
The Reasonable Computer: Disrupting the Paradigm of Tort Liability, SSRN Electronic Journal , 2016.
Tobacco product use among workers in the construction industry, United States, 2014‐2016, American Journal of Industrial Medicine, 2018.
The Impact of Proposed Immigration Policy Changes on American Health Care Providers, SSRN Electronic Journal , 2017.
Adjusting the Measurement of the Output of the Medical Sector for Quality: A Review of the Literature, Medical Care Research and Review, 2017.
Work Values across Generations among Construction Professionals in the United States, Journal of Construction Engineering and Management, 2018.
Embodied and disembodied technological change: The sectoral patterns of job-creation and job-destruction, Research Policy, 2021.
The future for plasma science and technology, Plasma Processes and Polymers, 2019.
Effect of SCMs on heat transfer properties of LWAC, Journal of Thermal Analysis and Calorimetry, 2021.
Hospital workers: an assessment of occupational injuries and illnesses, Monthly Labor Review, 2017.
Service Job Displacement: A Task-Based Analysis of the Impact of Information Technology, SSRN Electronic Journal , 2017.
Manufacturing Masculinity: Exploring Gender and Workplace Surveillance, Work and Occupations, 2018.
Night Shift Among Women: Is It Associated With Difficulty Conceiving a First Birth?, Frontiers in Public Health, 2020.
Mixed Reality to Enable Construction Design Comprehension for Digital Natives, AEI 2019, 2019.
Toward a Realistic Simulation for Agricultural Robots, Agriculture Digitalization and Organic Production, 2022.
The Teaching of 21st Century Skills through Project-Based Learning and Professional Development for Career and Technical Education, University of North Texas, 2019.
A Fuzzy AHP Approach to IT-Based Stream Selection for Admission in Technical Institutions in India, Emerging Technologies in Data Mining and Information Security, 2019.
THE INNOVATION‐EMPLOYMENT NEXUS: A CRITICAL SURVEY OF THEORY AND EMPIRICS, Journal of Economic Surveys, 2018.
Does non-standard work mean non-standard health? Exploring links between non-standard work schedules, health behavior, and well-being, SSM - Population Health, 2018.
Examining Leadership within the Unique Context of Engineering Consulting, 2023 ASEE Annual Conference & Exposition Proceedings, 2023.
RETRACTED: A wisdom-based salesforce development model: the role of wisdom in salesforce training and well-being, Journal of Personal Selling & Sales Management, 2021.
Distributional consequences of surging housing rents, Journal of Economic Theory, 2021.
Occupational employment projections to 2024, Monthly Labor Review, 2015.
An Ergonomic Assessment of Hospital Linen Bag Handling, NEW SOLUTIONS: A Journal of Environmental and Occupational Health Policy, 2017.
The health care and social assistance sector will account for over a third of the nation’s projected job growth from 2014 to 2024. The construction industry is projected to have the largest industry increase in employment, but construction employment is not expected to reach prerecession levels by 2024. Consistent with its decline over the past 10-year period, manufacturing employment is projected to continue to fall.
With this set of biennial 10-year projections, the Bureau of Labor Statistics (BLS) presents a view of an economy that is returning to a more consistent growth path, but the growth is slower than the long-term trends that existed prior to the Great Recession. The combination of a slowing of population growth, a continuation of longstanding trends of decreasing labor force participation, and a lower unemployment rate will result in employment growth slightly stronger from 2014 to 2024 than it was from 2004 to 2014. The earlier period included a major recession; the growth rate for the later period is slower than the prerecession growth rate. The service-providing sectors will account for the majority of the projected job growth. Employment growth in the two largest service-producing sectors—health care and social assistance and professional and business services—will continue to be strong. In the goods-producing sectors, employment will be driven by growth in construction.
BLS projections focus on long-term trends. This focus is accomplished by making certain underlying assumptions. The most important is that the economy will be at or near full employment in the final year of the projection period. The projections do not account for any shocks that might cause the economy to fall into a recession or become overheated; shocks, such as political conflict or changes in taxes or laws, can significantly affect the economy. Within this context, this article looks at employment and output projections for North American Industry Classification System (NAICS) industries during the 2014–24 period. Major sectors—hereafter referred to as “sectors”—are an aggregate of individual industries. Because the projections are for a 10-year period, the article compares the projected changes with those that took place during the previous 10-year period.
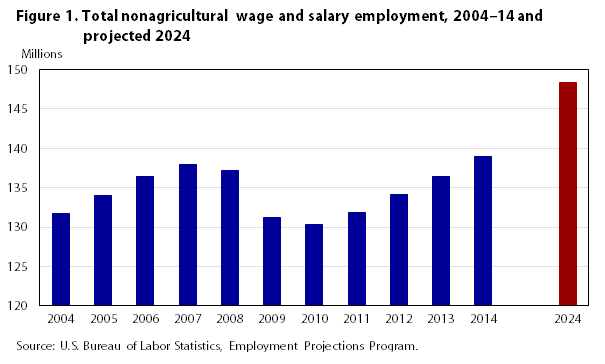
BLS projects that total employment1 in 2024 will reach 160.3 million, an increase from 2014 of almost 9.8 million jobs. This growth represents a 0.6-percent average annual rate of growth,2 which is faster than the 0.4-percent annual rate of growth experienced from 2004 to 2014. The majority of the increase in employment, over 95 percent, is among nonagricultural wage and salary workers. Their job count is projected to increase from 139.8 million in 2014 to 149.1 million in 2024, an increase of over 9.3 million jobs.3 This increase is larger than the more than 7.3 million that were added from 2004 to 2014. The 2014–24 increase, on average 0.6 percent per year, is projected to be larger than the 0.5-percent annual growth from 2004 to 2014. Agricultural workers are projected to lose 110,500 jobs—an annual decrease of 0.5 percent—from 2014 to 2024, bringing their employment level down to just over 2.0 million jobs. This decrease far exceeds the slight increase in agricultural jobs during the 2004–14 time frame. By the end of that period, agricultural jobs totaled over 2.1 million as 26,900 jobs had been added at an annual rate of 0.1 percent. Nonagricultural self-employed jobs are projected to increase from almost 8.6 million in 2014 to nearly 9.2 million in 2024. The increase of 579,300 jobs, occurring at an annual rate of 0.7 percent, is smaller than the decline of 883,400 in self-employment from 2004 to 2014. (See table 1.)
| Industry sector | Number of jobs (in thousands) | Change (in thousands) | Percent distribution | Annual rate of change(1) | ||||||
|---|---|---|---|---|---|---|---|---|---|---|
| 2004 | 2014 | 2024 | 2004–14 | 2014–24 | 2004 | 2014 | 2024 | 2004–14 | 2014–24 | |
| Total(2) | 144,047.0 | 150,539.9 | 160,328.8 | 6,492.9 | 9,788.9 | 100.0 | 100.0 | 100.0 | 0.4 | 0.6 |
| Nonagricultural wage and salary(3) | 132,462.2 | 139,811.5 | 149,131.6 | 7,349.3 | 9,320.1 | 92.0 | 92.9 | 93.0 | 0.5 | 0.6 |
| Goods-producing sectors, excluding agriculture | 21,815.3 | 19,170.5 | 19,227.0 | -2,644.8 | 56.5 | 15.1 | 12.7 | 12.0 | -1.3 | 0.0 |
| Mining | 523.2 | 843.8 | 924.0 | 320.6 | 80.2 | 0.4 | 0.6 | 0.6 | 4.9 | 0.9 |
| Construction | 6,976.2 | 6,138.4 | 6,928.8 | -837.8 | 790.4 | 4.8 | 4.1 | 4.3 | -1.3 | 1.2 |
| Manufacturing | 14,315.9 | 12,188.3 | 11,374.2 | -2,127.6 | -814.1 | 9.9 | 8.1 | 7.1 | -1.6 | -0.7 |
| Service-providing sectors | 110,646.9 | 120,641.0 | 129,904.6 | 9,994.1 | 9,263.6 | 76.8 | 80.1 | 81.0 | 0.9 | 0.7 |
| Utilities | 563.8 | 553.0 | 505.1 | -10.8 | -47.9 | 0.4 | 0.4 | 0.3 | -0.2 | -0.9 |
| Wholesale trade | 5,663.0 | 5,826.0 | 6,151.4 | 163.0 | 325.4 | 3.9 | 3.9 | 3.8 | 0.3 | 0.5 |
| Retail trade | 15,058.2 | 15,364.5 | 16,129.1 | 306.3 | 764.6 | 10.5 | 10.2 | 10.1 | 0.2 | 0.5 |
| Transportation and warehousing | 4,248.6 | 4,640.3 | 4,776.9 | 391.7 | 136.6 | 2.9 | 3.1 | 3.0 | 0.9 | 0.3 |
| Information | 3,118.3 | 2,739.7 | 2,712.6 | -378.6 | -27.1 | 2.2 | 1.8 | 1.7 | -1.3 | -0.1 |
| Financial activities | 8,105.1 | 7,979.5 | 8,486.7 | -125.6 | 507.2 | 5.6 | 5.3 | 5.3 | -0.2 | 0.6 |
| Professional and business services | 16,394.9 | 19,096.2 | 20,985.5 | 2,701.3 | 1,889.3 | 11.4 | 12.7 | 13.1 | 1.5 | 0.9 |
| Private educational services | 2,762.5 | 3,417.4 | 3,756.1 | 654.9 | 338.7 | 1.9 | 2.3 | 2.3 | 2.2 | 0.9 |
| Health care and social assistance | 14,429.8 | 18,057.4 | 21,852.2 | 3,627.6 | 3,794.8 | 10.0 | 12.0 | 13.6 | 2.3 | 1.9 |
| Leisure and hospitality | 12,493.1 | 14,710.0 | 15,651.2 | 2,216.9 | 941.2 | 8.7 | 9.8 | 9.8 | 1.6 | 0.6 |
| Other services | 6,188.3 | 6,394.0 | 6,662.0 | 205.7 | 268.0 | 4.3 | 4.2 | 4.2 | 0.3 | 0.4 |
| Federal government | 2,730.0 | 2,729.0 | 2,345.6 | -1.0 | -383.4 | 1.9 | 1.8 | 1.5 | 0.0 | -1.5 |
| State and local government | 18,891.3 | 19,134.0 | 19,890.1 | 242.7 | 756.1 | 13.1 | 12.7 | 12.4 | 0.1 | 0.4 |
| Agriculture, forestry, fishing, and hunting(4) | 2,111.3 | 2,138.3 | 2,027.7 | 26.9 | -110.5 | 1.5 | 1.4 | 1.3 | 0.1 | -0.5 |
| Agricultural wage and salary | 1,149.0 | 1,384.0 | 1,307.3 | 235.0 | -76.7 | 0.8 | 0.9 | 0.8 | 1.9 | -0.6 |
| Agricultural self-employed workers | 962.3 | 754.3 | 720.4 | -208.1 | -33.8 | 0.7 | 0.5 | 0.4 | -2.4 | -0.5 |
| Nonagricultural self-employed | 9,473.6 | 8,590.2 | 9,169.5 | -883.4 | 579.3 | 6.6 | 5.7 | 5.7 | -1.0 | 0.7 |
| Notes: (1) Ten-year compound average annual rate. (2) Employment data for wage and salary workers are from the BLS Current Employment Statistics survey, which counts jobs; data for self-employed people and agriculture, forestry, fishing, and hunting employment are from the Current Population Survey (household survey), which counts workers. (3) Includes wage and salary data from the Current Employment Statistics survey, except for data on private households, which are from the Current Population Survey. Logging workers are excluded. (4) Includes agriculture, forestry, fishing, and hunting data from the Current Population Survey, except for logging data, which are from Current Employment Statistics survey. Government wage and salary workers are excluded. Source: U.S. Bureau of Labor Statistics, Employment Projections Program. | ||||||||||
BLS projects that real output will increase from over $27.7 trillion in 2014 to almost $34.6 trillion in 2024.4 The more than $6.8 trillion increase, which took place at an annual rate of 2.2 percent, is larger than the 2004–14 increase of over $2.7 trillion, representing an annual rate of 1.0 percent. As with employment, the majority of the increase in real output is projected to come from nonagricultural sectors. The agricultural sectors (which also includes forestry, fishing, and hunting) are only projected to grow 1.9 percent annually during the 2014–24 period. However, this compares favorably with the 0.4-percent annual growth in the agricultural sector from 2004 to 2014. The rate for the agricultural sector is slower than the growth of output for the entire economy. (See table 2.)
| Industry sector | Billions of chained 2009 dollars | Annual rate of change(1) | Billions of dollars | Percent distribution | |||||||
|---|---|---|---|---|---|---|---|---|---|---|---|
| 2004 | 2014 | 2024 | 2004–14 | 2014–24 | 2004 | 2014 | 2024 | 2004 | 2014 | 2024 | |
| Total | 25,002.7 | 27,723.5 | 34,573.0 | 1.0 | 2.2 | 21,924.9 | 31,295.9 | 41,543.4 | 100.0 | 100.0 | 100.0 |
| Goods-producing sectors, excluding agriculture | 6,844.3 | 6,944.1 | 8,511.2 | 0.1 | 2.1 | 5,856.4 | 8,169.1 | 10,760.9 | 26.7 | 26.1 | 25.9 |
| Mining | 372.2 | 459.1 | 556.1 | 2.1 | 1.9 | 298.6 | 651.9 | 941.2 | 1.4 | 2.1 | 2.3 |
| Construction | 1,396.4 | 1,031.1 | 1,357.3 | -3.0 | 2.8 | 1,152.5 | 1,166.6 | 1,688.8 | 5.3 | 3.7 | 4.1 |
| Manufacturing | 5,095.6 | 5,446.3 | 6,586.7 | 0.7 | 1.9 | 4,405.3 | 6,350.5 | 8,131.0 | 20.1 | 20.3 | 19.6 |
| Service-providing sectors | 16,611.0 | 19,090.0 | 23,973.3 | 1.4 | 2.3 | 14,719.5 | 21,184.2 | 28,212.3 | 67.1 | 67.7 | 67.9 |
| Utilities | 432.1 | 372.6 | 445.5 | -1.5 | 1.8 | 349.6 | 400.4 | 514.8 | 1.6 | 1.3 | 1.2 |
| Wholesale trade | 1,202.9 | 1,362.9 | 1,754.4 | 1.3 | 2.6 | 1,023.0 | 1,538.6 | 2,062.6 | 4.7 | 4.9 | 5.0 |
| Retail trade | 1,318.9 | 1,427.4 | 1,893.2 | 0.8 | 2.9 | 1,185.5 | 1,560.5 | 2,124.2 | 5.4 | 5.0 | 5.1 |
| Transportation and warehousing | 785.1 | 859.6 | 1,075.6 | 0.9 | 2.3 | 687.6 | 1,031.3 | 1,409.3 | 3.1 | 3.3 | 3.4 |
| Information | 1,100.7 | 1,535.3 | 2,040.3 | 3.4 | 2.9 | 1,091.4 | 1,553.4 | 2,139.9 | 5.0 | 5.0 | 5.2 |
| Financial activities | 3,201.4 | 3,512.1 | 4,532.1 | 0.9 | 2.6 | 2,980.8 | 3,987.9 | 5,466.5 | 13.6 | 12.7 | 13.2 |
| Professional and business services | 2,317.5 | 3,036.3 | 3,832.8 | 2.7 | 2.4 | 2,109.5 | 3,335.0 | 4,537.2 | 9.6 | 10.7 | 10.9 |
| Private educational services | 249.2 | 266.6 | 327.4 | 0.7 | 2.1 | 184.9 | 327.7 | 449.9 | 0.8 | 1.0 | 1.1 |
| Health care and social assistance | 1,524.0 | 1,938.4 | 2,583.4 | 2.4 | 2.9 | 1,313.5 | 2,130.5 | 2,919.8 | 6.0 | 6.8 | 7.0 |
| Leisure and hospitality | 942.0 | 1,050.8 | 1,300.3 | 1.1 | 2.2 | 803.0 | 1,162.3 | 1,551.1 | 3.7 | 3.7 | 3.7 |
| Other services | 580.6 | 569.8 | 706.2 | -0.2 | 2.2 | 491.8 | 637.5 | 842.2 | 2.2 | 2.0 | 2.0 |
| Federal government | 932.7 | 1,037.4 | 1,025.3 | 1.1 | -0.1 | 803.7 | 1,133.1 | 1,200.3 | 3.7 | 3.6 | 2.9 |
| State and local government | 2,036.4 | 2,133.1 | 2,488.6 | 0.5 | 1.6 | 1,695.2 | 2,385.9 | 2,994.5 | 7.7 | 7.6 | 7.2 |
| Agriculture, forestry, fishing, and hunting | 342.5 | 356.8 | 431.0 | 0.4 | 1.9 | 320.2 | 511.9 | 660.8 | 1.5 | 1.6 | 1.6 |
| Special industries(2) | 1,175.3 | 1,318.4 | 1,649.4 | 1.2 | 2.3 | 1,028.8 | 1,430.8 | 1,909.4 | 4.7 | 4.6 | 4.6 |
| Residual(3) | 29.7 | 14.2 | 8.2 | NA | NA | NA | NA | NA | NA | NA | NA |
| Notes: (1) Ten-year compound average annual rate. (2) Consists of nonproducing accounting categories to reconcile the Bureau of Economic Analysis input–output system with national income and product accounts. (3) Residual is shown for the first level only. Because of chain weighting, subcategories do not necessarily add to higher categories. Source: U.S. Bureau of Labor Statistics, Employment Projections Program. | |||||||||||
Macroeconomic variables, such as labor force, gross domestic product (GDP) and its components, and labor productivity, affect the growth of total employment. BLS projects that GDP will grow from just under $16.1 trillion in 2014 to just over $19.9 trillion in 2024. The annual rate of growth is projected at 2.2 percent. The growth rate is larger than the 1.6-percent growth rate experienced from 2004 to 2014.5 The civilian labor force is projected to grow from 155.9 million in 2014 to 163.8 million in 2024, an increase of 7.9 million. The annual growth rate of the labor force, 0.5 percent, is slightly less than the 0.6 percent experienced from 2004 to 2014. The labor force participation rate is expected to fall annually by 0.3 percent from 2014 to 2024, primarily because of an aging population.6 Labor productivity, defined as output per labor hour, is projected to grow at an annual rate of 1.8 percent from 2014 to 2024, up from the 1.5-percent annual growth of the decade that began in 2004. These macro variables as well as the projections models for the individual industries determine the final projections of industry employment and output.7
Starting in 2011, nonfarm wage and salary employment began to rebound from the recession. By 2014, nonfarm wage and salary employment was larger than it had been before the recession or at any other time. Because of an expected decline in the labor force participation rate, among other variables, the number of nonfarm wage and salary workers is projected to grow more slowly than in projections for earlier time periods. Therefore, the projected number of total wage and salary jobs is lower than that for the previous projections period, 2012–22.8 (See figure 1.)
| Year | Employment (in millions) |
|---|---|
| 2004 | 131.7 |
| 2005 | 134.0 |
| 2006 | 136.4 |
| 2007 | 137.9 |
| 2008 | 137.2 |
| 2009 | 131.2 |
| 2010 | 130.3 |
| 2011 | 131.8 |
| 2012 | 134.1 |
| 2013 | 136.4 |
| 2014 | 139.0 |
| 2024 | 148.4 |
| Source: U.S. Bureau of Labor Statistics, Employment Projections Program. | |
The service-providing sectors are projected to add nearly 9.3 million jobs and reach just over 129.9 million jobs in 2024. This increase represents almost 95 percent of all the jobs added from 2014 to 2024. Employment in the service-providing sectors is expected to grow by 0.7 percent annually from 2014 to 2024, which is slightly faster than the 0.6-percent growth in jobs for the entire economy. This growth is slower than the 0.9-percent annual growth experienced from 2004 to 2014, a decade during which almost 10 million jobs were added. As with the last two sets of projections, the health care and social assistance sector is projected to have the largest growth, an increase of nearly 3.8 million jobs, and will reach almost 21.9 million jobs by 2024. The health care and social assistance sector is projected to grow at a 1.9-percent annual rate, which is more than 3 times faster than the overall annual growth of jobs in the entire economy. Nonetheless, this growth rate is below the 2.3-percent annual jobs growth rate that took place during the 2004–14 period for the health care and social assistance sector. (See table 1.)
Real output in the service-providing sectors is projected to grow at an annual rate of 2.3 percent from 2014 to 2024, which is faster than the 1.4-percent growth experienced from 2004 to 2014. The projected 2014–24 growth is about the same as the 2.2-percent growth the entire economy is expected to experience. All sectors in this group are projected to see growth in real output over the projections period with the exception of the federal government sector, which is projected to see a slight decline of 0.1 percent annually. (See table 2.)
The goods-producing sectors excluding agriculture are projected to increase by only 56,500 jobs over the 2014–24 period. Although small, this increase contrasts with a loss of more than 2.6 million jobs over the previous 10 years. Manufacturing, the largest sector in this group, is projected to post the largest decrease in jobs over the 2014–24 projection period. The rest of the sectors, including construction, are expected to have job increases over the projections period. (See table 1.)
Real output in the nonagricultural goods-producing sectors is projected to grow 2.1 percent per year from 2014 to 2024, which is slightly slower than the overall economy but much faster than the 0.1-percent growth experienced from 2004 to 2014. The construction sector is expected to experience 2.8-percent annual growth in output, nearly offsetting the 3.0-percent annual decline in output that occurred during the 2004–14 period. (See table 2.)
The agriculture, forestry, fishing, and hunting sector’s expected loss of 110,500 jobs from 2014 to 2024 results mainly from a decline of 76,700 wage and salary employees over the projections period. (See table 1.) Real output in the agriculture, forestry, fishing, and hunting sector, however, is projected to grow at an annual rate of 1.9 percent, which is faster than the 0.4-percent growth rate that took place over the 2004–14 period. (See table 2.)
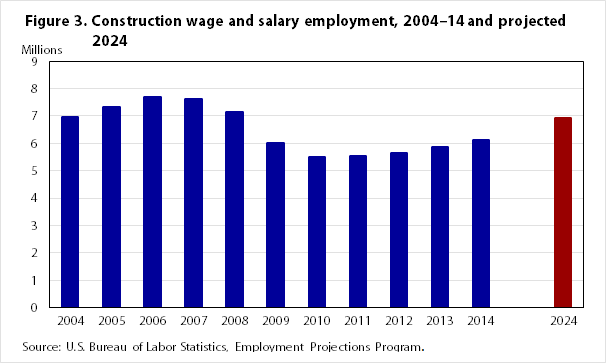
While the specific number of jobs is an important result from the projections process, the exact number depends on many outside influences that cannot be known at the time the projections are made. To better compare projected industry changes without focusing on the total job count, one can observe the changes in the percent distribution by sector of wage and salary employment. Analyzing such changes helps avoid the difficulty of trying to compare changes in industry job levels when a recession or other unexpected shock reduces or increases the total number of wage and salary jobs in the economy. Although the shocks themselves may shift employment—construction during the last recession is an example—looking at the percent distribution can mitigate this problem. Figure 2 illustrates the distribution of wage and salary jobs in 2004 and 2014 and the projected distribution for 2024. The health care and social assistance sector increased from 10.8 percent of all wage and salary jobs in 2004 to 12.8 percent in 2014 and is projected to increase to 14.5 percent by 2024. This increase is by far the largest for any sector from 2004 to 2024. Professional and business services also is projected to increase as a percentage of total wage and salary employment, growing from 13.5 percent in 2014 to 13.9 percent in 2024. This is slower than the growth from 12.3 percent in 2004 to 13.5 percent in 2014. Manufacturing fell from 10.7 percent of all wage and salary jobs in 2004 to just 8.6 percent in 2014 and is projected to fall even further, to 7.6 percent, by 2024. This decrease is by far the largest over the 2014–24 period.
| Sector | 2004 | 2014 | 2024 |
|---|---|---|---|
| Total wage and salary employment | 100.0 | 100.0 | 100.0 |
| Mining | 0.4 | 0.6 | 0.6 |
| Construction | 5.2 | 4.3 | 4.6 |
| Manufacturing | 10.7 | 8.6 | 7.6 |
| Utilities | 0.4 | 0.4 | 0.3 |
| Wholesale trade | 4.2 | 4.1 | 4.1 |
| Retail trade | 11.3 | 10.9 | 10.7 |
| Transportation and warehousing | 3.2 | 3.3 | 3.2 |
| Information | 2.3 | 1.9 | 1.8 |
| Financial activities | 6.1 | 5.7 | 5.6 |
| Professional and business services | 12.3 | 13.5 | 13.9 |
| Educational services | 2.1 | 2.4 | 2.5 |
| Health care and social assistance | 10.8 | 12.8 | 14.5 |
| Leisure and hospitality | 9.4 | 10.4 | 10.4 |
| Other services | 4.6 | 4.5 | 4.4 |
| Federal government | 2.0 | 1.9 | 1.6 |
| State and local government | 14.1 | 13.6 | 13.2 |
| Agricultural wage and salary | 0.9 | 1.0 | 0.9 |
| Source: U.S. Bureau of Labor Statistics, Employment Projections Program. | |||
Agriculture, forestry, fishing, and hunting. The agriculture, forestry, fishing, and hunting sector is projected to see a decline in employment of 110,500 jobs over the 2014–24 projections period; this decline negates the 26,900 job increase experienced from 2004 to 2014. The majority of the employment loss will be in wage and salary employment (down by 76,700), while 33,800 of the decline will be in self-employed jobs. In the 2004–14 period, there was an increase of 235,000 wage and salary jobs and a loss of 208,100 self-employed jobs. (See table 1.) The 2004–14 period included a recession as well as a movement away from self-employment in this sector because of a trend away from smaller farms and toward larger corporate-owned farms. This trend is expected to continue during the 2014–24 period.
While employment is projected to decline in the agriculture, forestry, fishing, and hunting sector, real output is projected to increase from $356.8 billion in 2014 to $431.0 billion in 2024. This 1.9-percent annual growth is faster than the 0.4-percent growth that occurred from 2004 to 2014. (See table 2.) Expected higher levels of income, both domestic and foreign, will drive the increased demand for food and agricultural products. The higher demand for agricultural products in developing countries will lead to an increase in American exports of agricultural goods. Higher foreign demand for U.S. agricultural products, coupled with lower costs of production because of lower feed costs, will account for the expected higher production within this sector.9
Mining. Jobs in the mining sector are expected to increase by 80,200 during the 2014–24 period to reach an employment level of 924,000. This increase is much lower than the 320,600 jobs that were added in the 10-year period that ended in 2014. (See table 1.) Fracking and the rebound in construction will boost employment, but mining job growth will be muted by uncertainty regarding future oil prices. The price of oil is expected to grow 0.7 percent a year from 2014 to 2024, down from the 8.4-percent annual growth that was experienced from 2004 to 2014.10 In the past, a decline in the price of oil would have been accompanied by a decrease in oil production. However, despite the price drop of the past few years, a production decrease has not occurred. A large reason is the difference in fracking versus traditional oil wells. Although traditional oil wells are drilled until no more oil exists, wells used for fracking tend to produce substantial amounts in their early years but die younger than traditional oil wells. Production is then moved to a new well. With fracking, production more easily can be stopped if the price of oil drops and then can be picked back up when supply decreases enough to increase the price of oil.11 Also, newer technology in fracking allows drilling to take place on older wells. Because fewer people are required to run the wells that aren’t new, production can increase while employment decreases.
Real output in the mining sector is projected to grow 1.9 percent a year from 2014 to 2024 to reach $556.1 billion. This is slower than the 2.1-percent annual growth that was experienced from 2004 to 2014. (See table 2.) Real output growth will be driven by the 5-percent annual growth in the price of natural gas during the decade ending in 2024.12 Increasing use of horizontal drilling, hydraulic fracturing, and offshore exploration because of growing demand will increase production in this sector.
| Year | Employment (in millions) |
|---|---|
| 2004 | 6.98 |
| 2005 | 7.34 |
| 2006 | 7.69 |
| 2007 | 7.63 |
| 2008 | 7.16 |
| 2009 | 6.02 |
| 2010 | 5.52 |
| 2011 | 5.53 |
| 2012 | 5.65 |
| 2013 | 5.86 |
| 2014 | 6.14 |
| 2024 | 6.93 |
| Source: U.S. Bureau of Labor Statistics, Employment Projections Program. | |
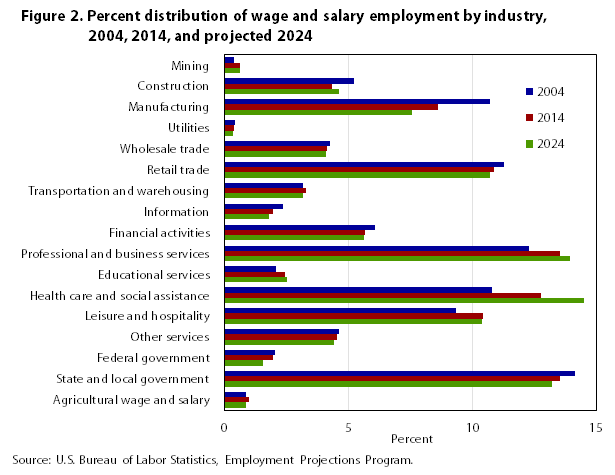
Construction. Employment in the construction sector has not totally recovered from the loss of jobs during the last recession. (See figure 3.) Although construction is projected to add 790,400 jobs from 2014 to 2024 to reach more than 6.9 million, the projected increase does not make up for the 837,800 jobs that were lost during the 2004–14 period. Therefore, the projected employment level is still below the 2004 employment level. Nonetheless, construction is projected to add the majority of jobs in the goods-producing sectors. (See table 1.)
Real output in the construction sector is projected to grow 2.8 percent annually from 2014 to 2024 to reach just under $1.4 billion. This growth in output almost makes up for the annual decline of 3.0 percent that occurred during the 2004–14 period. Real output, like employment, has not returned to prerecession levels and is not expected to reach prerecession levels by 2024. Construction is projected to be the fastest growing of all of the goods-producing sectors in terms of output and grow faster than the economy as a whole. Construction is expected to be the fourth fastest growing sector. (See table 2.)
Growth in employment and real output in the construction sector will be driven by the growth in both residential and nonresidential investment. Residential investment is projected to increase from $496.1 billion in 2014 to $710.6 billion in 2024. The annual 3.7-percent growth of residential investment is a reversal from the annual decline of 4.9 percent—mostly due to the recession—that was experienced during the 2004–14 period. Like construction, projected residential investment is below the 2004 value and is not projected to reach prerecession levels by 2024. Nonresidential investment in structures is projected to grow by 3.0 percent annually to reach $610.6 billion by 2024. This is faster than the 1.0-percent annual growth experienced 2004–14. Unlike residential investment, nonresidential investment is projected to surpass the prerecession levels by 2024.13
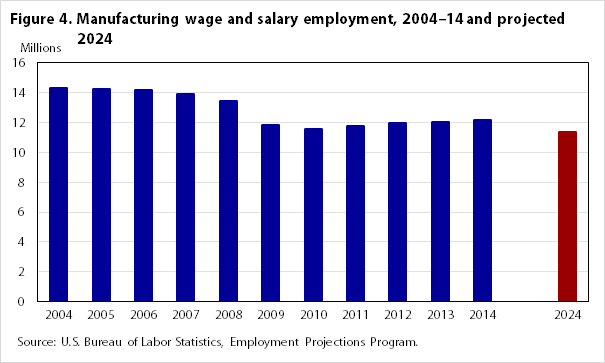
Manufacturing. The manufacturing sector is projected to experience the largest employment loss of any sector. A projected loss of 814,100 jobs from 2014 to 2024 would reduce manufacturing employment to just under 11.4 million. While the loss is large, it is less than 40 percent of the loss that was experienced from 2004 to 2014, when more than 2.1 million manufacturing jobs were lost. The annual decline of 0.7 percent over the current projections period is less than the 1.6-percent annual decline that occurred from 2004 to 2014. (See table 1.)
| Year | Employment (in millions) |
|---|---|
| 2004 | 14.32 |
| 2005 | 14.23 |
| 2006 | 14.16 |
| 2007 | 13.88 |
| 2008 | 13.41 |
| 2009 | 11.85 |
| 2010 | 11.53 |
| 2011 | 11.73 |
| 2012 | 11.93 |
| 2013 | 12.02 |
| 2014 | 12.19 |
| 2024 | 11.37 |
| Source: U.S. Bureau of Labor Statistics, Employment Projections Program. | |
The improvement within the manufacturing sector appears to be cyclical rather than structural in nature given that the number of manufacturing jobs is still well below the prerecession levels despite a slight recovery in the last few years. (See figure 4.) . While some jobs are coming back to the United States—a process known as “reshoring”—others are still being sent overseas.14 The addition of jobs that are returning is not enough to stem the loss of jobs. Also, because only a small portion of most manufacturing costs are energy costs, the increased use of shale gas does not appear to have spurred much growth in manufacturing.15
One factor contributing to the loss in jobs in manufacturing is a change in the skills requirements for manufacturing jobs. In the past, many manufacturing jobs were considered low skill and had fewer educational requirements than other types of jobs. Over the last few decades, manufacturing plants have become more automated, thus requiring skills that are more technical. For example, computer programmers and coders are needed by manufacturers, as are people to design and run the machines. These jobs require different skills from previous jobs in manufacturing and usually require a higher level of education.16 The jobs in manufacturing tend to be computer based rather than assembly-line based.
Some firms have begun using what is known as “contract manufacturing.” This involves finding other firms whose specialized skills enable them to produce the goods faster and more efficiently. Not having to retrain employees on new equipment and processes or teach them new skills will decrease the turnaround time for the production of goods and increase the quality.17 A decrease in communication costs—for example, lower costs for telephone calls and video conferences—allows contract manufacturing to take place globally, meaning that some research and development, as well as some engineering services, can now be done through outsourcing.
Another reason for the loss of jobs in the manufacturing sector is the continued increased use of technology. Jobs, such as welding, that were once done by people are now being done by computers or robots, and their use is expected to increase.18
Although manufacturing employment is projected to fall, real output in the manufacturing sector is expected to grow 1.9 percent annually to reach almost $6.6 billion in 2024, up from over $5.4 billion in 2014. The growth rate is faster than the 0.7-percent annual increase in real output experienced during the 2004–14 period, with real output in 2024 projected to be higher than it has ever been in the manufacturing sector. Increased productivity—because of automation, contract manufacturing, and a more efficient manufacturing process in most industries—will lead to more real output with fewer employees required. (See table 2.)
Utilities. The number of jobs in the utility sector is projected to fall by 47,900 to reach 505,100 in 2024. This is over 4 times the number of jobs lost from 2004 to 2014, a decade in which 10,800 jobs were lost. The utility sector is one of only three service-providing sectors (information and federal government being the others) that are projected to see a decline in employment from 2014 to 2024. (See table 1.)
Real output in the utility sector is projected to grow 1.8 percent annually, which represents an increase of $72.9 billion, to reach $445.5 billion in 2024. The growth in real output more than makes up for the decrease that was experienced from 2004 to 2014, when real output fell from $432.1 billion to $372.6 billion, an annual decline of 1.5 percent. (See table 2.) Real output levels in 2024 are projected to be above prerecession levels. Newer technology will create a more productive workforce; hence, real output is projected to increase while the number of employees needed to produce that output will decline.
Wholesale trade. Employment in the wholesale trade sector is projected to grow 0.5 percent annually from 2014 to 2024 to reach almost 6.2 million jobs. This growth is faster than the 0.3-percent growth seen over the 2004–14 period. The projected increase of 325,400 jobs from 2014 to 2024 is nearly double the 163,000 jobs that were added in the previous 10-year period. (See table 1.)
The 2.6-percent annual growth of real output for the wholesale trade sector over the 2014–24 period is faster than that for the overall economy and also faster than the 1.3-percent growth that occurred during the prior 10-year period. (See table 2.) The overall increase in output in the economy will drive the increased demand for wholesale services. Wholesale trade services are in the supply chain of many other sectors, such as manufacturing, retail trade, and health care and social assistance. Because demand for goods in these sectors has increased, so will demand for wholesale trade services.19
Retail trade. The number of jobs in the retail trade sector is projected to increase from just under 15.4 million in 2014 to just over 16.1 million in 2024, an annual growth rate of 0.5 percent, compared with an annual growth rate of 0.2 percent during the previous decade. The 764,600 jobs projected to be added are more than double the 306,300 jobs that were added from 2004 to 2014. (See table 1.) The increased use of online shopping and self-checkout will mean that the need for certain jobs within the retail sector will not be as great as it was in the past.
The projected annual growth rate of 2.9 percent for real output in the retail trade sector over the 2014–24 period is faster than the 0.8-percent annual growth of the 2004–14 period. (See table 2.) The increase in employment and real output in the retail trade sector is being driven by the increase in personal consumption expenditures, which are projected to increase from almost $11.0 trillion to just under $13.9 trillion from 2014 to 2024. The annual growth of 2.4 percent over the projections period is faster than the 1.8-percent growth in real output that took place over the 2004–14 period.20
Transportation and warehousing. The transportation and warehousing sector is projected to post an increase in employment of 136,600, bringing the employment level to nearly 4.8 million jobs in 2024. This increase is less than the 391,700 jobs that were added from 2004 to 2014. The annual employment growth of 0.3 percent over the projections period is half that of the entire economy and slower than the 0.9-percent transportation and warehousing sector growth experienced during the previous 10-year period. (See table 1.)
Transportation and warehousing employment is projected to grow more slowly than the entire economy over the projections period. However, the sector’s real output is projected to grow 2.3 percent annually, which is slightly faster than the entire economy, and is expected to reach almost $1.1 trillion by 2024. This also is faster than the 0.9-percent growth that occurred over the 2004–14 period. (See table 2.)
Information. Employment in the information sector is projected to fall by 27,100 jobs from 2014 to 2024 to 2.7 million jobs. The decline is smaller than the loss of 378,700 jobs that occurred during the 2004–14 period. (See table 1.) This sector is one of three sectors—utilities and federal government are the others—that are projected to lose jobs over the current projections period. Much of the information sector’s job loss can be explained by technological changes that require fewer people, such as less print publishing of newspapers and phonebooks and more web publishing of these services. Also, a movement toward digital subscriptions rather than print subscriptions is illustrated by a fall in total circulation for newspapers.21 Similarly, wireless and satellite communication has been replacing wired communication. As of 2013, more than 40 percent of U.S. households have only cellular phones and no longer use landlines.22
While employment in the information sector is projected to fall slightly, real output is projected to grow annually at 2.9 percent to reach just over $2.0 trillion in 2024. This is faster than the growth of the entire economy but slower than the 3.4-percent growth the information sector experienced from 2004 to 2014. (See table 2.) The increased need for network security, cloud computing, high-speed Internet, and increased performance are driving the rise in the sector’s real output. Because of the new technology they can use, fewer people are required to maintain current systems. Much infrastructure has been put in place for industries within this sector, meaning that fewer workers are needed, but output will continue to grow.
Financial activities. The number of jobs in the financial activities sector is projected to increase by 507,200 to reach just under 8.5 million jobs in 2024; this reflects an annual growth rate of 0.6 percent. This increase in jobs more than makes up for the sector’s 125,600 jobs that were lost from 2004 to 2014. (See table 1.) The increase in jobs in the financial activities sector will be driven by the increased need for retirement planning, the increase in housing starts, and the Affordable Care Act, as discussed below.
As the economy has recovered from the recession and many people are approaching retirement as well as seeking retirement advice, there will be a greater need for people to work in the financial activities sectors. The Census Bureau projects that by the year 2024, there will be 102.9 million people over the age of 55, which is up from 84.7 million in 2014. By 2024, people over the age of 55 will make up 38.2 percent of the population.23
The rebound in the construction sector will drive not only both residential and nonresidential investment but also housing starts, which are projected to reach over 1.6 million in 2024, up from 1 million in 2014. Although this number is still well below the over 1.9 million housing starts in 2004 during the housing boom, housing starts will drive employment in the real estate sectors.24
The Affordable Healthcare Act, whose open enrollment in health insurance exchanges began in October 2013, is expected to increase the need for agents who are familiar with health care insurance options. The aging population will increase the need for not only health care insurance but also long-term care insurance.
Real output in financial activities is projected to grow annually at 2.6 percent during the 2014–24 period. This is up from the 0.9-percent annual growth that was experienced during the 2004–14 period as this sector continues to rebound from the most recent recession. (See table 2.) The rebound in the real estate market, people taking more control over their retirement, and the increased access to insurance will drive the real output growth in this sector.
Professional and business services. Employment in the professional and business services sector is projected to increase from just under 19.1 million jobs in 2014 to just under 21 million jobs in 2024. The increase of almost 1.9 million jobs is the second largest of any sector (behind only health care and social assistance) over the projections period. Although the number of jobs projected to be added is large, it is still less than the 2.7 million jobs that were added in this sector from 2004 to 2014. (See table 1.) Much of the growth in jobs in this sector is being driven by the short-term use of contract workers or consultants rather than the use of full-time employees. This lowers the cost for firms because these short-term employees are hired for specific jobs and are able to keep up with new regulations and newer technology more easily than full-time employees. This will be helpful given the movement toward electronic recordkeeping of, for instance, health records.
The professional and business services output is projected to grow by 2.4 percent annually over the projections period. This is faster than the overall economy but slower than the 2.7-percent annual growth that took place over the 2004–14 period. (See table 2.) The need for more network and computer security because of increased data breaches, newer mobile technologies, and custom programming services will drive the increase in real output in this sector.
Private education. Employment in the private education sector is projected to increase by 338,700 jobs to reach just under 3.8 million jobs in 2024. This is about half the number of jobs that were added from 2004 to 2014. The job growth in this sector, 0.9 percent annually over the current projections period, is expected to be faster than that of the overall economy but less than the 2.2 percent annually that occurred during the previous 10 years. (See table 1.) The driving factor is projected to be a rise in the number of students enrolled in postsecondary education, as both the number of people returning to school to gain new skills and the college-age population increase.25
The private education services sector is projected to experience an annual growth in real output of 2.1 percent. This is higher than the 0.7-percent annual growth that was experienced in the 2004–14 period. Increased enrollment in colleges and professional schools, by both full-time and part-time students, will drive the demand for educational services.26
Health care and social assistance. The health care and social assistance sector is projected to add almost 3.8 million jobs from 2014 to 2024. This is up from the over 3.6 million jobs that were added from 2004 to 2014. The projected job growth accounts for over a third of the U.S. economy’s entire job growth over the projections period. The annual growth rate of 1.9 percent is 3 times faster than the entire economy but is slower than the 2.3-percent annual growth that occurred from 2004 to 2014. This sector will both add more jobs and grow faster than any other sector. (See table 1.) The number of insured people is expected to increase over the projections period, leading to an increased demand for the services offered by all types of health care providers.27 Also, the aging population will require more health care providers, and the movement away from long-term facilities to more home health care will increase employment in some health care and social assistance industries.28 With more people having access to insurance, a shift away from hospital care to physicians’ offices and clinical services will occur, as fewer people will use the emergency room for their primary care.29
Real output in the health care and social assistance sector is projected to grow annually at 2.9 percent from 2014 to 2024. This is faster than the 2.4-percent annual growth that took place over the 2004–14 period. Like employment, real-output growth in this sector is projected to be faster than that of the entire economy. (See table 2.) Health spending is projected to be 19.6 percent of GDP by 2024; this spending is up from 17.4 percent today.30 The aging of the population will lead to higher demand for all types of health care services from hospitals to short-term and long-term facilities, home health care, physicians, pharmacies, and clinical services.31
Leisure and hospitality. Employment in the leisure and hospitality sector is projected to increase from 14.7 million in 2014 to almost 15.7 million in 2024 as the sector grows at an annual rate of 0.6 percent. The increase of 941,200 jobs is substantially less than the 2.2 million jobs that were added from 2004 to 2014. (See table 1.) The slower growth in employment in this sector can be attributed to the increasing use of electronic means of communication, such as that used when ordering food at a restaurant or booking hotel rooms online.
Real output in the leisure and hospitality sector is projected to grow 2.2 percent annually, the same as the entire economy, from 2014 to 2024. This is faster than the 1.1-percent annual growth seen in the previous 10-year period. This sector appears to have recovered fully from the last recession, during which it was greatly affected. (See table 2.)
Other services. The “other services” sector is projected to see an increase of 268,000 jobs over the 2014–24 period. This is up slightly from the 205,700 jobs that were added in the 2004–14 period. The projected annual 0.4-percent growth of jobs is slightly larger than the 0.3-percent annual growth of the previous decade but is still slower than that for the entire economy. (See table 1.)
Real output of the other services sector is projected to grow annually 2.2 percent over the projections period, which is the same rate as for the overall economy. In contrast, during the previous 10-year period, the sector’s annual output declined 0.2 percent. (See table 2.)
Federal government. Continued pressure for cuts in government spending will have a major effect on employment in the federal government sector. The number of federal government jobs is projected to fall by 383,400 from 2014 to 2024 to reach just over 2.3 million jobs. (See table 1.) This is one of only three sectors among the service-providing sectors that are projected to experience a decrease in employment. The annual federal government employment decline of 1.5 percent is by far the largest decline of any sector in the economy. In addition to cuts in government spending, the reduced consumer and business use of the Postal Service will contribute to the decline in employment in this sector.
The federal government is projected to experience an annual output decline of 0.1 percent over the 2014–24 period. This contrasts with the 1.1-percent annual growth experienced from 2004 to 2014. The federal government sector is the only sector projected to see a decrease in real output over the 2014–24 period. (See table 2.) The projected reduction in output is due to continued pressure to reduce budget deficits and curtail government programs.
State and local government. During the 2014–24 period, the state and local government sector is projected to add 756,100 jobs—the sixth largest number among all the sectors—to reach almost 19.9 million. This is more than 3 times the number of jobs added in the previous 10-year period. (See table 1.) The increased need for educational services because of higher enrollments in postsecondary education will drive most of the employment growth in this sector.32
The 1.6-percent projected annual growth of real output in the state and local government sector over the 2014–24 period is faster than the 0.5-percent growth that occurred during the previous 10-year period. (See table 2.) The projected growth rate, however, is still less than that of the entire economy. Much like the growth in employment, a large part of the growth in output is due to education, but another large part is due to state and local services that will be compensating for lost federal services.
The health care and social assistance sector is the fastest growing sector. It has not only the 5 fastest growing industries but also 9 of the 20 fastest growing industries. (See table 3.) Because of the movement away from long-term hospitalization and long-term care facilities, the home health care services industry is the fastest growing industry over the 2014–24 projections period, growing annually at 4.8 percent.33 Home health care allows people to remain in their own homes and maintain some sort of independence while receiving the daily care that they require.
| Industry description | Sector | 2012 NAICS code | Number of jobs (in thousands) | Change (in thousands) | Annual rate of change | |
|---|---|---|---|---|---|---|
| 2014 | 2024 | 2014–24 | 2014–24 | |||
| Fastest growing | ||||||
| Home health care services | Health care and social assistance | 6216 | 1,262.2 | 2,022.6 | 760.4 | 4.8 |
| Outpatient care centers | Health care and social assistance | 6214 | 711.1 | 1,059.2 | 348.1 | 4.1 |
| Offices of other health practitioners | Health care and social assistance | 6213 | 784.2 | 1,136.5 | 352.3 | 3.8 |
| Other ambulatory health care services | Health care and social assistance | 6219 | 278.6 | 389.0 | 110.4 | 3.4 |
| Medical and diagnostic laboratories | Health care and social assistance | 6215 | 247.4 | 327.1 | 79.7 | 2.8 |
| Management, scientific, and technical consulting services | Professional and business services | 5416 | 1,244.4 | 1,573.7 | 329.3 | 2.4 |
| Software publishers | Information | 5112 | 312.5 | 393.2 | 80.7 | 2.3 |
| Facilities support services | Professional and business services | 5612 | 131.4 | 163.2 | 31.8 | 2.2 |
| Computer systems design and related services | Professional and business services | 5415 | 1,777.7 | 2,186.6 | 408.9 | 2.1 |
| Nursing and residential care facilities | Health care and social assistance | 623 | 3,261.0 | 3,996.7 | 735.7 | 2.1 |
| Securities, commodity contracts, and other financial investments and related activities | Financial activities | 523 | 877.6 | 1,074.2 | 196.6 | 2.0 |
| Offices of physicians | Health care and social assistance | 6211 | 2,470.2 | 2,992.9 | 522.7 | 1.9 |
| Offices of dentists | Health care and social assistance | 6212 | 891.1 | 1,050.9 | 159.8 | 1.7 |
| Funds, trusts, and other financial vehicles | Financial activities | 525 | 3.7 | 4.4 | 0.7 | 1.7 |
| Local government passenger transit | State and local government | NA | 277.6 | 322.0 | 44.4 | 1.5 |
| Other information services | Information | 519 | 217.8 | 251.0 | 33.2 | 1.4 |
| Office administrative services | Professional and business services | 5611 | 461.7 | 530.0 | 68.3 | 1.4 |
| Support activities for mining | Mining | 213 | 438.5 | 501.7 | 63.2 | 1.4 |
| Individual and family services | Health care and social assistance | 6241 | 2,032.5 | 2,318.8 | 286.3 | 1.3 |
| Wireless telecommunications carriers (except satellite) | Information | 5172 | 155.3 | 176.5 | 21.2 | 1.3 |
| Most rapidly declining | ||||||
| Apparel, leather, and allied manufacturing | Manufacturing | 315, 316 | 168.5 | 91.7 | -76.8 | -5.9 |
| Tobacco manufacturing | Manufacturing | 3122 | 13.6 | 9.2 | -4.4 | -3.9 |
| Postal Service | Federal government | NA | 593.0 | 427.9 | -165.1 | -3.2 |
| Federal enterprises except the Postal Service and electric utilities | Federal government | NA | 81.1 | 58.9 | -22.2 | -3.1 |
| Manufacturing and reproducing magnetic and optical media | Manufacturing | 3346 | 18.9 | 14.0 | -4.9 | -2.9 |
| Communications equipment manufacturing | Manufacturing | 3342 | 93.5 | 69.5 | -24.0 | -2.9 |
| Newspaper, periodical, book, and directory publishers | Information | 5111 | 412.3 | 309.0 | -103.3 | -2.8 |
| Textile mills and textile product mills | Manufacturing | 313, 314 | 232.1 | 174.2 | -57.9 | -2.8 |
| Audio and video equipment manufacturing | Manufacturing | 3343 | 18.9 | 14.6 | -4.3 | -2.6 |
| Glass and glass product manufacturing | Manufacturing | 3272 | 85.8 | 67.3 | -18.5 | -2.4 |
| Pulp, paper, and paperboard mills | Manufacturing | 3221 | 104.2 | 83.0 | -21.2 | -2.2 |
| Other miscellaneous manufacturing | Manufacturing | 3399 | 275.2 | 219.3 | -55.9 | -2.2 |
| Hardware manufacturing | Manufacturing | 3325 | 24.3 | 19.6 | -4.7 | -2.1 |
| Federal electric utilities | Federal government | NA | 17.9 | 14.5 | -3.4 | -2.1 |
| Printing and related support activities | Manufacturing | 323 | 452.7 | 371.3 | -81.4 | -2.0 |
| Spring and wire product manufacturing | Manufacturing | 3326 | 43.8 | 36.1 | -7.7 | -1.9 |
| Foundries | Manufacturing | 3315 | 127 | 105.2 | -21.8 | -1.9 |
| Computer and peripheral equipment manufacturing | Manufacturing | 3341 | 162.8 | 135.5 | -27.3 | -1.8 |
| Clay product and refractory manufacturing | Manufacturing | 3271 | 39.5 | 33.0 | -6.5 | -1.8 |
| Wired telecommunications carriers | Information | 111 | 607 | 509.2 | -97.8 | -1.7 |
| Notes: (1) Ten-year compound average annual rate. Source: U.S. Bureau of Labor Statistics, Employment Projections Program. | ||||||
The professional and business services sector accounts for 4 of the 20 fastest growing industries over the projections period. Within this sector, management, scientific, and technical consulting services comes in as the sixth fastest growing industry, growing annually at 2.4 percent over the 2014–24 period. (See table 3.) As firms look to lower costs, the movement toward using consulting services for specific tasks rather than hiring full-time employees will continue to grow.
The information sector is projected to account for 3 of the 20 fastest growing industries over the projections period. Software publishers is projected to be the seventh fastest growing industry, growing 2.3 percent annually. The increased need for software to keep up with newer and faster technology is driving the employment growth in this industry. Wireless telecommunications carriers is the 20th fastest growing industry, growing 1.3 percent annually, over the projections period. This is being driven by the movement away from landlines to wireless.34
Although the manufacturing sector is projected to lose the most jobs of any sector over the projections period, it is projected to be only the second most rapidly declining sector; the federal government sector is the fastest declining sector. (See table 1.) Because of the size of the manufacturing sector, it contains 15 of the 20 industries projected to have the most rapid declines. The apparel, leather, and allied manufacturing industries is projected to be the most rapidly declining industry, falling 5.9 percent annually. (See table 3.) Import competition, consolidation of firms, and the shift to overseas production are some of the reasons for the rapid decline in this labor-intensive industry. Tobacco manufacturing is the industry with the second most rapidly declining wage and salary employment, falling 3.9 percent annually over the projections period. The continued decline in the smoking rate is one of the reasons for the industry’s drop in employment.
The fastest declining wage and salary employment sector, the federal government, contains 3 of the 20 most rapidly declining industries. The Postal Service industry is projected to decline by 3.2 percent annually, making it the third fastest declining industry over the projections period. (See table 3.) With the decreased circulation of magazines and catalogues because of content available on the web and with more people using online bill pay (electronic bill payment) rather than mailing in payments, consumers are less likely to use services provided by the Postal Service.
The construction industry is projected to add the largest number of jobs from 2014 to 2024, increasing by 790,400 to reach just over 6.9 million. (See table 4.) For reasons already stated, the construction industry, although adding the largest number of jobs, is not projected to reach prerecession levels by 2024.35
| Industry description | Sector | 2012 NAICS code | Number of jobs (in thousands) | Change (in thousands) | Annual rate of change(1) | |
|---|---|---|---|---|---|---|
| 2014 | 2024 | 2014–24 | 2014–24 | |||
| Largest growth | ||||||
| Construction | Construction | 23 | 6,138.4 | 6,928.8 | 790.4 | 1.2 |
| Home health care services | Health care and social assistance | 6216 | 1,262.2 | 2,022.6 | 760.4 | 4.8 |
| Nursing and residential care facilities | Health care and social assistance | 623 | 3,261.0 | 3,996.7 | 735.7 | 2.1 |
| Food services and drinking places | Leisure and hospitality | 722 | 10,717.0 | 11,375.0 | 658.0 | 0.6 |
| Offices of physicians | Health care and social assistance | 6211 | 2,470.2 | 2,992.9 | 522.7 | 1.9 |
| Local government educational services compensation | State and local government | NA | 7,791.2 | 8,217.6 | 426.4 | 0.5 |
| Employment services | Professional and business services | 5613 | 3,421.0 | 3,845.8 | 424.8 | 1.2 |
| Computer systems design and related services | Professional and business services | 5415 | 1,777.7 | 2,186.6 | 408.9 | 2.1 |
| Hospitals | Health care and social assistance | 622 | 4,784.3 | 5,179.2 | 394.9 | 0.8 |
| Offices of other health practitioners | Health care and social assistance | 6213 | 784.2 | 1,136.5 | 352.3 | 3.8 |
| Outpatient care centers | Health care and social assistance | 6214 | 711.1 | 1,059.2 | 348.1 | 4.1 |
| Management, scientific, and technical consulting services | Professional and business services | 5416 | 1,244.4 | 1,573.7 | 329.3 | 2.4 |
| Wholesale trade | Wholesale trade | 42 | 5,826.0 | 6,151.4 | 325.4 | 0.5 |
| Individual and family services | Health care and social assistance | 6241 | 2,032.5 | 2,318.8 | 286.3 | 1.3 |
| General merchandise stores | Retail trade | 452 | 3,113.6 | 3,376.8 | 263.2 | 0.8 |
| All other retail | Retail trade | 442–444, 446–448, 451, 453-454 | 7,395.6 | 7,646.6 | 251.0 | 0.3 |
| Private junior colleges, colleges, universities, and professional schools | Private educational services | 6112, 6113 | 1,777.2 | 1,997.2 | 220.0 | 1.2 |
| Securities, commodity contracts, and other financial investments and related activities | Financial activities | 523 | 877.6 | 1,074.2 | 196.6 | 2.0 |
| Offices of dentists | Health care and social assistance | 6212 | 891.1 | 1,050.9 | 159.8 | 1.7 |
| Motor vehicle and parts dealers | Retail trade | 441 | 1,861.3 | 2,017.2 | 155.9 | 0.8 |
| Largest declines | ||||||
| Postal Service | Federal government | NA | 593.0 | 427.9 | -165.1 | -3.2 |
| Federal nondefense government compensation | Federal government | NA | 1,514.8 | 1,404.3 | -110.5 | -0.8 |
| Newspaper, periodical, book, and directory publishers | Information | 5111 | 412.3 | 309.0 | -103.3 | -2.8 |
| Wired telecommunications carriers | Information | 5171 | 607.0 | 509.2 | -97.8 | -1.7 |
| Federal defense government compensation | Federal government | NA | 522.2 | 440.0 | -82.2 | -1.7 |
| Printing and related support activities | Manufacturing | 323 | 452.7 | 371.3 | -81.4 | -2.0 |
| Apparel, leather, and allied manufacturing | Manufacturing | 315, 316 | 168.5 | 91.7 | -76.8 | -5.9 |
| Crop production | Agriculture | 111 | 765.6 | 699.9 | -65.7 | -0.9 |
| Plastics product manufacturing | Manufacturing | 3261 | 541.6 | 478.5 | -63.1 | -1.2 |
| Textile mills and textile product mills | Manufacturing | 313, 314 | 232.1 | 174.2 | -57.9 | -2.8 |
| Other miscellaneous manufacturing | Manufacturing | 3399 | 275.2 | 219.3 | -55.9 | -2.2 |
| Electric power generation, transmission and distribution | Utilities | 2211 | 392.1 | 351.3 | -40.8 | -1.1 |
| Navigational, measuring, electromedical, and control instruments manufacturing | Manufacturing | 3345 | 388.3 | 353.1 | -35.2 | -0.9 |
| Semiconductor and other electronic component manufacturing | Manufacturing | 3344 | 367.8 | 332.7 | -35.1 | -1.0 |
| Computer and peripheral equipment manufacturing | Manufacturing | 3341 | 162.8 | 135.5 | -27.3 | -1.8 |
| Travel arrangement and reservation services | Professional business services | 5615 | 195.7 | 168.9 | -26.8 | -1.5 |
| Aerospace product and parts manufacturing | Manufacturing | 3364 | 488.4 | 464.1 | -24.3 | -0.5 |
| Communications equipment manufacturing | Manufacturing | 3342 | 93.5 | 69.5 | -24.0 | -2.9 |
| Motor vehicle parts manufacturing | Manufacturing | 3363 | 536.6 | 514.0 | -22.6 | -0.4 |
| Federal enterprises except the Postal Service and electric utilities | Federal government | NA | 81.1 | 58.9 | -22.2 | -3.1 |
| Notes: (1) Ten-year compound average annual rate. Source: U.S. Bureau of Labor Statistics, Employment Projections Program. | ||||||
The health care and social assistance sector contains 8 of the top 20 industry increases in jobs over the 2014–24 projections period. (See table 4.) Adding 760,400 jobs to reach just over 2.0 million in 2024, the home health care services industry leads the projected growth in jobs in this sector, which is expected to have the second largest growth among all industries. An aging population and lower cost of home health care will drive the employment growth in this industry.36 Nursing and residential care facilities is the industry projected to have the third largest increase in employment, adding 735,700 jobs to reach just under 4.0 million in 2024. The aging population and the movement away from hospitalization to shorter term care facilities for recovery are driving the employment growth in this industry.37
Three industries within the professional and business services sector are on the list of the top 20 in terms of the increase in the number of wage and salary jobs. The employment services industry is the largest within this sector and is projected to add 424,800 jobs from 2014 to 2024, making this the seventh largest increase. (See table 4.) This industry, which includes employment placement agencies, temporary help services, and professional employer organizations, will grow as demand rises for temporary workers, increased information technology workers, and health care workers. The computer system design and related services industry is projected to have the eighth largest increase in employment among all industries, adding 408,900 jobs to reach almost 2.2 million in 2024. The demand for both improved computer and network security, better and faster mobile technologies, and the increased use of electronic records will drive the demand for employment in this industry.
The federal government sector contains 4 of the top 20 industry declines in wage and salary employment over the 2014–24 projections period. (See table 4.) The Postal Service’s projected loss of 165,100 jobs from 2014 to 2024 is the largest decline within this sector and within the entire economy. Federal nondefense government compensation is projected to experience the second largest decline among all industries in the economy, losing 110,500 jobs by 2024. The increased pressure to cut government spending and services will drive the employment loss in this industry.
The manufacturing sector contains 11 of the top 20 projected declines in wage and salary employment. (See table 4.) With a projected loss of 81,400 jobs from 2014 to 2024, the printing and related support activities industries is expected to have the largest decline among the manufacturing industries and sixth largest decline in the entire economy. The movement toward electronic records and publishing on the Internet and away from catalogue and newspaper printing will mean less demand for jobs in this industry. The apparel, leather, and allied manufacturing industry is projected to lose 76,800 jobs by 2024, giving this industry the seventh largest decline in employment. The textile mills and textile product mills industry, much like the apparel, leather, and allied manufacturing industry, is suffering from consolidation and import competition and is projected to lose 57,900 jobs over the projections period, making this the 10th largest decline in employment.
The information sector is projected to have the three fastest growing real output industries in the entire economy. (See table 5.) The software publishers industry is projected to have the fastest growing real output, with an annual growth rate of 4.7 percent. Increased reliance of businesses and consumers on software applications, as well as improved technology and the expanding demand for new and better features, will drive the increase in real output in this industry. The wireless telecommunications and satellite telecommunications industries are projected to be the second and third fastest growing in terms of real output, growing at annual rates of 4.2 percent and 4.1 percent, respectively. The movement away from wired telecommunication (landlines) toward mobile telecommunications that are more than just phones has been occurring over the last decade, and this trend is expected to continue.
| Industry description | Sector | 2012 NAICS code | Billions of chained 2009 dollars | Change (in billions of chained 2009 dollars) | Annual rate of change(1) | |
|---|---|---|---|---|---|---|
| 2014 | 2024 | 2014–24 | 2014–24 | |||
| Fastest growing | ||||||
| Software publishers | Information | 5111 | 195.2 | 308.5 | 113.3 | 4.7 |
| Wireless telecommunications carriers (except satellite) | Information | 5172 | 288.8 | 433.7 | 144.9 | 4.2 |
| Satellite, telecommunications resellers, and all other telecommunications | Information | 5174, 5179 | 42.3 | 63.4 | 21 | 4.1 |
| Computer and peripheral equipment manufacturing | Manufacturing | 3341 | 74.2 | 105.1 | 31.0 | 3.5 |
| Other miscellaneous manufacturing | Manufacturing | 3399 | 78.0 | 108.8 | 30.8 | 3.4 |
| Securities, commodity contracts, and other financial investments and related activities | Financial activities | 523 | 403.1 | 561.1 | 158.0 | 3.4 |
| Lessors of nonfinancial intangible assets (except copyrighted works) | Financial activities | 533 | 152.7 | 212.1 | 59.4 | 3.3 |
| Medical equipment and supplies manufacturing | Manufacturing | 3391 | 109.0 | 151.1 | 42.1 | 3.3 |
| Offices of other health practitioners | Health care and social assistance | 6213 | 89.3 | 123.3 | 34.0 | 3.3 |
| Home health care services | Health care and social assistance | 6216 | 74.2 | 101.7 | 27.5 | 3.2 |
| Monetary authorities, credit intermediation, and related activities | Financial activities | 521, 522 | 550.2 | 753.0 | 202.8 | 3.2 |
| Medical and diagnostic laboratories | Health care and social assistance | 6215 | 49.7 | 68.0 | 18.3 | 3.2 |
| Offices of physicians | Health care and social assistance | 6211 | 431.2 | 589.9 | 158.7 | 3.2 |
| Other ambulatory health care services | Health care and social assistance | 6219 | 40.5 | 55.3 | 14.8 | 3.2 |
| Outpatient care centers | Health care and social assistance | 6214 | 100.8 | 136.9 | 36.1 | 3.1 |
| Hospitals | Health care and social assistance | 622 | 682.2 | 920.6 | 238.4 | 3 |
| Computer systems design and related services | Professional and business services | 5415 | 350.8 | 470.0 | 119.2 | 3 |
| Petroleum and coal products manufacturing | Manufacturing | 324 | 515.9 | 689.9 | 174 | 2.9 |
| General merchandise stores | Retail trade | 452 | 190.5 | 254.0 | 63.5 | 2.9 |
| Funds, trusts, and other financial vehicles | Financial activities | 525 | 106.8 | 142.1 | 35.4 | 2.9 |
| Most rapidly declining | ||||||
| Tobacco manufacturing | Manufacturing | 3122 | 50.0 | 44.6 | -5.3 | -1.1 |
| Postal Service | Federal government | NA | 61.7 | 57.2 | -4.6 | -0.8 |
| Federal defense government compensation | Federal government | NA | 220.5 | 212 | -8.5 | -0.4 |
| Federal defense government consumption of fixed capital | Federal government | NA | 154.8 | 148.8 | -6.0 | -0.4 |
| Federal nondefense government compensation | Federal government | NA | 148.0 | 144.7 | -3.3 | -0.2 |
| Federal nondefense government consumption of fixed capital | Federal government | NA | 95.1 | 9.03 | -2.1 | -0.2 |
| Federal defense government except compensation and consumption of fixed capital | Federal government | NA | 221.5 | 220.9 | -0.6 | 0 |
| Notes: (1) Ten-year compound average annual rate. Source: U.S. Bureau of Labor Statistics, Employment Projections Program. | ||||||
The health care and social assistance sector contains 7 of the 20 industries with the fastest growing real output. (See table 5.) The offices of other health practitioners industry, growing at 3.3 percent annually over the 2014–24 period, is the ninth fastest growing industry. The greater availability of insurance, increased pressure to reduce costs, and technological changes continue to shift services from inpatient to outpatient services. This shift is driving the increase in real output in this industry. The 3.2-percent annual growth in home health care services, number 10 of the top 20, can be attributed to the same factors as those for the industry of offices of other health practitioners.
The manufacturing sector has 4 industries in the top 20 in terms of percentage increases in real output, with computer and peripheral equipment manufacturing being the fastest growing, growing 3.5 percent annually; this rate makes it the fourth fastest growing industry in the economy. (See table 5.) This industry continues to grow, though much slower than it has in the past, because there is movement away from desktop and laptop computers and toward tablets, which are more mobile. This industry is consistently one of the most productive as evidenced by its newer and more efficient technology. The medical equipment and supplies manufacturing industry is projected to be the eighth fastest growing, gaining 3.3 percent in output annually over the projections period. This industry is directly related to the health care and social assistance sector. With the public’s increased access to insurance and new technology and an aging population, the demand for medical equipment and supplies equipment is projected to grow from 2014 to 2024.
The federal government sector accounts for six of the seven industries that are projected to experience a decline in output. (See table 5.) The Postal Service industry is projected to see the largest decline in output in the federal government, with output falling 0.8 percent annually over the projections period. The pressure to reduce the budget deficit and decrease government spending is the largest contributing factor to the decline in the other federal government industries.
Tobacco manufacturing, which is part of the manufacturing sector, is projected to experience the most rapid decline in real output, falling 1.1 percent annually over the 2014–24 period, mainly because of the shrinking of the industry. (See table 5.)
Industries that are fairly large in terms of output tended to be the industries with the largest growth over the projections period. The wholesale trade industry is projected to have an increase of $391.5 billion over the projections period to reach almost $1.8 trillion in 2024, making it the industry with the largest increase in real output from 2014 to 2024. (See table 6.) The increasing demand for domestic goods will drive the increased demand for wholesale trade services. The real estate industry is projected to have the second largest increase in real output from 2014 to 2024, increasing by $362.8 billion to reach almost $1.8 trillion. The construction industry is projected to have the third largest increase in output, growing by $326.2 billion to reach close to $1.4 trillion in 2024. Due to the increase in both residential and nonresidential investment, a rebound of the construction industry, as previously noted, will increase the demand for real estate services.
| Industry description | Sector | 2012 NAICS code | Billions of chained 2009 dollars | Change (in billions of chained 2009 dollars) | Annual rate of change(1) | |
|---|---|---|---|---|---|---|
| 2014 | 2024 | 2014–24 | 2014–24 | |||
| Largest growth | ||||||
| Wholesale trade | Wholesale trade | 42 | 1,362.9 | 1,754.4 | 391.5 | 2.6 |
| Real estate | Financial activities | 531 | 1,387.5 | 1,750.3 | 362.8 | 2.3 |
| Construction | Construction | 23 | 1,031.1 | 1,357.3 | 326.2 | 2.8 |
| All other retail | Retail trade | 442–444, 446–448, 451, 453–454 | 797.2 | 1060.7 | 263.5 | 2.9 |
| Hospitals | Health care and social assistance | 622 | 682.2 | 920.6 | 238.4 | 3.0 |
| Monetary authorities, credit intermediation, and related activities | Financial activities | 521, 522 | 550.2 | 753.0 | 202.8 | 3.2 |
| Petroleum and coal products manufacturing | Manufacturing | 324 | 515.9 | 689.9 | 174.0 | 2.9 |
| Offices of physicians | Health care and social assistance | 6211 | 431.2 | 589.9 | 158.7 | 3.2 |
| Securities, commodity contracts, and other financial investments and related activities | Financial activities | 523 | 403.1 | 561.1 | 158.0 | 3.4 |
| State and local government except compensation and consumption of fixed capital | State and local government | NA | 592.2 | 743.0 | 150.8 | 2.3 |
| Wireless telecommunications carriers (except satellite) | Information | 5172 | 288.8 | 433.7 | 144.9 | 4.2 |
| Food services and drinking places | Leisure and hospitality | 722 | 579.6 | 708.6 | 129.0 | 2.0 |
| Computer systems design and related services | Professional and business services | 5415 | 350.8 | 470.0 | 119.2 | 3.0 |
| Management of companies and enterprises | Professional and business services | 55 | 486.5 | 604.5 | 118.0 | 2.2 |
| Software publishers | Information | 5112 | 195.2 | 308.5 | 113.3 | 4.7 |
| Insurance carriers | Financial activities | 5241 | 545.1 | 650 | 104.9 | 1.8 |
| Architectural, engineering, and related services | Professional and business services | 5413 | 299.0 | 387.2 | 88.2 | 2.6 |
| Motor vehicle and parts dealers | Retail trade | 441 | 242.5 | 317.8 | 75.3 | 2.7 |
| Food and beverage stores | Retail trade | 445 | 199.8 | 264.2 | 64.5 | 2.8 |
| Truck transportation | Transportation and warehousing | 484 | 278.3 | 342.1 | 63.8 | 2.1 |
| Largest declines | ||||||
| Federal defense government compensation | Federal government | NA | 220.5 | 212.0 | -8.5 | -0.4 |
| Federal defense government consumption of fixed capital | Federal government | NA | 154.8 | 148.8 | -6.0 | -0.4 |
| Tobacco manufacturing | Manufacturing | 3122 | 50.0 | 44.6 | -5.3 | -1.1 |
| Postal Service | Federal government | NA | 61.7 | 57.2 | -4.6 | -0.8 |
| Federal nondefense government compensation | Federal government | NA | 148.0 | 144.7 | -3.3 | -0.2 |
| Federal nondefense government consumption of fixed capital | Federal government | NA | 95.1 | 93.0 | -2.1 | -0.2 |
| Federal defense government except compensation and consumption of fixed capital | Federal government | NA | 221.5 | 220.9 | -0.6 | 0 |
| Notes: (1) Ten-year compound average annual rate. Source: U.S. Bureau of Labor Statistics, Employment Projections Program. | ||||||
The retail trade sector accounts for 3 of the 20 sectors with the largest growth in output over the 2014–24 projections period. (See table 6.) All other retail is projected to reach almost $1.1 trillion in 2024 after increasing by $263.5 billion, the largest industry increase in the retail sector and the fourth largest increase in the economy. The motor vehicle and parts dealer industry and food and beverages stores industry are projected to have the 18th and 19th largest increases in the economy, growing by $75.3 billion and $64.5 billion over the projections period, respectively. As previously noted, the expected increase in personal consumption expenditures over the projections period will drive the increased demand for these services.
The federal government sector contains six of the seven industries that are projected to have declining output over the 2014–24 period. (See table 6.) The pressure to reduce the deficit and cut government spending will continue to reduce real output within the industries of the federal government sector. Tobacco manufacturing is the only other industry that is projected to experience a decrease in output from 2014 to 2024, with real output projected to fall to $44.6 billion.
Although the manufacturing sector is projected to have the largest loss of jobs over the projections period, some industries within the manufacturing sector will experience job growth. In fact, 11 of the 76 manufacturing industries will see some job growth.38 (See “employment and output by industry” table at www.bls.gov/emp/tables/industry-employment-and-output.htm.) The industries that are most closely related to construction will post the largest increases in employment, with the agriculture, construction, and mining machinery manufacturing industry projected to have an increase of 13,600 jobs—representing an annual growth rate of 0.5 percent from 2014 to 2024—to reach 268,700. This increase in jobs, however, is less than the 59,700 jobs that were added during the 2004–14 period. Nonetheless, the 0.5-percent projected annual growth is the fastest among all the manufacturing industries. The architectural and structural metals manufacturing industry is projected to add 11,700 jobs, reaching 373,200 in 2024. The number of additional jobs is smaller than the 27,400 jobs that were lost from 2004 to 2014, and the number of projected jobs in this industry is projected to still be below the prerecession level by 2024.
Industries that are related to education also are projected to see a large increase in employment over the projections period. The local government educational services compensation industry is projected to add 426,400 jobs to reach over 8.2 million in 2024. The increase in jobs in this industry makes it the sixth largest increase among all industries within the economy. (See table 4.) While the local government educational services compensation industry is within the state and local government sector, the junior colleges, colleges, universities, and professional schools industries is within the private education services sector and also is projected to be among the 20 industries with the largest growth in employment; coming in at number 17, this industry is projected to add 220,000 jobs, totaling just under 2.0 million jobs in 2024. (See table 4.) The increased numbers of older students looking to increase their skill sets and college-age people is driving the growth of jobs in these industries.39]
BLS projects that overall employment growth will be slightly stronger from 2014 to 2024 than it was from 2004 to 2014, while the average annual output growth will be substantially higher over the 2014–24 period than it was during the 2004–14 period. Projected growth rates are trending back toward the long-term trends that occurred prior to the last recession.
By 2024 the service-providing sectors will account for over 81 percent of all the jobs in the economy and will account for the majority of the job growth that is projected to occur from 2014 to 2024. Health care and social assistance will account for over a third of the jobs added over the projections period. The real output of the total service-providing sectors is projected to grow slightly faster than the overall economy and account for an increasing portion of total output by 2024.
Growth in the construction sector will drive employment growth in the goods-producing sector over the next decade. Manufacturing is projected to experience a decline and therefore would be responsible for the total goods-producing sectors’ job loss in the coming decade.
!--?pagebreak>!--?pagebreak>!--?pagebreak>!--?pagebreak>!--?pagebreak>!--?pagebreak>!--?pagebreak>!--?pagebreak>!--?pagebreak>!--?pagebreak>!--?pagebreak>!--?pagebreak>!--?pagebreak>!--?pagebreak>!--?pagebreak>Richard Henderson, "Industry employment and output projections to 2024," Monthly Labor Review, U.S. Bureau of Labor Statistics, December 2015, https://doi.org/10.21916/mlr.2015.47
1 Total employment is the summation of the employment level of nonagricultural wage and salary workers; agricultural, forestry, fishing, and hunting workers; and self-employed workers. Nonagricultural wage and salary employment data are from the BLS Current Employment Survey (CES), except for private household employment data, which are provided by the Current Population Survey (CPS). The CPS also provides the data for self-employed workers and agricultural, forestry, fishing, and hunting workers.
2 Compounded annual rate of growth.
3 Nonagricultural wage and salary employment data are from the Current Employment Survey (CES), except for private household employment data, which are from the Current Population Survey (CPS). Logging workers are excluded.
4 Throughout this article, unless otherwise noted, output refers to real output in chain-weighted 2009 dollars.
5 See Kathryn Byun and Bradley Nicholson, “The U.S. economy to 2024,” Monthly Labor Review, December 2015.
6 See Mitra Toossi, “Labor force projections to 2024: the labor force is growing, but slowly,” Monthly Labor Review, December 2015.
7 See Byun and Nicholson, “The U.S. economy to 2024.”
8 See Richard Henderson, “Industry employment and output projections to 2022,” Monthly Labor Review, December 2013.
9 “USDA agricultural projections to 2024,” Report OCE-2015-1 (Office of the Chief Economist, World Agricultural Outlook Board, U.S. Department of Agriculture, Interagency Agricultural Projections Committee, Long-term projections report, February 2015).
10 See Byun and Nicholson, “The U.S. economy to 2024.”
11 Jordan Weissmann, “U.S. drillers drove oil prices down. Can they prop them back up?” Slate, February 4, 2015.
12 See Byun and Nicholson, “The U.S. economy to 2024.”
13 Ibid.
14 Ibid.
15 Adams B. Nager and Robert D. Atkinson, “The myth of America’s manufacturing renaissance: the real state of U.S. manufacturing,” Information Technology & Innovation Foundation, January 2015, http://www2.itif.org/2015-myth-american-manufacturing-renaissance.pdf.
16 Industrial Maintenance & Plant Operation, “Jobs report 2014,” http://www.impomag.com.
17 Ibid.
18 Andy Szal, “Report: robotic welding to grow sharply by 2020,” Manufacturing.net, March 11, 2015.
19 Alan Beaulieu and Jon Murphy, “State of the wholesale distribution industry 2014,” National Association of Wholesaler-Distributors.
20 See Byun and Nicholson, “The U.S. economy to 2024.”
21 Michael Barthel, “Newspapers: fact sheet,” Pew Research Center, April 29, 2015, http://www.journalism.org/2015/04/29/newspapers-fact-sheet/.
22 Robert Channick, “40% of homes now without a landline,” Chicago Tribune, July 8, 2014, http://www.chicagotribune.com/business/chi-landlines-survey-20140708-story.html.
23 See Toossi, “Labor force projections to 2024.”
24 See Byun and Nicholson, “The U.S. economy to 2024.”
25 Tabitha M. Bailey and William J. Hussar, “Projections of education statistics to 2022” (U.S. Department of Education, National Center for Education Statistics, Washington, DC), February 2014, https://nces.ed.gov/pubs2014/2014051.pdf.
26 See Bailey and Hussar, “Projections of education statistics.”
27 “National health expenditure projections 2013–2023,” Centers for Medicare and Medicaid Services, July 2015, https://www.cms.gov/Research-Statistics-Data-and-Systems/Statistics-Trends-and-Reports/NationalHealthExpendData/NationalHealthAccountsProjected.html.
28 Ibid.
29 Ibid.
30 Ibid.
31 Ibid.
32 See Bailey and Hussar, “Projections of education statistics.”
33 Ibid.
34 See Barthel, “Newspapers: fact sheet.”
35 See Byun and Nicholson, “The U.S. economy to 2024.”
36 “National health expenditure projections 2013–2023.”
37 Ibid.
38 See https://www.bls.gov/emp/tables/industry-employment-and-output.htm for a list of all industries.
39 See “National health expenditure projections 2013–2023.”