An official website of the United States government
An official website of the United States government
The .gov means it's official.
Federal government websites often end in .gov or .mil. Before sharing sensitive information,
make sure you're on a federal government site.
The site is secure.
The
https:// ensures that you are connecting to the official website and that any
information you provide is encrypted and transmitted securely.
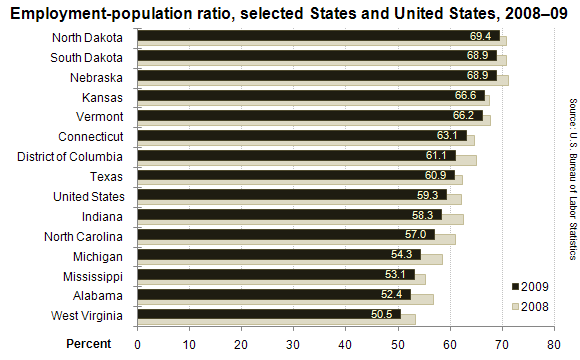
In 2009, 22 states and the District of Columbia recorded employment-population ratios—the proportion of the civilian noninstitutional population 16 years and older with a job—that were significantly above the U.S. ratio of 59.3 percent, and 16 states had ratios that were appreciably below it. The remaining 12 states reported ratios that were not measurably different from that of the nation.
Three states in the West North Central division again posted the highest ratios: North Dakota (69.4 percent) and Nebraska and South Dakota (68.9 percent each).
West Virginia again reported the lowest employment-population ratio among the states (50.5 percent), which it has done for 34 consecutive years.
In 2009, all 50 states and the District of Columbia registered statistically significant decreases in their employment-population ratios. Four states and the District of Columbia reported drops of 4.0 percentage points or more in 2009: Alabama (‑4.4 points), Indiana and Michigan (‑4.3 points), North Carolina (‑4.1 points), and the District of Columbia (‑4.0 points).
These data are from the Local Area Unemployment Statistics program. For more information, see "Regional and State Unemployment — 2009 Annual Averages" (HTML) (PDF), news release USDL-10-0231.
Bureau of Labor Statistics, U.S. Department of Labor, The Economics Daily, State employment-population ratio declines, 2008–09 at https://www.bls.gov/opub/ted/2010/ted_20100305.htm (visited May 03, 2024).