
An official website of the United States government
An official website of the United States government
The .gov means it's official.
Federal government websites often end in .gov or .mil. Before sharing sensitive information,
make sure you're on a federal government site.
The site is secure.
The
https:// ensures that you are connecting to the official website and that any
information you provide is encrypted and transmitted securely.
The U.S. labor force has undergone tremendous change in the last six decades. Over this period, the high labor force growth rate of the 1970s to 1990s was replaced by a much lower growth rate since 2000.
Even though the size of the population will grow, its annual growth rate is projected to slow in the coming decades. The decline in the growth rate of the U.S population is due to a variety of factors, such as the aging of the baby boomers, declining fertility rates, and a lessening of the growth in immigration.
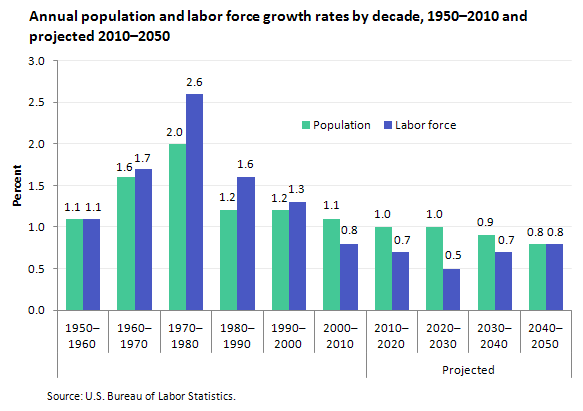
| Decade | Population growth rate | Labor force growth rate |
|---|---|---|
1950–1960 | 1.1 | 1.1 |
1960–1970 | 1.6 | 1.7 |
1970–1980 | 2.0 | 2.6 |
1980–1990 | 1.2 | 1.6 |
1990–2000 | 1.2 | 1.3 |
2000–2010 | 1.1 | 0.8 |
2010–2020 | 1.0 | 0.7 |
2020–2030 | 1.0 | 0.5 |
2030–2040 | 0.9 | 0.7 |
2040–2050 | 0.8 | 0.8 |
During the 1970s, the annual growth rate of the labor force peaked at 2.6 percent, resulting from the labor force entry of the large baby boom generation and the steep rise in the participation rate of women. In the 1980s, the continued absorption of the baby boomers into the labor force kept the participation rate relatively high, and the labor force grew by 1.6 percent annually.
In the 1990s, nearly all baby boomers had entered the labor force, and the growth rate during this period decreased to 1.3 percent. Since 2000, as the population shifted more to older age groups with lower participation rates, the labor force growth rate began to slow even more.
The shift in the composition of the labor force from younger to older age groups is expected to continue in the coming decades. Because of the aging of the baby boomers, the proportion of the labor force composed of people age 55 and older is projected to rise from 13 percent in 2000 to 24 percent by 2050.
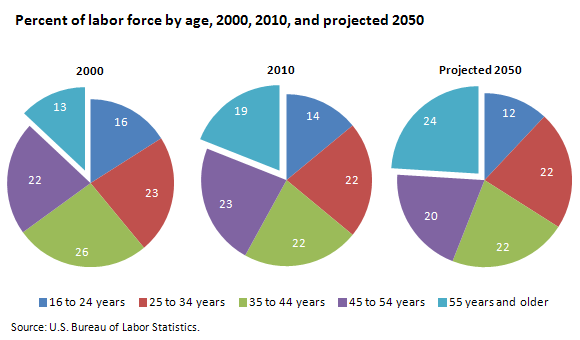
| Age | 2000 | 2010 | Projected 2050 |
|---|---|---|---|
16 to 24 years | 16.0 | 14.0 | 12.0 |
25 to 34 years | 23.0 | 22.0 | 22.0 |
35 to 44 years | 26.0 | 22.0 | 22.0 |
45 to 54 years | 22.0 | 23.0 | 20.0 |
55 years and older | 13.0 | 19.0 | 24.0 |
The labor force share of the 45-to-54 age group increased slightly from 2000 to 2010 but is projected to decline to 20 percent in 2050. The labor force shares of the 25-to-34 and 35-to-44 age groups are projected to hold steady through 2050. The labor force share of the 16-to-24 age group is projected to decrease in the coming decades.
The historical 1950–2011 data are based on the Current Population Survey. The 2008 National Population Projections from the U.S. Census Bureau form the basis of the BLS long-term labor force projections. To learn more, see "Projections of the labor force to 2050: a visual essay,” by Mitra Toossi, Monthly Labor Review, October 2012.
Bureau of Labor Statistics, U.S. Department of Labor, The Economics Daily, Overview of the labor force from 1950–2010 and projections to 2050 at https://www.bls.gov/opub/ted/2012/ted_20121203.htm (visited November 18, 2025).

