
An official website of the United States government
An official website of the United States government
The .gov means it's official.
Federal government websites often end in .gov or .mil. Before sharing sensitive information,
make sure you're on a federal government site.
The site is secure.
The
https:// ensures that you are connecting to the official website and that any
information you provide is encrypted and transmitted securely.
A total of 153.5 million persons worked at some point during 2011. The proportion of workers who worked full time, year round in 2011 was 65.8 percent, up from 64.7 percent in 2010. Among those who worked in 2011, men were more likely than women to work full time, year round.
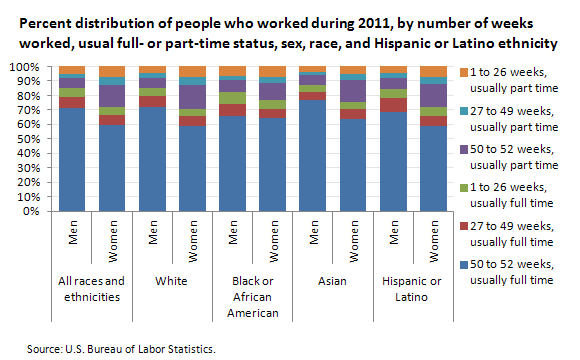
| Extent of employment | All races and ethnicities | White | Black or African American | Asian | Hispanic or Latino | |||||
|---|---|---|---|---|---|---|---|---|---|---|
| Men | Women | Men | Women | Men | Women | Men | Women | Men | Women | |
Total | 100.0 | 100.0 | 100.0 | 100.0 | 100.0 | 100.0 | 100.0 | 100.0 | 100.0 | 100.0 |
50 to 52 weeks, usually full time | 71.2 | 59.8 | 71.7 | 59.0 | 66.1 | 64.0 | 76.6 | 63.6 | 68.6 | 58.8 |
27 to 49 weeks, usually full time | 7.7 | 6.7 | 7.7 | 6.7 | 8.1 | 6.5 | 5.7 | 6.7 | 9.6 | 7.1 |
1 to 26 weeks, usually full time | 6.0 | 5.2 | 5.8 | 5.0 | 8.1 | 6.5 | 4.7 | 5.0 | 6.4 | 6.2 |
50 to 52 weeks, usually part time | 7.2 | 15.7 | 7.0 | 16.5 | 8.3 | 11.3 | 7.2 | 15.1 | 7.8 | 15.9 |
27 to 49 weeks, usually part time | 3.0 | 5.3 | 3.0 | 5.5 | 3.2 | 4.6 | 2.0 | 4.3 | 3.0 | 4.8 |
1 to 26 weeks, usually part time | 5.0 | 7.3 | 4.8 | 7.4 | 6.3 | 7.0 | 3.8 | 5.3 | 4.7 | 7.2 |
Of those employed at some time during 2011, 78.6 percent usually worked full time, up from 78.2 percent a year earlier. The proportion of employed men working full time rose, while the proportion of women changed little. Men continued to be more likely than women to work full time during the year, 84.8 versus 71.7 percent.
Of the total who worked during 2011, 77.0 percent were employed year round (working 50 to 52 weeks, either full or part time), an increase from 75.9 percent in 2010. The share of men employed year round rose by 1.7 percentage points to 78.4 percent in 2011, while the percentage of women working year round was little changed at 75.5 percent.
The "work-experience unemployment rate"—defined as the number of persons unemployed at some time during the year as a proportion of the number of persons who worked or looked for work during the year—was 14.9 percent in 2011, down from 15.9 percent in 2010.
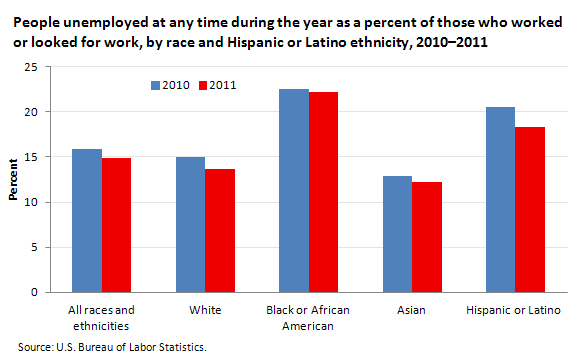
| Race and ethnicity | 2010 | 2011 |
|---|---|---|
All races and ethnicities | 15.9 | 14.9 |
White | 15.0 | 13.7 |
Black or African American | 22.5 | 22.2 |
Asian | 12.9 | 12.2 |
Hispanic or Latino | 20.5 | 18.3 |
The work-experience unemployment rates for Whites (13.7 percent) and Hispanics (18.3 percent) declined from 2010 to 2011, while the rates for Blacks (22.2 percent) and Asians (12.2 percent) were little changed.
These data are from the Current Population Survey. To learn more, see "Work Experience of the Population — 2011" (HTML) (PDF), news release USDL‑12‑2459. Workers are classified as full time if they usually worked 35 hours or more in a week. Persons whose ethnicity is identified as Hispanic or Latino may be of any race.
Bureau of Labor Statistics, U.S. Department of Labor, The Economics Daily, Employment and unemployment experience of the U.S. population in 2011 at https://www.bls.gov/opub/ted/2012/ted_20121227.htm (visited May 31, 2026).
