
An official website of the United States government
An official website of the United States government
The .gov means it's official.
Federal government websites often end in .gov or .mil. Before sharing sensitive information,
make sure you're on a federal government site.
The site is secure.
The
https:// ensures that you are connecting to the official website and that any
information you provide is encrypted and transmitted securely.
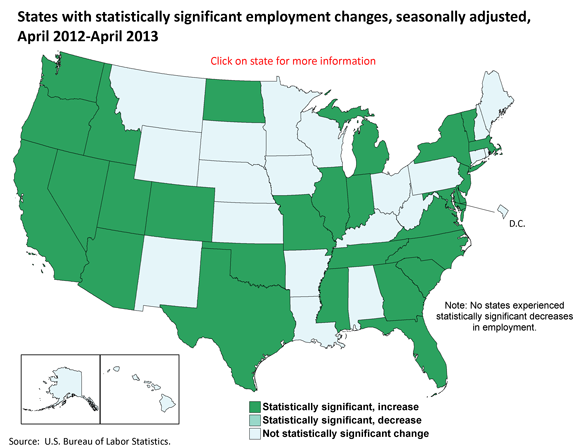
From April 2012 to April 2013, nonfarm employment increased in 47 states and the District of Columbia and decreased in 3 states. The largest over-the-year percentage increase occurred in North Dakota (+3.7 percent) and Utah (+3.5 percent); the largest decreases occurred in Wyoming (−0.5 percent) and Maine (−0.3 percent). Nevada had the highest unemployment rate among the states, 9.6 percent in April 2013, followed by Illinois (9.3 percent), Mississippi (9.1 percent) and California (9.0 percent). North Dakota again registered the lowest jobless rate, 3.3 percent.
Over the year, 28 states experienced statistically significant changes in employment; all of which were positive. Among those states, North Dakota recorded the largest over-the-year percentage increase in employment (+3.7 percent), followed by Utah (+3.5 percent) and Texas (+3.0 percent).
| State | Percent change in nonfarm employment from April 2012 to April 2013(p) | Statistical significance |
|---|---|---|
Alabama | 0.3 | Not statistically significant change |
Alaska | 0.1 | Not statistically significant change |
Arizona | 1.7 | Statistically significant, increase |
Arkansas | 0.8 | Not statistically significant change |
California | 1.9 | Statistically significant, increase |
Colorado | 2.7 | Statistically significant, increase |
Connecticut | 0.7 | Not statistically significant change |
Delaware | 1.6 | Statistically significant, increase |
District of Columbia | 0.4 | Not statistically significant change |
Florida | 1.6 | Statistically significant, increase |
Georgia | 1.7 | Statistically significant, increase |
Hawaii | 0.8 | Not statistically significant change |
Idaho | 2.5 | Statistically significant, increase |
Illinois | 0.7 | Statistically significant, increase |
Indiana | 1.2 | Statistically significant, increase |
Iowa | 0.8 | Not statistically significant change |
Kansas | 0.8 | Not statistically significant change |
Kentucky | 0.8 | Not statistically significant change |
Louisiana | 0.8 | Not statistically significant change |
Maine | -0.3 | Not statistically significant change |
Maryland | 1.3 | Statistically significant, increase |
Massachusetts | 1.4 | Statistically significant, increase |
Michigan | 0.8 | Statistically significant, increase |
Minnesota | 0.8 | Not statistically significant change |
Mississippi | 1.5 | Statistically significant, increase |
Missouri | 1.0 | Statistically significant, increase |
Montana | 1.3 | Not statistically significant change |
Nebraska | 0.2 | Not statistically significant change |
Nevada | 2.0 | Statistically significant, increase |
New Hampshire | 1.0 | Not statistically significant change |
New Jersey | 1.8 | Statistically significant, increase |
New Mexico | 0.7 | Not statistically significant change |
New York | 1.3 | Statistically significant, increase |
North Carolina | 1.8 | Statistically significant, increase |
North Dakota | 3.7 | Statistically significant, increase |
Ohio | 0.1 | Not statistically significant change |
Oklahoma | 1.2 | Statistically significant, increase |
Oregon | 1.5 | Statistically significant, increase |
Pennsylvania | 0.4 | Not statistically significant change |
Rhode Island | 0.6 | Not statistically significant change |
South Carolina | 1.3 | Statistically significant, increase |
South Dakota | 0.9 | Not statistically significant change |
Tennessee | 1.8 | Statistically significant, increase |
Texas | 3.0 | Statistically significant, increase |
Utah | 3.5 | Statistically significant, increase |
Vermont | 1.7 | Statistically significant, increase |
Virginia | 1.0 | Statistically significant, increase |
Washington | 2.0 | Statistically significant, increase |
West Virginia | 0.3 | Not statistically significant change |
Wisconsin | -0.2 | Not statistically significant change |
Wyoming | -0.5 | Not statistically significant change |
Footnotes: | ||
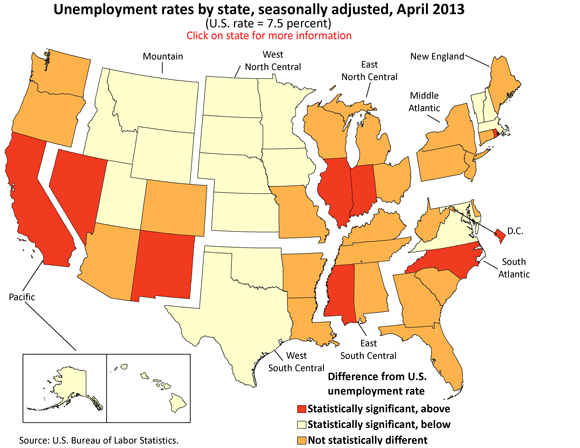
In April 2013, nineteen states reported jobless rates significantly lower than the U.S. figure of 7.5 percent, 8 states and the District of Columbia had measurably higher rates, and 23 states had rates that were not appreciably different from that of the nation.
| State | Unemployment rate (p) | Difference from U.S. rate |
|---|---|---|
Alabama | 6.9 | Not statistically different |
Alaska | 6.0 | Statistically significant, below |
Arizona | 7.9 | Not statistically different |
Arkansas | 7.1 | Not statistically different |
California | 9.0 | Statistically significant, above |
Colorado | 6.9 | Not statistically different |
Connecticut | 8.0 | Not statistically different |
Delaware | 7.2 | Not statistically different |
District of Columbia | 8.5 | Statistically significant, above |
Florida | 7.2 | Not statistically different |
Georgia | 8.2 | Not statistically different |
Hawaii | 4.9 | Statistically significant, below |
Idaho | 6.1 | Statistically significant, below |
Illinois | 9.3 | Statistically significant, above |
Indiana | 8.5 | Statistically significant, above |
Iowa | 4.7 | Statistically significant, below |
Kansas | 5.5 | Statistically significant, below |
Kentucky | 7.9 | Not statistically different |
Louisiana | 6.5 | Not statistically different |
Maine | 6.9 | Not statistically different |
Maryland | 6.5 | Statistically significant, below |
Massachusetts | 6.4 | Statistically significant, below |
Michigan | 8.4 | Not statistically different |
Minnesota | 5.3 | Statistically significant, below |
Mississippi | 9.1 | Statistically significant, above |
Missouri | 6.6 | Not statistically different |
Montana | 5.5 | Statistically significant, below |
Nebraska | 3.7 | Statistically significant, below |
Nevada | 9.6 | Statistically significant, above |
New Hampshire | 5.5 | Statistically significant, below |
New Jersey | 8.7 | Statistically significant, above |
New Mexico | 6.7 | Not statistically different |
New York | 7.8 | Not statistically different |
North Carolina | 8.9 | Statistically significant, above |
North Dakota | 3.3 | Statistically significant, below |
Ohio | 7.0 | Not statistically different |
Oklahoma | 4.9 | Statistically significant, below |
Oregon | 8.0 | Not statistically different |
Pennsylvania | 7.6 | Not statistically different |
Rhode Island | 8.8 | Statistically significant, above |
South Carolina | 8.0 | Not statistically different |
South Dakota | 4.1 | Statistically significant, below |
Tennessee | 8.0 | Not statistically different |
Texas | 6.4 | Statistically significant, below |
Utah | 4.7 | Statistically significant, below |
Vermont | 4.0 | Statistically significant, below |
Virginia | 5.2 | Statistically significant, below |
Washington | 7.0 | Not statistically different |
West Virginia | 6.6 | Not statistically different |
Wisconsin | 7.1 | Not statistically different |
Wyoming | 4.8 | Statistically significant, below |
Footnotes: | ||
From April 2012 to April 2013, fifteen states reported statistically significant unemployment rate changes, all of which were declines. The largest of these occurred in Nevada (−1.9 percentage points), followed by Rhode Island (−1.8 points) and California and Florida (−1.7 points each).
Among the nine geographic divisions, the Pacific continued to have the highest jobless rate, 8.5 percent in April. The West North Central again had the lowest rate, 5.4 percent. Three divisions had significant unemployment rate changes from a year earlier: the Pacific (−1.6 percentage points) and the Mountain and South Atlantic (−0.9 point each).
These data are from the Current Employment Statistics (State and Metro Area) and Local Area Unemployment Statistics programs. Data for the most recent month are preliminary and subject to revision. To learn more, see "Regional and State Employment and Unemployment — April 2013" (HTML) (PDF), news release USDL‑13‑0931.
Bureau of Labor Statistics, U.S. Department of Labor, The Economics Daily, State employment and unemployment, April 2013 at https://www.bls.gov/opub/ted/2013/ted_20130521.htm (visited May 02, 2024).

