
An official website of the United States government
An official website of the United States government
The .gov means it's official.
Federal government websites often end in .gov or .mil. Before sharing sensitive information,
make sure you're on a federal government site.
The site is secure.
The
https:// ensures that you are connecting to the official website and that any
information you provide is encrypted and transmitted securely.
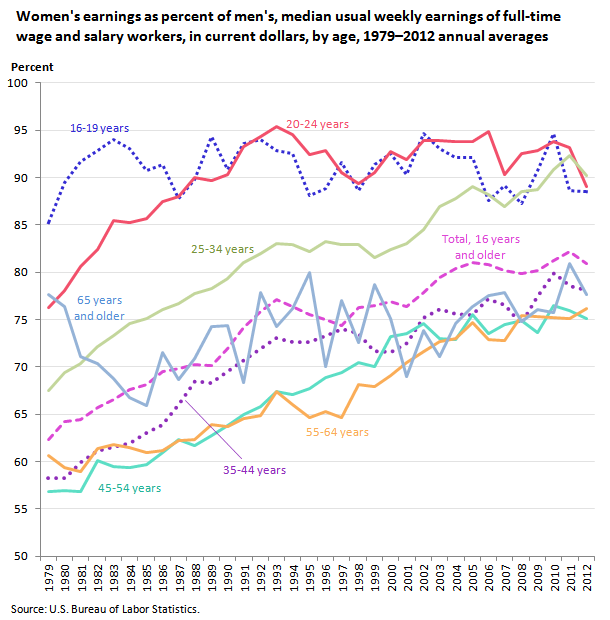
In 2012, women who were full-time wage and salary workers had median usual weekly earnings of $691. On average in 2012, women made about 81 percent of the median earnings of male full-time wage and salary workers ($854). In 1979, the first year for which comparable earnings data are available, women earned 62 percent of what men earned.
| Year | Total, 16 years and older | 16-19 years | 20-24 years | 25-34 years | 35-44 years | 45-54 years | 55-64 years | 65 years and older |
|---|---|---|---|---|---|---|---|---|
1979 | 62.3 | 85.2 | 76.3 | 67.5 | 58.3 | 56.8 | 60.6 | 77.6 |
1980 | 64.2 | 89.5 | 78.1 | 69.4 | 58.3 | 56.9 | 59.4 | 76.4 |
1981 | 64.4 | 91.7 | 80.6 | 70.3 | 59.9 | 56.8 | 58.9 | 71.1 |
1982 | 65.7 | 92.9 | 82.4 | 72.1 | 61.1 | 60.1 | 61.4 | 70.3 |
1983 | 66.5 | 94.0 | 85.5 | 73.3 | 61.5 | 59.5 | 61.8 | 68.8 |
1984 | 67.6 | 93.1 | 85.2 | 74.6 | 62.0 | 59.4 | 61.5 | 66.8 |
1985 | 68.1 | 90.7 | 85.7 | 75.1 | 63.0 | 59.7 | 61.0 | 65.9 |
1986 | 69.5 | 91.4 | 87.5 | 76.1 | 63.9 | 60.9 | 61.2 | 71.5 |
1987 | 69.8 | 87.8 | 88.0 | 76.7 | 66.1 | 62.3 | 62.2 | 68.7 |
1988 | 70.2 | 89.8 | 90.0 | 77.7 | 68.5 | 61.7 | 62.3 | 70.9 |
1989 | 70.1 | 94.3 | 89.7 | 78.3 | 68.3 | 62.7 | 63.9 | 74.3 |
1990 | 71.9 | 90.8 | 90.3 | 79.3 | 69.6 | 63.8 | 63.7 | 74.4 |
1991 | 74.2 | 93.6 | 93.3 | 81.0 | 70.7 | 65.0 | 64.5 | 68.3 |
1992 | 75.8 | 94.0 | 94.3 | 82.0 | 71.9 | 65.8 | 64.9 | 77.9 |
1993 | 77.1 | 92.8 | 95.4 | 83.0 | 73.0 | 67.4 | 67.4 | 74.3 |
1994 | 76.4 | 92.5 | 94.5 | 82.9 | 72.6 | 67.1 | 66.0 | 76.2 |
1995 | 75.5 | 88.1 | 92.4 | 82.2 | 72.6 | 67.7 | 64.7 | 80.0 |
1996 | 75.0 | 88.8 | 92.8 | 83.2 | 73.3 | 68.9 | 65.3 | 70.0 |
1997 | 74.4 | 91.6 | 90.5 | 82.9 | 74.0 | 69.4 | 64.7 | 77.0 |
1998 | 76.3 | 88.6 | 89.4 | 82.9 | 73.6 | 70.5 | 68.1 | 72.6 |
1999 | 76.5 | 91.4 | 90.5 | 81.5 | 71.7 | 70.0 | 67.9 | 78.7 |
2000 | 76.9 | 92.5 | 92.7 | 82.4 | 71.6 | 73.2 | 69.1 | 75.1 |
2001 | 76.4 | 90.3 | 91.9 | 83.0 | 72.5 | 73.5 | 70.5 | 69.0 |
2002 | 77.9 | 94.6 | 93.9 | 84.5 | 75.2 | 74.6 | 71.6 | 73.8 |
2003 | 79.4 | 93.1 | 93.9 | 86.9 | 76.1 | 73.0 | 72.7 | 71.1 |
2004 | 80.4 | 92.1 | 93.8 | 87.8 | 75.6 | 72.9 | 73.0 | 74.6 |
2005 | 81.0 | 92.1 | 93.8 | 89.0 | 75.5 | 75.5 | 74.7 | 76.4 |
2006 | 80.8 | 87.6 | 94.9 | 88.2 | 77.2 | 73.5 | 72.9 | 77.5 |
2007 | 80.2 | 89.1 | 90.3 | 86.9 | 76.5 | 74.5 | 72.8 | 77.8 |
2008 | 79.9 | 87.3 | 92.5 | 88.5 | 74.5 | 74.9 | 75.4 | 74.8 |
2009 | 80.2 | 90.7 | 92.9 | 88.7 | 77.4 | 73.6 | 75.3 | 76.1 |
2010 | 81.2 | 94.6 | 93.8 | 90.8 | 79.9 | 76.5 | 75.2 | 75.7 |
2011 | 82.2 | 88.6 | 93.2 | 92.3 | 78.5 | 76.0 | 75.1 | 80.9 |
2012 | 80.9 | 88.5 | 89.0 | 90.2 | 78.1 | 75.1 | 76.2 | 77.6 |
Among the age groupings of those 35 years and older, women had earnings that ranged from 75 percent to 78 percent of the earnings of their male counterparts. Among younger workers, the earnings differences between women and men were not as great. Among workers who were 25 to 34 years old, women earned 90 percent of what men earned; among 16- to 24-year-olds, women earned 89 percent as much as men.
Between 1979 and 2012, women’s-to-men’s earnings ratios rose for most age groups. Among 25- to 34-year-olds, for example, the ratio increased from 68 percent in 1979 to 90 percent in 2012. The women’s-to-men’s earnings ratio for 45- to 54-year-olds increased from 57 percent to 75 percent.
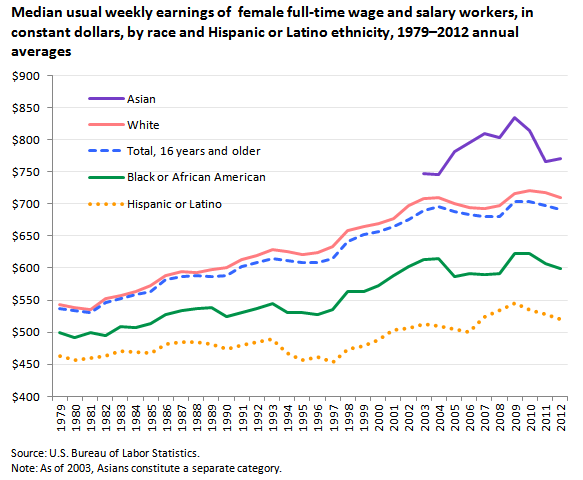
When adjusted for inflation, women’s earnings since 1979 have increased considerably across the major race and Hispanic ethnicity categories. Earnings growth has been largest for White woman, outpacing that of their Black and Hispanic counterparts. Between 1979 and 2012, inflation-adjusted earnings rose by 31 percent for White women, compared with an increase of 20 percent for Black women and 13 percent for Hispanic women.
| Year | Total, 16 years and older | White | Black or African American | Asian(1) | Hispanic or Latino |
|---|---|---|---|---|---|
1979 | $537 | $543 | $499 | – | $463 |
1980 | 533 | 538 | 491 | – | 456 |
1981 | 530 | 535 | 499 | – | 460 |
1982 | 546 | 553 | 495 | – | 463 |
1983 | 553 | 557 | 509 | – | 471 |
1984 | 558 | 564 | 507 | – | 469 |
1985 | 564 | 572 | 513 | – | 468 |
1986 | 582 | 588 | 528 | – | 482 |
1987 | 586 | 594 | 534 | – | 485 |
1988 | 588 | 593 | 537 | – | 485 |
1989 | 587 | 597 | 538 | – | 481 |
1990 | 589 | 601 | 525 | – | 474 |
1991 | 602 | 613 | 531 | – | 480 |
1992 | 609 | 620 | 537 | – | 484 |
1993 | 615 | 628 | 545 | – | 490 |
1994 | 611 | 625 | 530 | – | 467 |
1995 | 608 | 621 | 531 | – | 457 |
1996 | 609 | 624 | 528 | – | 461 |
1997 | 615 | 633 | 535 | – | 454 |
1998 | 641 | 658 | 563 | – | 474 |
1999 | 652 | 665 | 563 | – | 479 |
2000 | 657 | 669 | 572 | – | 488 |
2001 | 664 | 677 | 589 | – | 503 |
2002 | 675 | 698 | 603 | – | 506 |
2003 | 689 | 708 | 613 | $747 | 512 |
2004 | 696 | 710 | 614 | 745 | 509 |
2005 | 688 | 701 | 587 | 782 | 505 |
2006 | 683 | 694 | 591 | 796 | 501 |
2007 | 680 | 693 | 590 | 810 | 524 |
2008 | 680 | 697 | 591 | 803 | 534 |
2009 | 703 | 716 | 623 | 834 | 545 |
2010 | 704 | 720 | 623 | 814 | 535 |
2011 | 698 | 717 | 607 | 766 | 529 |
2012 | 691 | 710 | 599 | 770 | 521 |
| Footnotes:
(1) As of 2003, Asians constitute a separate category.
| |||||
Asian women earned more than their White, Black, and Hispanic or Latino counterparts in 2012. White women ($710) earned 92 percent as much as Asian women ($770), while Black ($599) and Hispanic women ($521) earned 78 percent and 68 percent as much as Asians, respectively.
These data are from the Current Population Survey. Earnings data in this article are median usual weekly earnings of full-time wage and salary workers. To learn more, see "Highlights of Women's Earnings in 2012,” BLS Report 1045 (PDF). Persons whose ethnicity is identified as Hispanic or Latino may be of any race.
Bureau of Labor Statistics, U.S. Department of Labor, The Economics Daily, Women's earnings, 1979–2012 at https://www.bls.gov/opub/ted/2013/ted_20131104.htm (visited November 24, 2025).

