An official website of the United States government
An official website of the United States government
The .gov means it's official.
Federal government websites often end in .gov or .mil. Before sharing sensitive information,
make sure you're on a federal government site.
The site is secure.
The
https:// ensures that you are connecting to the official website and that any
information you provide is encrypted and transmitted securely.
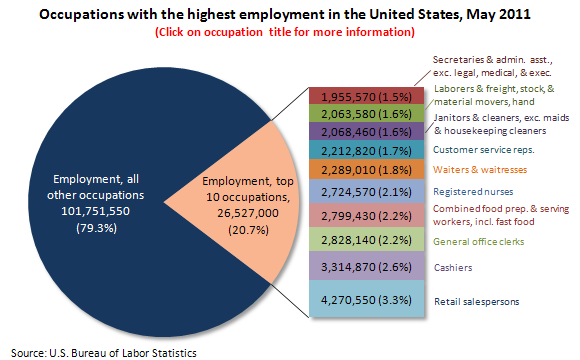
Retail salespersons and cashiers were the occupations with the highest employment in 2011. These two occupations combined made up nearly 6 percent of total U.S. employment.
The 10 largest occupations accounted for more than 20 percent of total employment in May 2011. In addition to retail salespersons and cashiers, the largest occupations included general office clerks; combined food preparation and serving workers, including fast food; registered nurses; waiters and waitresses; and customer service representatives.
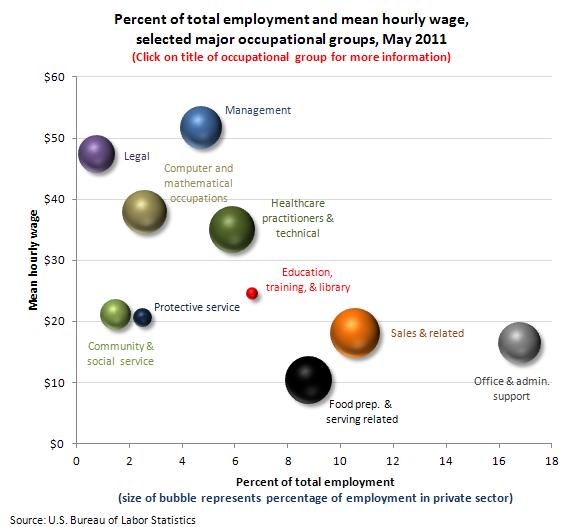
In May 2011, office and administrative support was the largest occupational group, making up nearly 17 percent of total U.S. employment. The next largest groups were sales and related occupations and food preparation and serving related occupations, which made up about 11 and 9 percent of U.S. employment, respectively. Seven of the 10 largest occupations were in one of these three groups.
The smallest occupational groups included legal occupations and life, physical, and social science occupations, each making up less than 1 percent of total employment in May 2011.
The highest paying occupational groups were management, legal, computer and mathematical, and architecture and engineering occupations. Most individual occupations in these groups were also high paying. For example, of the 35 architecture and engineering occupations, only one—surveying and mapping technicians, with an annual mean wage of $42,050—had an average wage below the U.S. all-occupations mean.
Among the 10 largest occupations overall, over 91 percent of employment was in the private sector, with the share of private sector employment ranging from 75 percent of janitors and secretaries to nearly 100 percent of retail salespersons and waiters and waitresses.
These data are from the Occupational Employment Statistics program. To learn more, see, "Occupational Employment and Wages — May 2011" (HTML) (PDF), news release USDL-12-0548.
Bureau of Labor Statistics, U.S. Department of Labor, The Economics Daily, Occupational Employment and Wages — May 2011 at https://www.bls.gov/opub/ted/2012/ted_20120329.htm (visited January 08, 2026).