An official website of the United States government
 United States Department of Labor
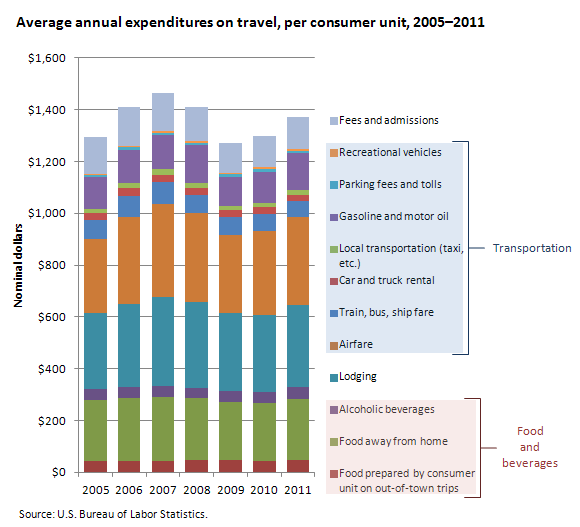
From 2005 to 2011, average annual consumer expenditures on travel for pleasure peaked at $1,462 in 2007, fell to a low of $1,273 in 2009, and then rose to $1,372 in 2011—down 6 percent from their peak.

| Item | 2005 | 2006 | 2007 | 2008 | 2009 | 2010 | 2011 |
|---|---|---|---|---|---|---|---|
Total trip spending | $1,293 | $1,408 | $1,462 | $1,411 | $1,273 | $1,300 | $1,372 |
Food and beverages | 320 | 329 | 332 | 327 | 313 | 309 | 329 |
Food prepared by consumer unit on out-of-town trips | 41 | 43 | 43 | 49 | 49 | 43 | 48 |
Food away from home | 236 | 243 | 246 | 238 | 223 | 223 | 236 |
Alcoholic beverages | 42 | 43 | 44 | 40 | 42 | 43 | 45 |
Lodging | 294 | 321 | 343 | 329 | 300 | 299 | 315 |
Transportation | 538 | 610 | 643 | 622 | 543 | 570 | 603 |
Airfare | 285 | 335 | 360 | 343 | 301 | 325 | 342 |
Train, bus, ship fare | 73 | 83 | 84 | 71 | 72 | 65 | 62 |
Car and truck rental | 27 | 28 | 28 | 27 | 25 | 26 | 23 |
Local transportation (taxi, etc.) | 18 | 21 | 21 | 20 | 17 | 17 | 20 |
Gasoline and motor oil | 121 | 129 | 132 | 146 | 110 | 119 | 141 |
Parking fees and tolls | 10 | 10 | 10 | 10 | 11 | 11 | 10 |
Recreational vehicles | 4 | 5 | 7 | 4 | 6 | 7 | 5 |
Fees and admissions | 141 | 148 | 145 | 134 | 116 | 122 | 125 |
From 2005 to 2011, the major components of travel expenditures—food and alcoholic beverages, transportation, lodging, and fees and admissions—showed similar spending patterns. The largest component, transportation, experienced the most pronounced spending pattern—starting with annual average expenditures of $538 in 2005, peaking at $643 in 2007, falling to a low of $543 in 2009, and then steadily climbing to $603 in 2011.
For consumers reporting them, expenditures on travel for pleasure averaged $4,700 in 2011—compared to an average of $1,372 per consumer unit for all consumers.
These data are from the Consumer Expenditures Survey. Consumer units include families, single persons living alone or sharing a household with others but who are financially independent, or two or more persons living together who share expenses. To learn more, see "Travel expenditures, 2005–2011: spending slows during recent recession" (HTML) (PDF), Beyond the Numbers, December 2012.
Bureau of Labor Statistics, U.S. Department of Labor, The Economics Daily, Travel expenditures during the recent recession, 2005–2011 at https://www.bls.gov/opub/ted/2013/ted_20130115.htm (visited October 30, 2025).

