
An official website of the United States government
An official website of the United States government
The .gov means it's official.
Federal government websites often end in .gov or .mil. Before sharing sensitive information,
make sure you're on a federal government site.
The site is secure.
The
https:// ensures that you are connecting to the official website and that any
information you provide is encrypted and transmitted securely.
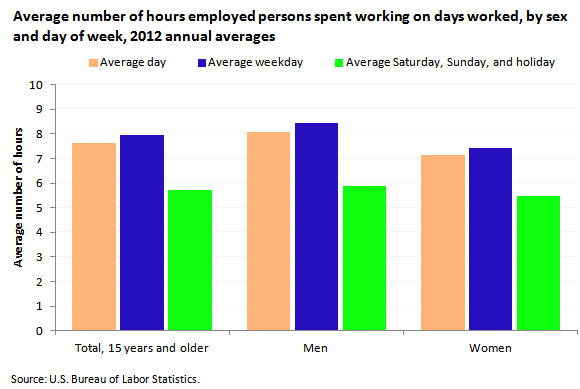
In 2012, employed persons worked an average of 7.7 hours on the days they worked. More hours were worked, on average, on weekdays than on weekend days—8.0 hours compared with 5.7 hours. Many more people worked on weekdays than on weekend days—83 percent of employed persons worked on an average weekday, compared with 34 percent on an average weekend day.
| Characteristic | Average hours of work | ||
|---|---|---|---|
| Employed persons who worked on an average day | Employed persons who worked on an average weekday | Employed persons who worked on an average Saturday, Sunday, and holiday | |
Total, 15 years and older | 7.65 | 7.97 | 5.71 |
Men | 8.07 | 8.44 | 5.90 |
Women | 7.16 | 7.44 | 5.48 |
On the days they worked, employed men worked 55 minutes more than employed women. This difference partly reflects women’s greater likelihood of working part time.
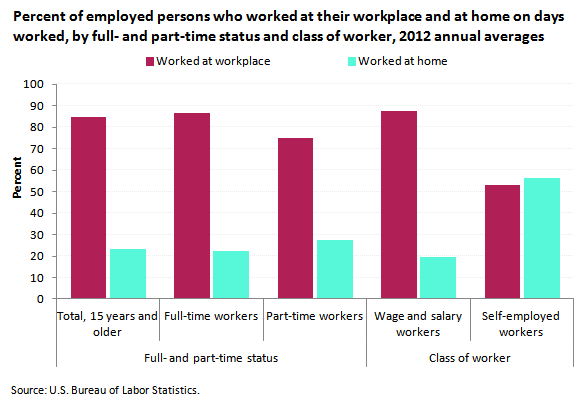
On the days they worked, 85 percent of employed persons did some or all of their work at their workplace and 23 percent did some or all of their work at home. They spent more time working at the workplace than at home—7.9 hours compared with 3.0 hours. Also, 22 percent of full-time workers did some or all of their work at home on days they worked, compared with 27 percent of part-time workers.
| Characteristic | Percent of those who worked | |
|---|---|---|
| Employed persons who worked at their workplace on an average day | Employed persons who worked at home on an average day | |
Full- and part-time status | ||
Total, 15 years and older | 84.5 | 23.2 |
Full-time workers | 86.8 | 22.3 |
Part-time workers | 74.8 | 27.3 |
Class of worker | ||
Wage and salary workers | 87.4 | 19.7 |
Self-employed workers | 53.2 | 56.1 |
Self-employed workers were nearly three times more likely than wage and salary workers to have done some work at home on days worked—56 percent compared with 20 percent.
These data are from the American Time Use Survey. For more information, see "American Time Use Survey — 2012 Results" (HTML) (PDF), news release USDL‑13‑1178. "Working at home" includes any time persons did work at home and is not restricted to persons whose usual workplace is their home.
Bureau of Labor Statistics, U.S. Department of Labor, The Economics Daily, Time spent working in 2012 at https://www.bls.gov/opub/ted/2013/ted_20130716.htm (visited April 01, 2026).
