
An official website of the United States government
An official website of the United States government
The .gov means it's official.
Federal government websites often end in .gov or .mil. Before sharing sensitive information,
make sure you're on a federal government site.
The site is secure.
The
https:// ensures that you are connecting to the official website and that any
information you provide is encrypted and transmitted securely.
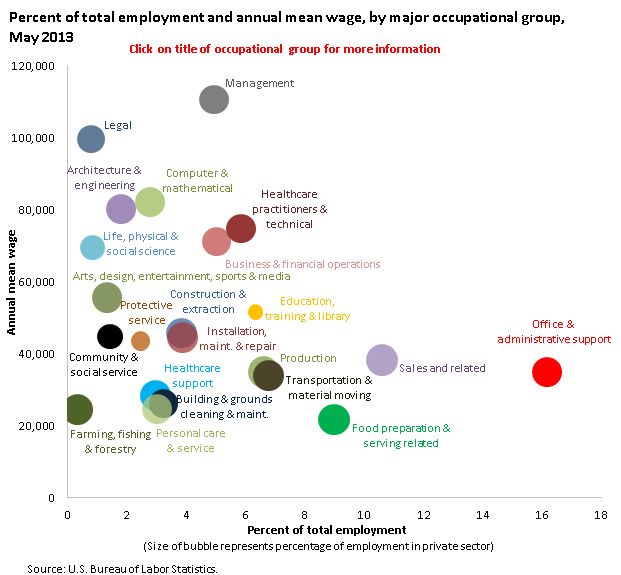
In May 2013, office and administrative support was the largest occupational group, making up nearly 16 percent of total U.S. employment. The next largest groups were sales and related occupations and food preparation and serving related occupations, which made up about 11 and 9 percent, respectively. Seven of the 10 largest occupations were in one of these three groups.
| Occupational group | Percent of total U.S. employment | Annual mean wage | Percent employed in private sector |
|---|---|---|---|
Office and Administrative Support | 16.2 | $34,900 | 84.9 |
Sales and Related | 10.6 | 38,200 | 99.4 |
Food Preparation and Serving Related | 9.0 | 21,580 | 95.4 |
Transportation and Material Moving | 6.8 | 33,860 | 92.9 |
Production | 6.6 | 34,930 | 97.9 |
Education, Training, and Library | 6.3 | 51,500 | 24.0 |
Healthcare Practitioners and Technical | 5.8 | 74,740 | 85.0 |
Business and Financial Operations | 5.0 | 71,020 | 82.4 |
Management | 4.9 | 110,550 | 84.6 |
Installation, Maintenance, and Repair | 3.9 | 44,420 | 89.6 |
Construction and Extraction | 3.8 | 45,630 | 90.6 |
Building and Grounds Cleaning and Maintenance | 3.2 | 26,010 | 83.1 |
Personal Care and Service | 3.0 | 24,710 | 88.3 |
Healthcare Support | 3.0 | 28,300 | 92.4 |
Computer and Mathematical | 2.8 | 82,010 | 88.9 |
Protective Service | 2.5 | 43,510 | 37.8 |
Architecture and Engineering | 1.8 | 80,100 | 87.2 |
Community and Social Service | 1.4 | 44,710 | 61.9 |
Arts, Design, Entertainment, Sports, and Media | 1.3 | 55,580 | 89.0 |
Life, Physical, and Social Science | 0.9 | 69,400 | 60.6 |
Legal | 0.8 | 99,620 | 74.6 |
Farming, Fishing, and Forestry | 0.3 | 24,330 | 94.2 |
The smallest occupational groups included legal occupations and life, physical, and social science occupations, each making up less than 1 percent of total employment in May 2013.
The highest-paying occupational groups were management, legal, computer and mathematical, and architecture and engineering occupations. Most detailed occupations in these groups were also high paying. For example, all 19 computer and mathematical occupations had average wages above the U.S. all-occupations mean of $46,440, ranging from $50,450 for computer user support specialists to $109,260 for computer and information research scientists.
The lowest-paying occupational groups were food preparation and serving related; farming, fishing, and forestry; personal care and service; building and grounds cleaning and maintenance; and healthcare support occupations. Annual mean wages for these groups ranged from $21,580 for food preparation and serving related occupations to $28,300 for healthcare support occupations. With few exceptions, the detailed occupations in these groups had below-average wages. For example, occupational therapy assistants and physical therapy assistants were the only healthcare support occupations with mean wages above the U.S. all-occupations mean.
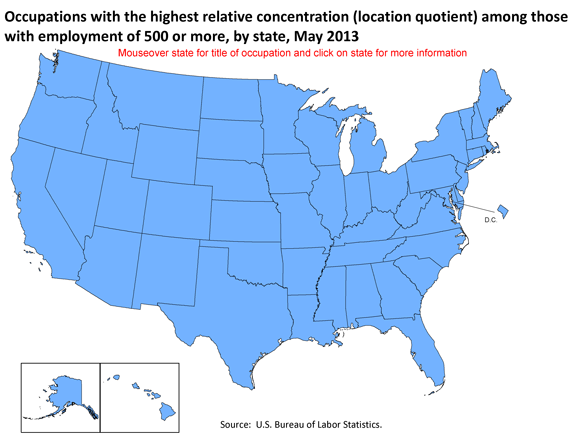
Among 665,850 employed persons in the District of Columbia in May 2013, there were about 3,370 political scientists—accounting for 50.6 out of every 10,000 jobs in the District of Columbia. In all of the United States there were 5,570 political scientists employed out of a total of 132,588,810 employed people—meaning less than 1 (0.42) out of every 10,000 jobs in America were political scientists. The ratio that compares the concentration of employment in a defined area (in this case, the District of Columbia) to that of a larger area (the United States) is referred to by the Bureau of Labor Statistics as the "location quotient."
| State | Occupation | Location quotient | Employment |
|---|---|---|---|
|
Alabama |
Layout workers, metal and plastic | 9.05 | 1,690 |
|
Alaska |
Zoologists and wildlife biologists | 18.65 | 840 |
|
Arizona |
Plasterers and stucco masons | 4.37 | 1,680 |
|
Arkansas |
Shoe machine operators and tenders | 13.35 | 500 |
|
California |
Farmworkers and laborers, crop, nursery, and greenhouse | 5.89 | 171,160 |
|
Colorado |
Atmospheric and space scientists | 9.65 | 1,800 |
|
Connecticut |
Actuaries | 5.17 | 1,280 |
|
Delaware |
Chemists | 12.70 | 3,460 |
|
District of Columbia |
Political scientists | 120.46 | 3,370 |
|
Florida |
Motorboat operators | 8.30 | 1,590 |
|
Georgia |
Textile winding, twisting, and drawing out machine setters, operators, and tenders | 10.49 | 7,990 |
|
Hawaii |
Dancers | 12.83 | 670 |
|
Idaho |
Forest and conservation technicians | 15.58 | 2,140 |
|
Illinois |
Rail transportation workers, all other | 5.67 | 870 |
|
Indiana |
Boilermakers | 6.39 | 2,190 |
|
Iowa |
Soil and plant scientists | 12.81 | 1,900 |
|
Kansas |
Agricultural equipment operators | 5.41 | 1,240 |
|
Kentucky |
Roof bolters, mining | 14.14 | 1,120 |
|
Louisiana |
Riggers | 19.95 | 4,920 |
|
Maine |
Logging equipment operators | 11.15 | 1,200 |
|
Maryland |
Subway and streetcar operators | 12.02 | 2,050 |
|
Massachusetts |
Biochemists and biophysicists | 5.38 | 3,850 |
|
Michigan |
Model makers, metal and plastic | 6.12 | 1,140 |
|
Minnesota |
Food scientists and technologists | 6.78 | 2,060 |
|
Mississippi |
Upholsterers | 16.76 | 3,940 |
|
Missouri |
Entertainment attendants and related workers, all other | 3.91 | 750 |
|
Montana |
Forest and conservation technicians | 20.73 | 2,040 |
|
Nebraska |
Meat, poultry, and fish cutters and trimmers | 10.33 | 11,620 |
|
Nevada |
Gaming supervisors | 31.98 | 6,990 |
|
New Hampshire |
Metal workers and plastic workers, all other | 11.80 | 1,230 |
|
New Jersey |
Marriage and family therapists | 4.98 | 4,170 |
|
New Mexico |
Physical scientists, all other | 12.03 | 1,660 |
|
New York |
Fashion designers | 6.34 | 7,180 |
|
North Carolina |
Textile winding, twisting, and drawing out machine setters, operators, and tenders | 8.88 | 6,880 |
|
North Dakota |
Extraction workers, all other | 35.75 | 910 |
|
Ohio |
Foundry mold and coremakers | 3.54 | 1,790 |
|
Oklahoma |
Gaming managers | 12.74 | 670 |
|
Oregon |
Logging workers, all other | 40.15 | 1,390 |
|
Pennsylvania |
Gas compressor and gas pumping station operators | 4.66 | 890 |
|
Rhode Island |
Jewelers and precious stone and metal workers | 7.05 | 560 |
|
South Carolina |
Tire builders | 11.80 | 2,860 |
|
South Dakota |
Pesticide handlers, sprayers, and applicators, vegetation | 9.44 | 650 |
|
Tennessee |
Nuclear technicians | 4.94 | 700 |
|
Texas |
Petroleum engineers | 6.84 | 19,660 |
|
Utah |
Mine cutting and channeling machine operators | 8.36 | 540 |
|
Vermont |
Highway maintenance workers | 4.76 | 1,490 |
|
Virginia |
Legal support workers, all other | 7.15 | 8,950 |
|
Washington |
Aircraft structure, surfaces, rigging, and systems assemblers | 15.68 | 14,310 |
|
West Virginia |
Mine shuttle car operator | 76.87 | 1,120 |
|
Wisconsin |
Foundry mold and coremakers | 6.26 | 1,670 |
|
Wyoming |
Wellhead pumpers | 24.75 | 700 |
The location quotient of political scientists in the District of Columbia is 50.6 divided by 0.42 (the location quotient of political scientists in the United States), which equals about 120.5—indicating there are about 120.5 times as many political scientists per 10,000 total employed people in the District of Columbia as in the United States as a whole.
These data are from the Occupational Employment Statistics program. To learn more, see, "Occupational Employment and Wages — May 2013" (HTML) (PDF), news release USDL-14-0528.
Bureau of Labor Statistics, U.S. Department of Labor, The Economics Daily, Office and administrative support occupations make up nearly 16 percent of U.S. employment, May 2013 at https://www.bls.gov/opub/ted/2014/ted_20140409.htm (visited November 03, 2025).

