
An official website of the United States government
 United States Department of Labor
An official website of the United States government
United States Department of Labor

The .gov means it's official.
Federal government websites often end in .gov or .mil. Before sharing sensitive information,
make sure you're on a federal government site.

The site is secure.
The
https:// ensures that you are connecting to the official website and that any
information you provide is encrypted and transmitted securely.


This page contains information on the earnings of employed persons derived from the Current Population Survey (CPS). Data on employed and unemployed persons, hours of work, and other demographic and labor force characteristics also are available.
On This Page
Data measure usual hourly and weekly earnings of wage and salary workers. All self-employed persons are excluded, regardless of whether their businesses are incorporated. Data represent earnings before taxes and other deductions and include any overtime pay, commissions, or tips usually received. The earnings data are collected from one-fourth of the CPS total sample of approximately 60,000 households. Data are published quarterly. Learn more about CPS earnings concepts and definitions.
Earnings data are available by demographic characteristics such as age, sex, race, and Hispanic or Latino ethnicity. See also Earnings by education and Employment and unemployment by demographics.
This comprehensive report includes earnings for men and women, with demographic characteristics such as age, education, race, and Hispanic or Latino ethnicity.
Earlier years (PDF only):
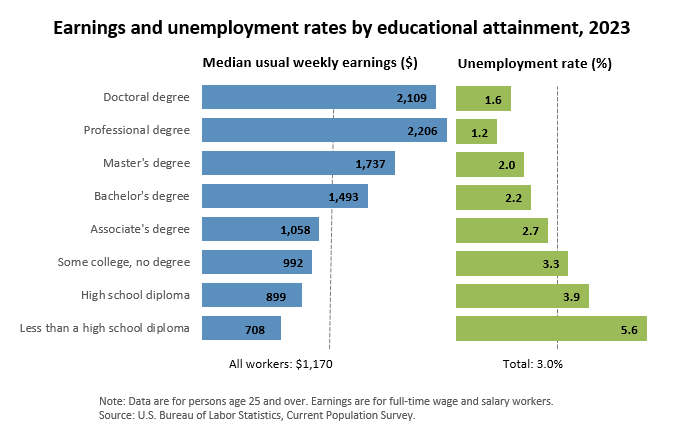
Data measure usual hourly and weekly earnings of wage and salary workers 25 years and over by educational attainment. See also Employment and unemployment by educational attainment.
Data pertain only to workers who are paid hourly rates; salaried and other workers not paid by the hour are excluded. Hourly-paid workers make up approximately three-fifths of all wage and salary workers. See also Minimum wage workers.
Statistics on hourly-paid workers with earnings at or below the prevailing Federal minimum wage.
HTML | - | - | |||||||||||||||||||||
- | - | - | |||||||||||||||||||||
XLSX tables | - | - | - | - | - | - | - | - | - | - | - | - | - |
Data measure usual hourly and weekly earnings of wage and salary workers by occupation and by industry. See also Employment by occupation and industry.
Median weekly earnings for union and non-union full-time wage and salary workers are published annually. Occupation and industry detail is available and, additionally, demographic characteristics such as age, sex, race, and Hispanic ethnicity. See also Union members.
Annual report on persons who, during the year, spent 27 weeks or more in the labor force (working or looking for work), but whose incomes still fell below the official poverty level.
- | - | - | - | - | ||||||||||||||||||||||||
HTML | - | - | - | - | - | - | - | - | - | - | - | - | - | |||||||||||||||
XLSX tables | - | - | - | - | - | - | - | - | - | - | - | - | - | - | - | - | - | - | - | - | - | - |
Last Modified Date: July 29, 2026