
An official website of the United States government
An official website of the United States government
The .gov means it's official.
Federal government websites often end in .gov or .mil. Before sharing sensitive information,
make sure you're on a federal government site.
The site is secure.
The
https:// ensures that you are connecting to the official website and that any
information you provide is encrypted and transmitted securely.
| Date Added * | BLS Program | Product Type | Title | Description | Correction Status |
|---|---|---|---|---|---|
| 05/03/2024 | Business Employment Dynamics | The Economics Daily |
Small businesses contributed 55 percent of the total net job creation from 2013 to 2023 |
The upper limit of the number of employees defining a firm as a "small business" was incorrecty stated. |
Corrections made on 05/03/2024. |
| 05/02/2024 | Consumer Price Index | Database |
Index and average price data for electricity in Chicago-Naperville-Elgin, IL-IN-WI for January 2024 through March 2024 were incorrectly published in the database. The incorrect values will be removed from the database on 5/15/2024. The following data series were affected:
|
Corrections to be made on 06/12/2024. | |
| 04/25/2024 | Productivity | Database; News release; Other |
Productivity and Costs (R) Fourth Quarter and Annual Averages 2023 Major sectors labor productivity (XLSX) |
Some productivity data series were incorrect in materials published on March 7, 2024. The incorrect data were included in the Productivity and Costs (R) Fourth Quarter and Annual Averages 2023 news release, as well as in the related data tables, charts, and database. A computation error in Off the Clock (OTC) hours worked ratios biased downward the labor hours levels underlying the Productivity and Costs news release. This error affected quarterly and annual hours worked data and all labor-related measures, including labor productivity, from first quarter 2019 through fourth quarter 2023 in all sectors. The corrected data will be published in the data tables, charts, and database on May 2, 2024. The corrected data will also be reflected in the upcoming Productivity and Costs (P) First Quarter 2024 release on May 2, 2024. See this table for more information on the corrections. |
Corrections to be made on 05/02/2024. |
| 04/19/2024 | Employment, Hours, and Earnings from the Current Employment Statistics survey (National) | Other |
Some data in the files cesvin[SS].xlsx (where [SS] is the 2-digit super sector) and cesvin_template.xlsx were incorrect. Several rows of formulas referenced the incorrect cell from the vintage data located in the "triangle" within the same file. The vintage data in the "triangle" are correct, however. The top few rows in light blue returned incorrect values for the Data, Revisions, OTM (over the month) Data, and OTM Revisions tabs. Additionally, the Total Revisions and Total OTM Change columns in the Revisions, OTM Data, and OTM Revisions tabs were not pulling complete data. The files were removed on April 19, 2024, and will be republished once corrections are complete. |
Corrections to be made on 04/26/2024. | |
| 04/16/2024 | Productivity | Database; Other |
Detailed industries, service-providing industries, and productivity database |
As published on March 14, 2024, data for the industries within publishing, except internet (NAICS 511) from 2013–22 reflected incorrect estimates of the proportion of nonemployer revenue distributed to underlying industries. The affected data were indexes, levels, and annual rates of change for 2013 through 2022 included in detailed industries and service-providing industries XLSX files and in the BLS database. The corrections are limited to 2013 forward for sectoral output, real sectoral output, labor productivity, unit labor costs, and output per worker. |
Corrections made on 04/16/2024. |
| 04/05/2024 | Job Openings and Labor Turnover Survey | The Economics Daily | Number of unemployed people per job opening unchanged in February for tenth consecutive month |
The data points on the vertical axis of the chart were incorrectly labeled. The chart has been corrected. |
Corrections made on 04/04/2024. |
| 04/01/2024 | Productivity | Other |
As originally published in the capital details rental prices productivity table, units for some measures were incorrectly labeled. Units for the measures of capital investment, productive capital stock, and wealth stock have been corrected to “Millions of 2017 dollars.” Units for the measures of capital cost based on internal rate of return, capital cost based on external rate of return, and capital cost used have been corrected to “Millions of current dollars.” |
Corrections made on 03/26/2024. | |
| 04/01/2024 | Productivity | News release |
In the Total Factor Productivity – 2023 news release, the axis in Chart 3 (Components of combined inputs: capital input, hours worked, and labor composition, 2017-23) was corrected to “Index 2017=100”. |
Corrections made on 04/01/2024. | |
| 03/07/2024 | Local Area Unemployment Statistics | The Economics Daily |
Annual average unemployment rates decreased in 6 states in 2023 |
As initially published, state unemployment rates were displayed with the incorrect year. The map has been corrected. |
Corrections made on 03/06/2024. |
| 02/12/2024 | Consumer Price Index | Database; Other |
12-month percentage change, Consumer Price Index, selected categories |
The 12-month percent change for the shelter index displayed a seasonally adjusted number instead of the reported not seasonally adjusted number over the past several years. The seasonally adjusted and not seasonally adjusted numbers are often the same but can differ slightly in some months. |
Corrections made on 02/13/2024. |
| 02/06/2024 | Employment Cost Index | Monthly Labor Review |
Table 7 has been corrected to include calculations using wage and salary indexes. |
Corrections made on 02/06/2024. | |
| 01/22/2024 | Work Stoppages | News release |
The ownership of the 2019 Stop & Shop Supermarket Co. stoppage was incorrectly categorized as local government instead of private industry. This resulted in incorrect counts of work stoppages by ownership in the Major Work Stoppages in 2019 news release. |
Corrections made on 01/22/2024. | |
| 01/19/2024 | Employment, Hours, and Earnings from the Current Employment Statistics survey (State and Metro Area) | The Economics Daily | Employment increased in 30 large metro areas from November 2022 to November 2023 |
As initially published, the names of the month in the map tooltip and on the data table were not correct. |
Corrections made on 01/19/2024. |
| 01/17/2024 | Business Employment Dynamics | Spotlight on Statistics |
A Spotlight on Statistics article incorrectly stated the number of quarterly news releases published from the Business Employment Dynamics program. The correct number of quarterly releases is 82. |
Corrections made on 01/16/2024. | |
| 01/10/2024 | Labor Force Statistics from the Current Population Survey | Database; Other |
Some seasonally adjusted Current Population Survey data for April 2020–December 2020, including corresponding quarterly data, were incorrectly published in the database when the annual seasonal adjustment 5-year revisions were published on January 5, 2024. Some of the CPS interactive charts and quarterly tables 1, 2, 7, 8, and 10 were also affected. Additionally, some labor force status flows data for April 2020–January 2021 were incorrect in the database. See the list of series affected by this correction. |
Corrections made on 01/10/2024. | |
| 12/13/2023 | Productivity | Other |
Total Factor Productivity, output, and inputs, percent change for major industries |
As originally published, data in this chart incorrectly presented data for 2020 and 2021 for the combined inputs measure, and 2021 for all other measures except Total Factor Productivity. |
Corrections to be made on 12/13/2023. |
| 12/13/2023 | Consumer Expenditure Survey | Other |
Table 7.2 has been updated to reflect the correct estimates on the proportion of online diary placements for third quarter of 2022 and fourth quarter of 2022. The proportion of missing diary placements in Consumer Expenditures (CE) has also been corrected for third quarter of 2022 and fourth quarter of 2022. |
Corrections made on 12/13/2023. | |
| 12/06/2023 | Consumer Price Index | Database |
Error discovered with Excel output of 'Multi-series table' data retrieval option |
The 'Multi-series table' output exported as XLSX files from November 30, 2023 to December 5, 2023 showed incorrect results by placing values into the wrong time periods. If you retrieved data using this method, we recommend that you re-download the data. |
Corrections made on 12/05/2023. |
| 12/06/2023 | Producer Price Indexes | Database |
Error discovered with Excel output of 'Multi-series table' data retrieval option |
The 'Multi-series table' output exported as XLSX files from November 30, 2023 to December 5, 2023 showed incorrect results by placing values into the wrong time periods. If you retrieved data using this method, we recommend that you re-download the data. |
Corrections made on 12/05/2023. |
| 12/06/2023 | Local Area Unemployment Statistics | Database |
Error discovered with Excel output of 'Multi-series table' data retrieval option |
The 'Multi-series table' output exported as XLSX files from November 30, 2023 to December 5, 2023 showed incorrect results by placing values into the wrong time periods. If you retrieved data using this method, we recommend that you re-download the data. |
Corrections made on 12/05/2023. |
| 12/05/2023 | Consumer Price Index | Database |
Index and average price data for electricity including related aggregate data within Washington, D.C. for January through October 2023 were incorrectly published in the database. The following LABSTAT series IDs for the areas, categories, and periods (months or half years), were incorrect and will be removed from the database on December 12, 2023:
|
Corrections made on 02/13/2024. | |
| 11/09/2023 | Injuries, Illnesses, and Fatalities | News release |
The count and annualized incidence rate for educational services for “other diseases due to viruses, not elsewhere classified” were incorrect in table 6. |
Corrections made on 11/09/2023. | |
| 11/02/2023 | Employer Costs for Employee Compensation | News release |
Employer Costs for Employee Compensation News Release Tables |
In the XLSX version of the June 2023 Employer Costs for Employment Compensation news release tables, cell A21 in tables 2-7 was incorrectly labeled “Health”. The file has been revised to correct the labels. |
Corrections made on 11/03/2023. |
| 10/27/2023 | Office of Publications and Special Studies | The Economics Daily |
Import air passenger fares rose 6.2 percent for the year ended in June 2023 |
The last sentence of the second paragraph was corrected to indicate that outbound air freight prices declined 22.4 percent for the year ended in June. The original version mistakenly referenced inbound air freight prices. |
Corrections made on 10/19/2023. |
| 09/15/2023 | Productivity | News release |
The BLS Productivity program discovered processing errors for the 2023 quarter one and two estimates of hours worked, hourly compensation and labor productivity for the nonfarm business, business, and nonfinancial corporate sectors. The errors stemmed from an error in an adjustment to hours in one industry. |
Corrections to be made on 09/18/2023. | |
| 09/14/2023 | Labor Force Statistics from the Current Population Survey | The Economics Daily | 60.2 percent of youth participated in the labor force in July 2023 |
As initially published, the industry titles in the second chart did not correspond to the employment numbers. The chart has been corrected. |
Corrections made on 09/14/2023. |
| 09/08/2023 | Labor Force Statistics from the Current Population Survey | BLS Reports |
The average annual estimate for Married-couple families, Asian, with at least one family member unemployed, some family member(s) employed full-time, on table 10 of this report was incorrectly calculated as initially published. |
Corrections made on 08/04/2023. | |
| 09/08/2023 | Labor Force Statistics from the Current Population Survey | BLS Reports |
Some average annual estimates from table 10 of this report were incorrectly calculated as initially published:
|
Corrections made on 08/04/2023. | |
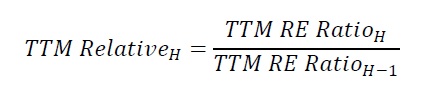
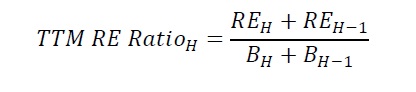
| 08/24/2023 | Consumer Price Index | Other |
When this webpage was first published on 08/22/2023 the equation for the TTM sequential relative was incorrectly shown as a duplicate of the equation for the TTM retained earnings ratio. |
Corrections made on 08/23/2023. | |
| 08/11/2023 | Work Stoppages | Database |
Work stoppages data for 2007 and 2022 were incorrectly published in the database. The following series were affected:
|
Corrections made on 08/11/2023. | |
| 08/11/2023 | Work Stoppages | Other |
This table was updated to reflect the correct number of annual 2022 days of idleness (in thousands) as 2,194.5. |
Corrections made on 08/11/2023. | |
| 08/11/2023 | Employment, Hours, and Earnings from the Current Employment Statistics survey (State and Metro Area) | Database | Employment, Hours, and Earnings – State and Metropolitan Area Database |
Data for six hours and earnings series were incorrectly published in the BLS database. More information about the affected series is available at www.bls.gov/bls/errata/sae_errata.htm. |
Corrections made on 08/11/2023. |
| 07/21/2023 | Employment, Hours, and Earnings from the Current Employment Statistics survey (State and Metro Area) | Database; News release |
Employment, Hours, and Earnings – State and Metropolitan Area Database State Employment and Unemployment – January 2023 State Employment and Unemployment – February 2023 State Employment and Unemployment – March 2023 State Employment and Unemployment – April 2023 State Employment and Unemployment – May 2023 Metropolitan Area Employment and Unemployment – January 2023 Metropolitan Area Employment and Unemployment – February 2023 Metropolitan Area Employment and Unemployment – March 2023 |
Data for California were incorrectly published in the BLS database and in news release text and tables. More information about the affected series is available at www.bls.gov/bls/errata/sae_errata.htm. |
Corrections made on 07/21/2023. |
| 06/16/2023 | Employment, Hours, and Earnings from the Current Employment Statistics survey (State and Metro Area) | News release; Database |
Employment, Hours, and Earnings – State and Metropolitan Area Database State Employment and Unemployment – January 2023 State Employment and Unemployment – February 2023 State Employment and Unemployment – March 2023 State Employment and Unemployment – April 2023 Metropolitan Area Employment and Unemployment – January 2023 Metropolitan Area Employment and Unemployment – February 2023 |
Some employment data for Colorado were incorrectly published in the BLS database and in news release tables. The text and analysis of the releases are correct as originally published. More information about the affected series is available at www.bls.gov/bls/errata/sae_errata.htm. |
Corrections made on 06/16/2023. |
| 05/12/2023 | Injuries, Illnesses, and Fatalities | Database; Other |
Data on nonfatal occupational injuries and illnesses for 2021 for the mining industry (NAICS 212) were incorrectly published in the BLS database and some tables. These estimates were for the states of Alaska, California, Indiana, New Mexico, and Pennsylvania. See the list of series affected by this correction. |
Corrections made on 05/12/2023. | |
| 04/24/2023 | Producer Price Indexes; Consumer Price Index | Monthly Labor Review |
Automotive dealerships 2019–22: dealer markup increases drive new-vehicle consumer inflation |
Several numbers have been corrected in the paragraph that follows chart 8. There were also small changes to numbers in chart 5 and table 3 for the fourth quarter of 2022, which did not affect the overall trend of the data. | Corrections made on 05/23/2023. |
| 04/21/2023 | Employment, Hours, and Earnings from the Current Employment Statistics survey (State and Metro Area) | Database; News release |
Employment, Hours, and Earnings – State and Metropolitan Area Database State Employment and Unemployment – January 2023 State Employment and Unemployment – February 2023 Metropolitan Area Employment and Unemployment – January 2023 Metropolitan Area Employment and Unemployment – February 2023 |
Some data for Arkansas and New York were incorrectly published in the BLS database and in news release tables. The text and analysis of the releases are correct as originally published. More information about the affected series is available at www.bls.gov/bls/errata/sae_errata.htm. |
Corrections made on 04/21/2023. |
| 04/12/2023 | Consumer Price Index | Database |
Index and average price data for electricity in St. Louis for January 2023 were incorrectly published in the database. The error also affects related aggregate data in this area along with the Midwest Size Class A and the West North Central division areas. See the list of series affected by this correction. |
Corrections made on 04/28/2023. | |
| 04/06/2023 | Injuries, Illnesses, and Fatalities | Database |
Nonfatal occupation injury and illness incidence rates for 2020 and "EH5 Medical treatment facility visits by detailed occupation" table |
Some nonfatal occupation injury and illness incidence rates for 2020 were calculated using imputed rather than actual hours worked. This resulted in a limited number of published estimates in the BLS database that were incorrect. See the list of series ids affected by this errata. These estimates were removed from the database on April 6, 2023. Additionally, some national estimates reflected in the "EH5 Medical treatment facility visits by detailed occupation" table were affected. See the list of Standard Occupational Classification (SOC) categories that were affected in that table. In the news release, the incidence rate for stockers and order fillers in table 4 and chart 3 was incorrect and was removed on April 6, 2023. There were 3 data tables affected, and estimates were removed from these tables on March 28, 2023:
|
No Corrections will be made. |
| 04/05/2023 | Employment, Hours, and Earnings from the Current Employment Statistics survey (State and Metro Area) | Database |
Employment, Hours, and Earnings – State and Metropolitan Area Database |
Some hours and earnings data for Colorado were incorrectly published in the BLS database. More information about the affected series is available at www.bls.gov/bls/errata/sae_errata.htm. |
Corrections made on 04/05/2023. |
| 03/29/2023 | Employment, Hours, and Earnings from the Current Employment Statistics survey (State and Metro Area) | Database |
Employment, Hours, and Earnings – State and Metropolitan Area Database |
Some hours and earnings data for Massachusetts were incorrectly published in the BLS database. More information about the affected series is available at www.bls.gov/bls/errata/sae_errata.htm. | Corrections made on 03/24/2023. |
| 03/16/2023 | Labor Force Statistics from the Current Population Survey | BLS Reports |
Table 6 of this datebook contained multiple subcategories labeled "With children under 18 years old" that have been corrected to "With children ages 6 to 17, none younger." The data in the table remain correct. |
Corrections made on 03/16/2023. | |
| 03/13/2023 | Consumer Price Index | Database |
Index and average price data for electricity in Detroit for January 2023 were incorrectly published in the database. The error also includes related aggregate data within this area. The following series were affected:
|
Corrections made on 04/28/2023. | |
| 02/23/2023 | Consumer Price Index | Other |
Two tables that were published on February 15, 2023, measuring the impact of the annual weight revision to the Consumer Price Index contained incorrect data and were removed. BLS has corrected both tables and republished them. |
Corrections made on 04/28/2023. | |
| 01/31/2023 | Injuries, Illnesses, and Fatalities | Database |
Nonfatal Injury and illness estimates for Rail transportation NAICS 482 for New York for 2020 were mistakenly published. |
Corrections made on 01/31/2023. | |
| 01/20/2023 | Consumer Price Index | Spotlight on Statistics |
Inflation Experiences for Lower and Higher Income Households |
In the text on slide 2, the 2018 median household income for all urban consumer income levels has been corrected to $55,000. | Corrections made on 01/20/2023. |
| 01/12/2023 | Consumer Expenditure Survey | BLS Reports |
The year was corrected from 2020 to 2021 in the sentence, “In each successive month of 2021, inflation had been on a continual upward trend, beginning with a 12-month percent change of 1.4 percent in January and reaching 7.0 percent in December.” |
Corrections made on 01/12/2023. | |
| 01/10/2023 | Consumer Price Index | Database | Index and average price data for electricity in Miami for January through November 2022 were incorrectly published in the database. Index and average price data for electricity in Los Angeles and Riverside for May through November 2022 also were incorrectly published in the database. Utility (piped) gas for San Diego in November through December 2022 were also incorrect. The error includes related aggregate data within these and several related areas. See the list of series affected by this correction. | Corrections made on 04/28/2023. | |
| 12/01/2022 | Consumer Price Index | Beyond the Numbers | Exploring price increases in 2021 and previous periods of inflation |
A Consumer Price Index series for rent was mislabeled as shelter in table 1 and in the text referring to table 1. This mislabeling has been corrected. |
Corrections made on 12/01/2022. |
| 11/30/2022 | Consumer Price Index | Database |
|
BLS inadvertently published an index number for October 2022 that did not meet Consumer Price Index publication criteria. The data series was for food at elementary and secondary schools. The value for October 2022 has been removed from the database for the following series:
|
Corrections made on 11/30/2022. |
| 11/28/2022 | Local Area Unemployment Statistics | The Economics Daily |
In the sentence, “All 50 states and the District of Columbia had unemployment rate decreases from September 2021 to September 2022” the first reference to the month was corrected. |
Corrections made on 11/25/2022. | |
| 11/21/2022 | Consumer Price Index | Database |
Consumer Price Index and average price data for the following series in Miami for September 2022 were incorrectly published in the database. The following series were affected:
|
Corrections made on 11/21/2022. | |
| 11/14/2022 | Productivity and Costs | The Economics Daily |
Productivity down 1.4 percent, real hourly compensation down 3.4 percent, over past year |
The last sentence of the second paragraph was corrected to indicate that there was a decrease of 1.4 percent in labor productivity from the third quarter 2021 to the third quarter of 2022. |
Corrections made on 11/14/2022. |
| 11/03/2022 | Consumer Price Index | Database |
Index and average price data for Consumer Price Index series in the Chicago area for June through September 2022 were incorrectly published in the database. See the list of series affected by this correction. |
Corrections made on 11/21/2022. | |
| 09/26/2022 | Consumer Price Index | Spotlight on Statistics | The graphic in slide 4 has been updated to reflect the correct data on lease terms in Wisconsin and Wyoming. | Corrections made on 09/26/2022. | |
| 09/12/2022 | Employment Projections | Other | Table 1.1A Employment by major occupational group, 2021, and projected 2031, including adjustments for realized gains (HTML) (XLSX) |
The "Employment change, percent, 2021–31, excluding realized gains" column of table 1.1A referenced incorrect data when initially published. The column has been updated to reflect the correct data. |
Corrections made on 09/09/2022. |
| 09/08/2022 | Consumer Expenditure Survey | Other; News release | Headline on the www.bls.gov homepage for Consumer Expenditures — 2021 news release. |
The headline that appeared on the BLS homepage the morning of September 8, 2022, incorrectly said average consumer expenditures in 2021 had decreased from 2020, but they had actually increased. The headline has been corrected. |
Corrections made on 09/08/2022. |
| 09/07/2022 | Consumer Price Index | Database |
Average Price data for electricity in several areas for July 2022 were incorrectly published in the database. Corrected data were published after the release of the Consumer Price Index data for August. The following series were affected:
|
Corrections made on 09/16/2022. | |
| 08/11/2022 | Consumer Price Index | Database |
The base period labels were incorrect in the database for four Consumer Price Index series. The data shown for these series are correct as originally published in the database, as well as in the news release and other tables. The base period labels for the following series were corrected August 11, 2022:
|
Corrections made on 08/11/2022. | |
| 06/30/2022 | Local Area Unemployment Statistics | Database |
|
Small-area employment inputs for five areas in Maryland were corrected for January and February 2022. Due to additivity to the state level, these corrections resulted in minor changes to employment and labor force series for all areas in Maryland, as well as shared interstate areas with Delaware, the District of Columbia, and Pennsylvania. Unemployment rates were affected in a small number of areas, and no area had an unemployment rate change larger than 0.3 percentage point. These estimates were corrected in the LABSTAT database on June 29, 2022. |
Corrections made on 06/29/2022. |
| 06/23/2022 | Import/Export Price Indexes | News release |
There was an error on page 3 of the release concerning the last time capital goods export prices had a larger 12-month increase. That has been corrected. |
Corrections made on 06/23/2022. | |
| 06/22/2022 | Employment, Hours, and Earnings from the Current Employment Statistics survey (National) | Monthly Labor Review |
Corrections to this article were made on June 22, 2022. Tables A-2, A-5, A-8, and A-9 have been corrected to include the phrase “normal treatment” in place of “additive outlier only” in their titles. Tables A-3, A-6, A-8, and A-10 have been corrected to include the phrase "additional intervention" in place of "all outlier types" in their titles. |
Corrections made on 06/22/2022. | |
| 05/27/2022 | Quarterly Census of Employment and Wages | Other |
Supplemental Files for County Employment and Wages News Release |
Three files with incorrect Quarterly Census of Employment and Wages data for fourth quarter 2021 were released on May 25, 2022. The files were corrected on May 26, 2022. |
Corrections made on 05/26/2022. |
| 04/01/2022 | Business Employment Dynamics | Spotlight on Statistics |
The Decline in Employment Dynamism Over the Last Three Decades |
The final sentence in slide 9 has been updated to correct the number of states with a drop of less than 10 percent. |
Corrections made on 04/01/2022. |
| 03/25/2022 | Employment, Hours, and Earnings from the Current Employment Statistics survey (State and Metro Area) | Database |
Employment, Hours, and Earnings – State and Metropolitan Area Database |
Some employment data for Arizona, Maine, and Wyoming were incorrectly published in the BLS database. More information about the affected series is available at www.bls.gov/bls/errata/sae_errata.htm. |
Corrections made on 03/25/2022. |
| 03/18/2022 | Consumer Price Index | Other | Consumer Price Index retroactive series using current methods |
The spreadsheet file for all items less food and energy for the Consumer Price Index retroactive series (R-CPI-U-RS) was replaced on March 16, 2022, to correct an error initially published on March 15, 2022. |
Corrections made on 03/16/2022. |
| 03/10/2022 | Job Openings and Labor Turnover Survey | News release |
The Job Openings and Labor Turnover news release for January 2022, initially issued on March 9, 2022, stated an incorrect reference month for the hires estimates. The estimates in this paragraph are for January, not December. BLS reissued this news release correcting this error on March 10, 2022. |
Corrections made on 03/10/2022. | |
| 02/16/2022 | Producer Price Indexes | News release |
The Producer Price Index news release for January 2022, initially issued on February 15, 2022, contained incorrect data in table 2 for residential natural gas for the months of September 2021 through November 2021. BLS reissued the news release on February 16, 2022, with a corrected table 2. |
Corrections made on 02/16/2022. | |
| 02/11/2022 | Consumer Price Index | News release |
The PDF version of the Consumer Price Index news release for January 2022 was re-issued February 10, 2022. Data errors were found in tables in the PDF version of the news release. Data found elsewhere including the text version of the news release are correct as originally published. |
Corrections made on 02/10/2022. | |
| 02/10/2022 | Labor Force Statistics from the Current Population Survey | Database |
BLS identified an error in the rounding of median hourly earnings data and associated standard errors. A total of 162 series were affected. The estimates were rounded to the nearest integer, instead of 2 decimal places (or to the nearest dollar, instead of to the nearest cent). This problem only occurred with the annual averages for 2021. These estimates were corrected in the LABSTAT database. None of these were included in published tables. The data series that have been corrected are listed at www.bls.gov/bls/errata/corrected-median-hourly-earnings-data-initially-published-with-incorrect-rounding-2022-02.htm. |
Corrections made on 02/09/2022. | |
| 02/10/2022 | Consumer Price Index | Other |
Statements in Using Seasonally Adjusted and Unadjusted Data were updated to correct the incorrect values. The section on 2021 Series Adjusted Using Intervention Analysis Seasonal Adjustment has been corrected to say, "For the seasonal factors introduced in January 2022, BLS adjusted 70 series using Intervention Analysis Seasonal Adjustment, including selected food and beverage items, motor fuels, electricity, and vehicles." The section on Determining Seasonal Status has been corrected to say, "For 2022, 36 of the 81 components of the U.S. city average all items index are not seasonally adjusted." |
Corrections made on 02/10/2022. | |
| 02/09/2022 | Injuries, Illnesses, and Fatalities | Database |
|
These 4 XLSX tables produced for special data requests had an error in the calculation for SOC code 29-1210 (Physicians). |
Corrections made on 02/09/2022. |
| 01/25/2022 | American Time Use Survey | Monthly Labor Review |
Time use of millennials and Generation X: differences across time |
Table 1 has been updated to correct a calculation error in the percent distribution of employed men in 2003 and 2019. |
Corrections made on 01/24/2022. |
| 01/18/2022 | Producer Price Indexes | Database | Some 2021 annual average data for the Producer Price Indexes were incorrect when first added to the public database January 13, 2022. The annual averages were removed from the database January 14. Corrected estimates will be added to the database with the next update of Producer Price Indexes data on February 15, 2022. |
Corrections made on 01/14/2022. | |
| 12/17/2021 | Employment Cost Trends | News release | Tables 4, 5, and 6 in the June 2021 and September 2021 new releases contained errors. Corrections were made in 9 rows for June 2021 and 1 row for September 2021. |
Corrections made on 12/17/2021. | |
| 12/15/2021 | Employee Benefits | Other |
Health care plan provisions for private industry workers in the United States, 2020 Retirement Plan Provisions for Private Industry Workers in the United States, 2019 |
Appendix table 2 of both publications showed incorrect numbers of workers represented. The original numbers were incorrectly calculated using Standard Occupational Classification (SOC) 2010 and have been corrected using SOC 2018. |
Corrections made on 12/09/2021. |
| 12/15/2021 | Employee Benefits | Other |
National Compensation Survey: Employee Benefits in the United States, March 2021 |
Appendix table 2 incorrectly stated that Standard Occupational Classification (SOC) 2018 was used to classify workers. SOC 2010 is currently used for estimation, and the table has been corrected. |
Corrections made on 12/09/2021. |
| 12/15/2021 | Labor Force Statistics from the Current Population Survey | Database; News release |
BLS corrected 2019 and 2020 data on the number and percent of total married-couple families with only one spouse employed. The incorrect data appeared in the text of the news release, in table 2 of the news release, and in the online database. |
Corrections made on 12/20/2021. | |
| 12/15/2021 | Office of Survey Methods Research | Other |
The unit response rates for the Current Employment Statistics (CES) survey for the months of September, October, and November 2021 were incorrectly displayed when this page was updated December 6, 2021. The final response rates for those months were not yet available and were removed. |
Corrections made on 12/13/2021. | |
| 12/10/2021 | Consumer Price Index | News release |
The news release published on December 10, 2021 was reissued the same day to correct the following sentence: "The all items index rose 6.8 percent for the 12 months ending November, the largest 12-month increase since the period ending June 1982.” The original sentence referenced October instead of November. |
Corrections made on 12/10/2021. | |
| 11/30/2021 | Job Openings and Labor Turnover Survey | Beyond the Numbers |
Chart 2 incorrectly showed values as percentages in the map's legend and tooltip. |
Corrections made on 11/30/2021. | |
| 11/22/2021 | Consumer Price Index | Other |
Impact of the coronavirus (COVID-19) pandemic on Consumer Price Index data for October 2021 Impact of the coronavirus (COVID-19) pandemic on Consumer Price Index data for September 2021 Impact of the coronavirus (COVID-19) pandemic on Consumer Price Index data for August 2021 |
In "Impact of the coronavirus (COVID-19) pandemic on Consumer Price Index data" for August, September, and October 2021, table 1 has been updated to correct values for August 2021 on telephone and online collection for the commodities and services survey. |
Corrections made on 11/22/2021. |
| 11/16/2021 | Injuries, Illnesses, and Fatalities | Other |
This fact sheet was updated on November 8, 2021, to correct a bullet in the "Key Facts" about the incidence rate of nonfatal injuries and illnesses involving days away from work. |
Corrections made on 11/08/2021. | |
| 10/27/2021 | Labor Force Statistics from the Current Population Survey | News release |
Usual Weekly Earnings of Wage and Salary Workers — Second Quarter 2021 (PDF) |
BLS reissued this news release to address incorrect values for 9 seasonally adjusted series. The incorrect data were published in table 1, in the text of the news release, and in the online database. |
Corrections made on 10/19/2021. |
| 10/01/2021 | Employment Projections | Career Outlook |
Projected openings in occupations that require a college degree |
The 2020 median annual wage for occupations that require a bachelor’s degree as the typical entry-level education was incorrectly published. The article has been updated to reflect the correct 2020 median annual wage, $78,020. |
Corrections made on 09/30/2021. |
| 09/17/2021 | Employment, Hours, and Earnings from the Current Employment Statistics survey (State and Metro Area) | Database |
Employment, Hours, and Earnings – State and Metropolitan Area Database |
Some employment data for Baltimore City, Maryland, were incorrectly published in the BLS database. More information about the affected series is available at www.bls.gov/bls/errata/sae_errata.htm. |
Corrections made on 09/17/2021. |
| 08/27/2021 | Consumer Price Index | Monthly Labor Review |
Table 1, figures 3–5 and 8–9, and related text were updated to correct miscalculations of the rates of overshoot and undershoot. |
Corrections made on 08/27/2021. | |
| 08/05/2021 | Labor Force Statistics from the Current Population Survey | Other |
Annual table 18. Employed persons by detailed industry, sex, race, and Hispanic or Latino ethnicity (HTML) (PDF) (XLSX) |
BLS identified an error in the 2020 annual average table "18. Employed persons by detailed industry, sex, race, and Hispanic or Latino ethnicity." The percentages for administrative and support services were incorrect. |
Corrections made on 07/30/2021. |
| 08/04/2021 | Import/Export Price Indexes | Database; News release |
BLS discovered an error in the export air freight price indexes from January 2021 to June 2021. With the release of August 2021 U.S. Import and Export Price Indexes, the three affected export price indexes (all air freight, air freight-Europe, air freight-Asia) have been corrected in the BLS database. |
Corrections made on 09/15/2021. | |
| 07/29/2021 | Job Openings and Labor Turnover Survey | Other |
Impact of coronavirus (COVID-19) pandemic on Job Openings and Labor Turnover data for May 2021 |
The data in table 1 on collection mode for May 2021 have been corrected. | Corrections made on 07/29/2021. |
| 07/20/2021 | Productivity | News release | The BLS Productivity program discovered processing errors in the first quarter 2021 estimates of hours worked for the business, manufacturing, and nonfinancial corporate sectors. The error in hours worked resulted in errors for first quarter 2021 hours worked and related measures, including labor productivity. More information can be found at www.bls.gov/bls/errata/corrected-hours-worked-and-labor-productivity-for-labor-productivity-and-costs-2021-Q1.htm. | Corrections made on 07/20/2021. | |
| 06/14/2021 | Mountain-Plains Information Office | News release |
As originally published, chart 1 showed the 1-month change instead of the 12-month change for the all-items Consumer Price Index for All Urban Consumers. |
Corrections made on 06/11/2021. | |
| 06/04/2021 | Productivity | The Economics Daily | Productivity up in 45 states and DC as decreases in output and hours were widespread in 2020 |
As originally published, the data table and the tooltip in the chart incorrectly stated the employment level was in thousands. |
Corrections made on 06/04/2021. |
| 06/03/2021 | Consumer Expenditure Survey | The Economics Daily |
As originally published, the data for “maintenance and repairs” and “rental, leasing, licensing, and other charges” were switched in the chart data table. |
Corrections made on 06/03/2021. | |
| 05/18/2021 | Quarterly Census of Employment and Wages | Database; News release |
In the spring of 2020, BLS modified its imputation process for the Quarterly Census of Employment and Wages (QCEW) to be more responsive to current economic conditions. While continuing work to improve this process, BLS made an unintended data-processing error. This error affected data for the second, third, and fourth quarters of 2020. BLS has analyzed this issue and has determined that the impact on QCEW employment was negligible at the statewide level. In smaller areas and industries, revisions may be larger than usual. Wage data were not affected. Following the usual QCEW practice, these data will be revised and corrected with the full data update on September 1, 2021. For more information on QCEW imputation methodology, see Quarterly Census of Employment and Wages Imputation Methodology. |
Corrections to be made on 09/01/2021. | |
| 03/26/2021 | Employment, Hours, and Earnings from the Current Employment Statistics survey (State and Metro Area) | Other; Database |
Employment, Hours, and Earnings – State and Metropolitan Area Database |
Some employment data for the Medford, Oregon, Metropolitan Statistical Area were incorrectly published in the BLS database and a table. More information about the affected series is available at www.bls.gov/bls/errata/sae_errata.htm. |
Corrections made on 03/26/2021. |
| 03/26/2021 | Productivity | Other | Historical Multifactor Productivity Measures (SIC 1948-87 linked to NAICS 1987-2020) |
Data in these files were corrected because of misreporting of labor hours, combined inputs, and multifactor productivity for the private business and private nonfarm business sectors. |
Corrections made on 03/26/2021. |
| 03/19/2021 | Local Area Unemployment Statistics | Database; Other |
Model-based employment and unemployment data have been corrected for Michigan, the Detroit-Warren-Dearborn Metropolitan Statistical Area, and Balance of Michigan (the state less Detroit-Warren-Dearborn) for July 1998. The corrected estimates better reflect the impact of a large-scale labor dispute. Both seasonally adjusted and not seasonally adjusted data for the three areas were affected. The 1998 annual averages also were recalculated to reflect the corrections to the estimates for July. |
Corrections made on 03/19/2021. | |
| 02/25/2021 | Work Stoppages | News release; Other; Database |
Work Stoppages Annual Historical Table, 1947–present |
BLS identified an issue with the published 2020 Work Stoppages summary. At least one stoppage meeting the definition for inclusion in the report was not included. |
Corrections made on 03/01/2021. |
| 02/25/2021 | Southeast Information Office | News release |
Consumer Price Index, Miami-Fort Lauderdale-West Palm Beach – December 2020 Consumer Price Index, Atlanta-Sandy Springs-Roswell – December 2020 |
As initially published, the chart data table associated with the View Chart Data link contained incorrectly labeled dates. | Corrections made on 02/25/2021. |
| 02/24/2021 | Employment Projections | Other |
The file originally published on September 1, 2020, included the same data values for “all other men” and “all other women.” The data for “all other men” have been corrected. |
Corrections made on 02/24/2021. | |
| 02/18/2021 | Work Stoppages | Database; News release; Other |
Work Stoppages Annual Historical Table, 1947–present |
As originally published, the number of days of idleness for work stoppages between February 2018 and December 2020 was incorrect. President’s Day in February 2018 was mistakenly included as a workday, which affected the number of lost workdays and days idle. The Work Stoppages program does not include federal holidays. Cumulative values for ongoing work stoppages were also affected in the subsequent months. |
Corrections made on 02/19/2021. |
| 02/11/2021 | Consumer Price Index | Database; News release; Other |
On February 10, 2021, the Consumer Price Index program published incorrect December values for 29 seasonally adjusted CPI-U special relative series in the database. The incorrect data were also published in tables 2 and 6 in the news release and in the CPI-U news release companion file. |
Corrections made on 02/11/2021. | |
| 01/15/2021 | Consumer Price Index | Database; News release; Other |
On January 13, 2021, the Consumer Price Index program published incorrect December values for 29 seasonally adjusted CPI-U special relative series in the database. The incorrect data were also published in tables 2 and 6 in the news release and in the CPI-U news release companion file. |
Corrections made on 01/19/2021. | |
| 01/13/2021 | Consumer Price Index | News release |
The news release heading originally said the material was embargoed until 8:30 a.m. (ET) January 13, 2020, instead of 2021. The date has been corrected. |
Corrections made on 01/13/2021. | |
| 01/04/2021 | Labor Force Statistics from the Current Population Survey | Monthly Labor Review |
In the section on “Job losses,” a sentence has been corrected to say the number of unemployed was 14 million in August 2020 and 11 million in November 2020. |
Corrections made on 01/04/2021. | |
| 12/30/2020 | Quarterly Census of Employment and Wages | The Economics Daily |
Internet publishing employment up 48 percent, first quarter 2016 to second quarter 2020 |
As initially published, the chart and data table contained incorrect employment and establishment numbers for Internet publishing and web search portals for the first quarter of 2020. |
Corrections made on 12/30/2020. |
| 12/15/2020 | Business Response Survey | The Economics Daily |
60 percent of businesses with average pay less than $20k told some staff not to work due to COVID-19 |
The first paragraph was corrected to say 39 percent of establishments paying an average wage greater than $80,000 told at least some employees not to work. |
Corrections made on 12/15/2020. |
| 12/03/2020 | Consumer Price Index | Other |
October 2020 CPI collection information and response rates September 2020 CPI collection information and response rates August 2020 CPI collection information and response rates July 2020 CPI collection information and response rates June 2020 CPI collection information and response rates |
In the Consumer Price Index monthly COVID-19 impact statements for April 2020 through October 2020, the list of data series shown as inadequate for publication has been corrected. |
Corrections made on 12/03/2020. |
| 12/03/2020 | Injuries, Illnesses, and Fatalities | Other |
Tables on work-related injuries and illnesses involving days away from work in 2017 and 2018 that show parts of the body affected incorrectly showed neck injuries as a subset of head injuries. |
Corrections made on 01/11/2021. | |
| 11/30/2020 | Employment, Hours, and Earnings from the Current Employment Statistics survey (National) | Beyond the Numbers |
In table 1, the estimate was corrected for the percent change in employment for trade, transportation, and utilities. In table 2, the estimate was corrected for employment in nondurable goods manufacturing in June 2019 and the change in nondurable goods manufacturing employment from 2009 to 2019. |
Corrections made on 11/30/2020. | |
| 11/18/2020 | Employment Cost Trends | News release |
The HTML version of the technical note contained incorrect information about the number of responding private industry establishments. |
Corrections made on 10/30/2020. | |
| 11/18/2020 | National Longitudinal Surveys | Database; News release | BLS reissued this news release on October 7, 2020, to correct microdata errors associated with creating hourly wage variables. The corrections affected data points presented in table 5 and the text of this news release. |
Corrections made on 10/07/2020. | |
| 09/28/2020 | Productivity | Other |
1987-2018 Capital by Measure for Major Sectors and NIPA–level Industries 1987-2018 Information Capital by Measure for Major Sectors and NIPA–level Industries 1987-2018 Intellectual Property Capital by Measure for Major Sectors and NIPA–level Industries |
Data in these files were corrected on September 29, 2020, because of misreporting of productive capital stock, gross investment, wealth stock and deprecation in the manufacturing sector. |
Corrections made on 09/29/2020. |
| 09/23/2020 | Labor Force Statistics from the Current Population Survey | Database; News release; Other |
Current Population Survey database Employment Situation news releases, January through July 2020 Usual Weekly Earnings news releases, First and Second Quarter 2020 |
On September 23, 2020, BLS corrected data errors in the Current Population Survey. These errors were associated with the introduction of a new occupation classification system in January 2020. The errors did not affect most major series, including the official unemployment rate. The impact was negligible for the vast majority of the corrected series. More information is available at www.bls.gov/bls/errata/revision-to-current-population-survey-estimates-for-January-through-July-2020.htm. | Corrections made on 09/23/2020. |
| 09/11/2020 | Employment, Hours, and Earnings from the Current Employment Statistics survey (State and Metro Area) | Database; News release; Other |
Employment, Hours, and Earnings – State and Metropolitan Area Database |
Some employment data for California were incorrectly published in the BLS database, news releases, and tables. These estimates were corrected September 11, 2020. More information about the affected series is available at www.bls.gov/bls/errata/sae_errata.htm. |
Corrections made on 09/11/2020. |
| 08/31/2020 | Consumer Expenditure Survey | Beyond the Numbers |
Receipt and use of stimulus payments in the time of the Covid-19 pandemic |
Within the chart titled, “Chart 3. Stimulus payment use by race or ethnicity of respondent, June 11–June 16, 2020,” data were incorrectly labelled. |
Corrections made on 08/31/2020. |
| 08/21/2020 | Employment, Hours, and Earnings from the Current Employment Statistics survey (State and Metro Area) | Database; News release |
Employment, Hours, and Earnings – State and Metropolitan Area Database |
Some employment data for Oxnard, CA, were incorrectly published in the BLS database. These estimates were corrected August 21, 2020. More information about the affected series is available at www.bls.gov/bls/errata/sae_errata.htm. |
Corrections made on 08/21/2020. |
| 07/14/2020 | Consumer Price Index | News release |
In the HTML version of the news release, the title of the box note about the impact of the COVID-19 pandemic on the Consumer Price Index data was corrected to say June instead of May. |
Corrections made on 07/14/2020. | |
| 07/08/2020 | Injuries, Illnesses, and Fatalities | Other |
The fact sheet was updated on July 7, 2020 to correct a sentence about the age distribution of officers with injuries and illnesses involving days away from work. |
Corrections made on 07/07/2020. | |
| 06/30/2020 | Injuries, Illnesses, and Fatalities | Database | The Bureau of Labor Statistics identified ten private sector industry estimates from the Survey of Occupational Injuries and Illnesses that were published in error for 2018. For more information about correcting this error, see www.bls.gov/bls/errata/corrections-to-survey-of-occupational-injuries-and-illnesses-data-june-30-2020.htm. |
Corrections made on 06/30/2020. | |
| 06/26/2020 | Job Openings and Labor Turnover Survey | Database |
Job Openings and Labor Turnover Survey estimates for January 2020 have been updated to correct an error in federal government data. For more information about correcting this error, see www.bls.gov/bls/errata/corrections-to-job-openings-and-labor-turnover-survey-estimates-for-january-2020.htm |
Corrections made on 07/07/2020. | |
| 06/19/2020 | Injuries, Illnesses, and Fatalities | Monthly Labor Review |
The Bureau of Labor Statistics discovered errors in the reported fatal occupational injuries by latency and age in table 8. Of the over 144,000 cases, there were 12 cases of missing latency and 4 cases that were incorrectly assigned to the various categories. The differences in number were minor and do not affect the analysis. The table will not be updated. |
No Corrections will be made. | |
| 06/02/2020 | Productivity | Other |
Private Business and Private Nonfarm Business Multifactor Productivity Tables |
Data in this file were corrected on May 28, 2020, because of misreporting of the indexes for combined inputs, price of combined inputs, and multifactor productivity in the private business, and private nonfarm business sectors. |
Corrections made on 05/28/2020. |
| 05/08/2020 | Employment, Hours, and Earnings from the Current Employment Statistics survey (National) | Database; News release |
The Employment Situation — April 2020 |
On May 8, 2020, BLS discovered errors in national estimates for seasonally adjusted all employees in professional and technical services, professional and business services, private service-providing, service-providing, total private, and total nonfarm. The corrected change in total nonfarm employment for April 2020 is 37,000 lower than initially reported. Estimates were corrected for February, March and April 2020. |
Corrections made on 05/08/2020. |
| 04/28/2020 | Consumer Expenditure Survey | News release; Other |
Consumer Expenditure Surveys News Releases, Tables, and Public-Use Microdata |
BLS identified an issue with the estimated tax data associated with the Consumer Expenditure Surveys Annual Calendar Year tables from 2013 to 2018, the Midyear tables from 2013 to 2018, and the Public-Use Microdata files from 2013 to 2018. Estimates of federal and state taxes and after-tax income are affected by this issue. BLS has suppressed these values in the 2019 Midyear tables and is investigating the impact in previous years. Corrections will be issued as needed. |
No Corrections will be made. |
| 04/22/2020 | Labor Force Statistics from the Current Population Survey | News release |
Population controls used in the weighting of state data for veterans and nonveterans in tables 6a and 6b were incorrect. All differences were minor and not statistically significant. They were corrected on April 22, 2020. |
Corrections made on 04/22/2020. | |
| 04/21/2020 | Productivity | Other |
1987–2018 Detailed Capital Measures for Major Sectors and Industries |
Data in this file were corrected on April 21, 2020, because of misreporting of rental residential capital in the private business, private nonfarm business, manufacturing and nonfarm, nonmanufacturing sectors. |
Corrections made on 04/21/2020. |
| 04/03/2020 | Employment, Hours, and Earnings from the Current Employment Statistics survey (National) | Other |
A previous version of the chart on the education and health services page erroneously showed an incorrect value for the prior 12-month average change for offices of dentists. The correct value is +1,000. The chart has been corrected and replaced. |
Corrections made on 04/03/2020. | |
| 02/21/2020 | Consumer Price Index | The Economics Daily |
Consumer prices increase 2.5 percent in the 12 months ending January 2020 |
The chart and data table originally displayed most dates incorrectly as "2020." These errors were corrected February 21, 2020. |
Corrections made on 02/21/2020. |
| 02/21/2020 | Labor Force Statistics from the Current Population Survey | Database; News release; Other |
Population controls used in the weighting of data for veterans and nonveterans were incorrect for November and December 2019. All differences were minor and not statistically significant, but they were corrected on February 21, 2020. In addition to the Current Population Survey database, the following news releases and other tables were corrected:
|
Corrections made on 02/21/2020. | |
| 02/21/2020 | Southwest Information Office | News release | Changing Compensation Costs in the Dallas Metropolitan Area – December 2019 |
The Dallas-Fort Worth data shown in Table 1 of this release were incorrect as published on February 3, 2020. All Table 1 data for Dallas-Fort Worth were corrected on February 19, 2020. |
Corrections made on 02/21/2020. |
| 01/22/2020 | Injuries, Illnesses, and Fatalities | Other | Table on fatal occupational injuries to independent workers, 2016–18 (XLSX) |
BLS identified an error in the table “Fatal occupational injuries to independent workers, 2016–2018.” The values for intermediate contractors and independent contractors were incorrect. The table was corrected on January 21, 2020. |
Corrections made on 01/22/2020. |
| 01/15/2020 | Injuries, Illnesses, and Fatalities | Other | We identified errors in occupation table R66, in which three Standard Occupational Classification (SOC) codes were presented incorrectly for years 2017 and 2018. The affected SOC codes are 29-2035, 33-9093, and 43-3099. The table presents occupational injuries and illnesses by number and median days away from work. The data were not affected by this error. The tables were corrected on January 14, 2020. |
Corrections made on 01/15/2020. | |
| 01/13/2020 | Consumer Price Index | Database |
On January 14, 2020, data for the following series will suppressed for December 2019, and data for November 2019 will be removed from the BLS database and current tables:
We plan to provide updated values in our database and on current publication tables on February 13, 2020. Monthly price indexes are unaffected by the error. |
Corrections made on 01/13/2020. | |
| 01/10/2020 | Consumer Expenditure Survey | Other |
Minor errors have been corrected in the following data tables containing 1995 data for two gift series, Education and All other gifts.
The corrected 1995 value for Education is $120 and the corrected value for All Other Gifts is $114. |
Corrections made on 01/10/2020. |
* For errata data prior to 2020, please see our Archived Errata Table.