
October is National Disability Employment Awareness Month. BLS has been collecting data on the employment status of people with a disability for nearly a decade. Let’s talk about how we gather the data and then look at some long-term trends.
Why does BLS gather information about people with a disability?
BLS added six questions to the Current Population Survey in June 2008 to begin gathering timely information on the employment and unemployment status of people with a disability. Policymakers and others use these data to see how this population fares in the job market.
How does BLS collect these data?
The survey asks about physical, mental, and emotional disabilities. It is difficult to accurately identify all people with a disability using only a few questions. Research conducted by the U.S. Census Bureau and others resulted in six questions that identify this population.
The questions used to find out whether anyone in a household has a disability are:
- Is anyone deaf or does anyone have serious difficulty hearing?
- Is anyone blind or does anyone have serious difficulty seeing even when wearing glasses?
- Because of a physical, mental, or emotional condition, does anyone have serious difficulty concentrating, remembering, or making decisions?
- Does anyone have serious difficulty walking or climbing stairs?
- Does anyone have difficulty dressing or bathing?
- Because of a physical, mental, or emotional condition, does anyone have difficulty doing errands alone such as visiting a doctor’s office or shopping?
People who respond “yes” to any of these questions are classified as having a disability.
How likely are people with a disability to be employed?
- The employment-population ratio is the percentage of the population who are working.
- People with no disabilities are more than 3 times as likely to be employed as those with a disability (65.3 percent in 2016, compared with 17.9 percent). This disparity has held throughout the time these data have been available.
- People with a disability tend to be older, and older people are less likely to be employed. However, people with a disability are less likely to be employed regardless of their age.
- About 1 in 30 employed people in the U.S. have a disability.
What is the unemployment rate for people with a disability?
- Someone is unemployed if they do not have a job but are available to work and looked for a job in the previous 4 weeks.
- The unemployment rate is the number of unemployed people divided by the labor force, which is the sum of employed and unemployed people.
- The unemployment rate for people with a disability has been about twice that of people with no disabilities in recent years. In 2016, the unemployment rate for people with a disability was 10.5 percent, and the rate for those without a disability was 4.6 percent.
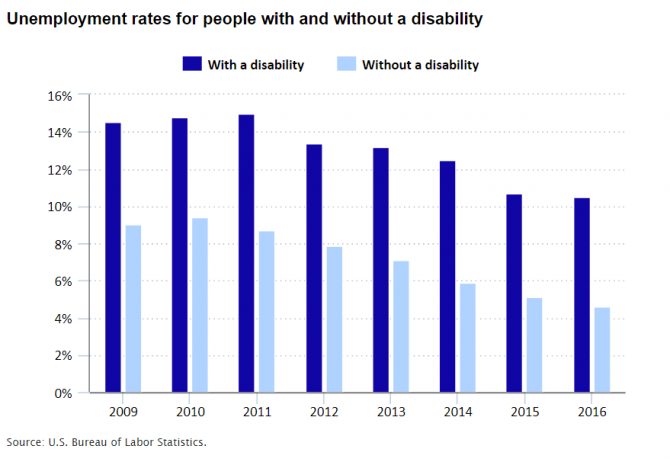
Editor’s note: Data for this chart are available in the table below.
What about people who are neither working nor looking for work?
- People who are neither working nor looking for work are not in the labor force.
- In 2016, a larger proportion of people with a disability—8 in 10—were not in the labor force than those with no disability, at about 3 in 10.
- Many people with a disability are age 65 and older. In general, older people are less likely to participate in the labor force than younger people.
- Most people with and without a disability who are not in the labor force do not want a job, perhaps because they are retired, have family responsibilities, or are in school.
We honor the contributions and innovations that people with a disability make to our workforce and to our nation. We look forward to providing information about people with a disability for years to come.
Want to learn more? Check out our webpage with more data about people with a disability. We also have answers to frequently asked questions.
| Characteristic | 2009 | 2010 | 2011 | 2012 | 2013 | 2014 | 2015 | 2016 |
|---|---|---|---|---|---|---|---|---|
| With a disability | 14.5% | 14.8% | 15.0% | 13.4% | 13.2% | 12.5% | 10.7% | 10.5% |
| Without a disability | 9.0 | 9.4 | 8.7 | 7.9 | 7.1 | 5.9 | 5.1 | 4.6 |