Editor’s note: The following has been cross-posted from the U.S. Department of Labor blog. The writer is Teri Morisi, a supervisory economist at the U.S. Bureau of Labor Statistics.

Editor’s note: A text-only version of the graphic is below.
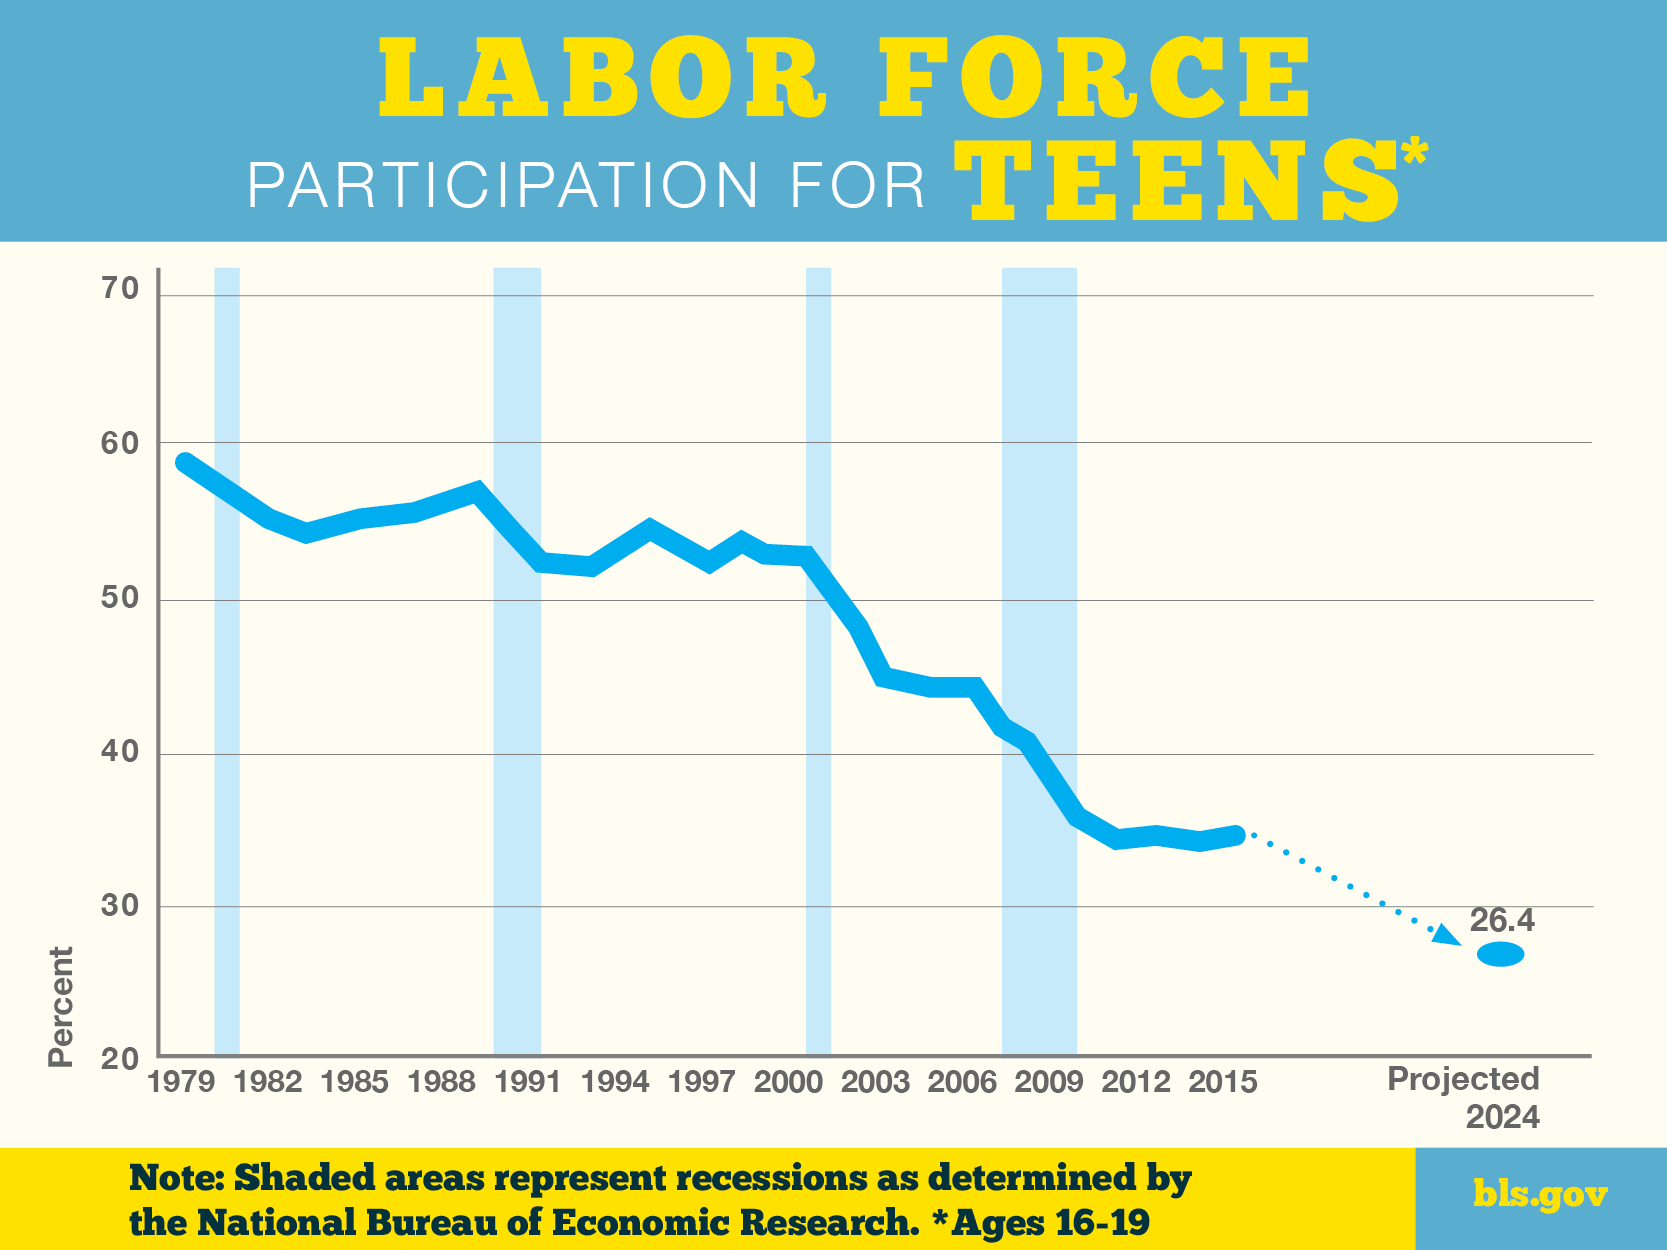
In our nation’s changing economy, the pull of education is a key factor in how teens are fitting into the labor force. Back in 1979, about 58 percent of teens (16–19) were in the labor force, but by 2000, only 52 percent were. By 2011, after the recession, about 34 percent of teens were in the labor force. What’s behind this change? Most teens who do not participate in the labor force cite school as the reason. Consider these factors:
- Higher attendance: In 2015, about 3 in 4 teens were enrolled in school. This proportion has trended up from about 60 percent in 1985, which is the first year data are available.
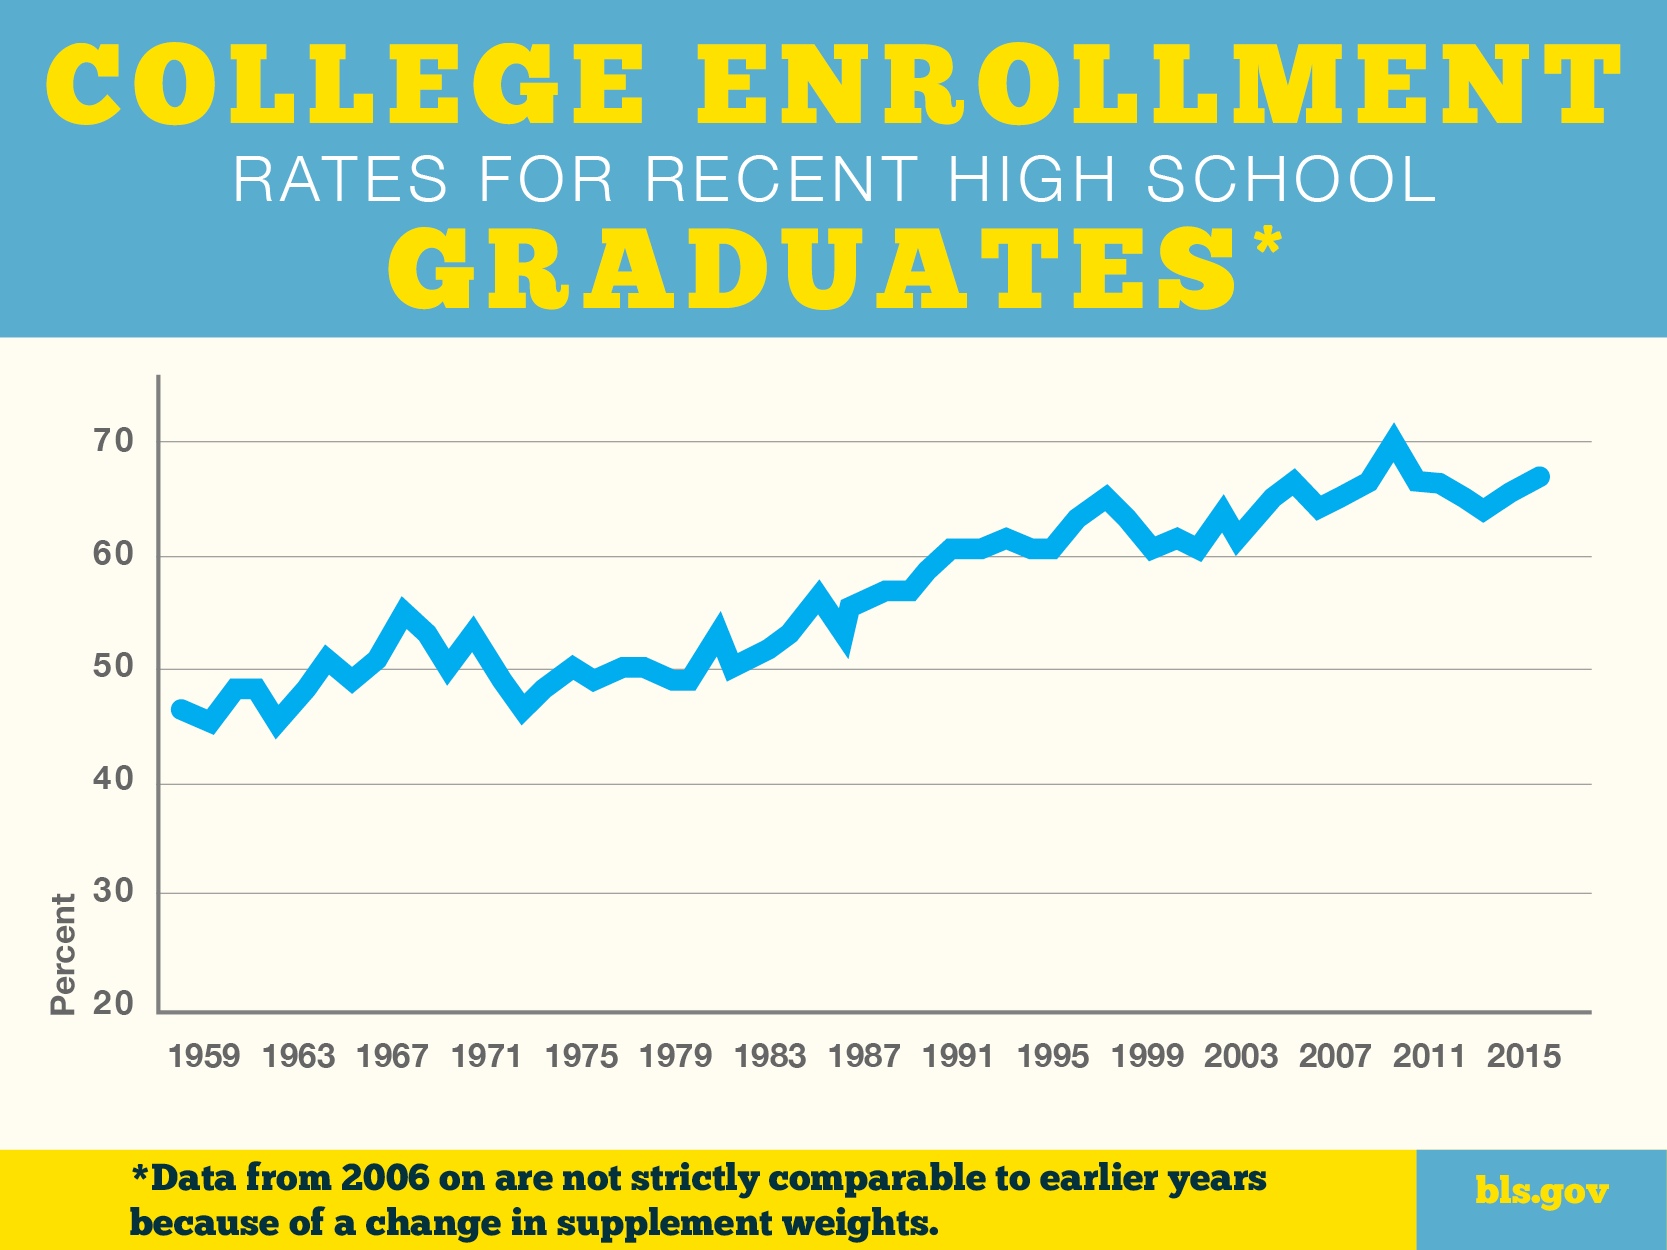
- Time-consuming classes: After sleeping, school activities take up more time than anything else in a teenager’s week day. And high school coursework has become more strenuous. High schoolers today are taking tougher and more advanced courses, including those specifically designed for college preparation and credit. And most start college the fall after graduating from high school. In October 2015, about 70 percent of recent high school graduates were enrolled in college, compared with less than half of recent graduates in October 1959.
- More summer students: Summer has always been the most common time for teens to work, but fewer teens are holding summer jobs: about 4 in 10 teens were in the labor force last July, compared with about 7 in 10 in July 1978. At the same time, school attendance in summer is on the rise. The proportion of teens enrolled in July 2016 (42 percent) was more than four times higher than in July 1985.
- Higher education costs: College tuition costs have risen dramatically in real (inflation-adjusted) terms, so a part-time job is generally not sufficient to cover costs. Teens enrolled in college therefore are more likely to cover costs through loans and grants: 84 percent of full-time undergraduates received financial aid in 2011–12, compared with 58 percent in 1992–93.

Editor’s note: A text-only version of the graphic is below.
Teens who want to work face competition, of course. Labor force participation for those ages 55 and older has been growing; their labor force participation rate surpassed the rate for teens in 2009.
What does the future hold? BLS projects that the teen labor participation rate could drop further in 2024, to 26.4 percent.
Learn more about trends in teen labor force participation.
| Chart: Labor force participation rates for teens ages 16-19, 1979-2015 and projected 2024 | |
| Year | Percent |
| 1979 | 57.9 |
| 1980 | 56.7 |
| 1981 | 55.4 |
| 1982 | 54.1 |
| 1983 | 53.5 |
| 1984 | 53.9 |
| 1985 | 54.5 |
| 1986 | 54.7 |
| 1987 | 54.7 |
| 1988 | 55.3 |
| 1989 | 55.9 |
| 1990 | 53.7 |
| 1991 | 51.6 |
| 1992 | 51.3 |
| 1993 | 51.5 |
| 1994 | 52.7 |
| 1995 | 53.5 |
| 1996 | 52.3 |
| 1997 | 51.6 |
| 1998 | 52.8 |
| 1999 | 52.0 |
| 2000 | 52.0 |
| 2001 | 49.6 |
| 2002 | 47.4 |
| 2003 | 44.5 |
| 2004 | 43.9 |
| 2005 | 43.7 |
| 2006 | 43.7 |
| 2007 | 41.3 |
| 2008 | 40.2 |
| 2009 | 37.5 |
| 2010 | 34.9 |
| 2011 | 34.1 |
| 2012 | 34.3 |
| 2013 | 34.5 |
| 2014 | 34.0 |
| 2015 | 34.3 |
| Projected 2024 | 24.6 |
| Source: U.S. Bureau of Labor Statistics, Current Population Survey and Employment Projections Program.
| |
| Chart: College enrollment rates for recent high school graduates, 1959-2015 | |
| Year | Percent |
| 1959 | 45.7 |
| 1960 | 45.1 |
| 1961 | 48.0 |
| 1962 | 49.0 |
| 1963 | 45.0 |
| 1964 | 48.3 |
| 1965 | 50.9 |
| 1966 | 50.1 |
| 1967 | 51.9 |
| 1968 | 55.4 |
| 1969 | 53.3 |
| 1970 | 51.8 |
| 1971 | 53.5 |
| 1972 | 49.2 |
| 1973 | 46.6 |
| 1974 | 47.6 |
| 1975 | 50.7 |
| 1976 | 48.8 |
| 1977 | 50.6 |
| 1978 | 50.1 |
| 1979 | 49.4 |
| 1980 | 49.4 |
| 1981 | 53.9 |
| 1982 | 50.6 |
| 1983 | 52.7 |
| 1984 | 55.2 |
| 1985 | 57.7 |
| 1986 | 53.7 |
| 1987 | 56.8 |
| 1988 | 58.9 |
| 1989 | 59.6 |
| 1990 | 59.9 |
| 1991 | 62.4 |
| 1992 | 61.7 |
| 1993 | 62.6 |
| 1994 | 61.9 |
| 1995 | 61.9 |
| 1996 | 65.0 |
| 1997 | 67.0 |
| 1998 | 65.6 |
| 1999 | 62.9 |
| 2000 | 63.3 |
| 2001 | 61.6 |
| 2002 | 65.2 |
| 2003 | 63.9 |
| 2004 | 66.7 |
| 2005 | 68.6 |
| 2006 | 66.0 |
| 2007 | 67.2 |
| 2008 | 68.6 |
| 2009 | 70.1 |
| 2010 | 68.1 |
| 2011 | 68.3 |
| 2012 | 66.2 |
| 2013 | 65.9 |
| 2014 | 68.4 |
| 2015 | 69.2 |
| Note: Data beginning in 2006 are not strictly comparable to earlier years because of a change in supplement weights. Source: U.S. Bureau of Labor Statistics, Current Population Survey, October Supplement. | |
 United States Department of Labor