National employment indicators, such as the unemployment rate, get attention as we release them each month. In August 2018, the unemployment rate stood at 3.9 percent, the same as in July. The rate in May, 3.8 percent, was the lowest since 2000. In addition to reporting this headline number, the Bureau of Labor Statistics provides considerable detail about those who are employed – and those who are unemployed. Let’s explore.
But first, a reminder. The unemployment rate and details about the unemployed come from the monthly Current Population Survey, a survey of roughly 60,000 households. We collect information about household members age 16 and over. These individuals are counted as “employed” if they say they performed at least one hour of work “for pay or profit” during the reference week, the week including the 12th of the month. People are “unemployed” if they say that during the reference week they (1) had not worked; (2) were available for work; and (3) had actively looked for work (such as submitting a job application or attending a job interview) sometime during the 4-week period ending with the reference week.
Together, the employed and unemployed make up the “labor force.” The unemployment rate is the share of the labor force who are unemployed. Those who are neither employed nor unemployed are “not in the labor force.” This category includes students, retirees, stay-at-home parents, people with a disability, and others who are not working or actively looking for work.
We have more measures that help to provide a fuller picture of America’s labor force. These include people who work part time but would prefer to work full time. We also count people who have searched for work in the past 12 months but not in the past 4 weeks (and are therefore not counted as unemployed). Further, we count a subset of this group who are not looking because they do not believe work is available for them. People who fall into these categories are included in the alternative measures of labor underutilization, which we publish each month.
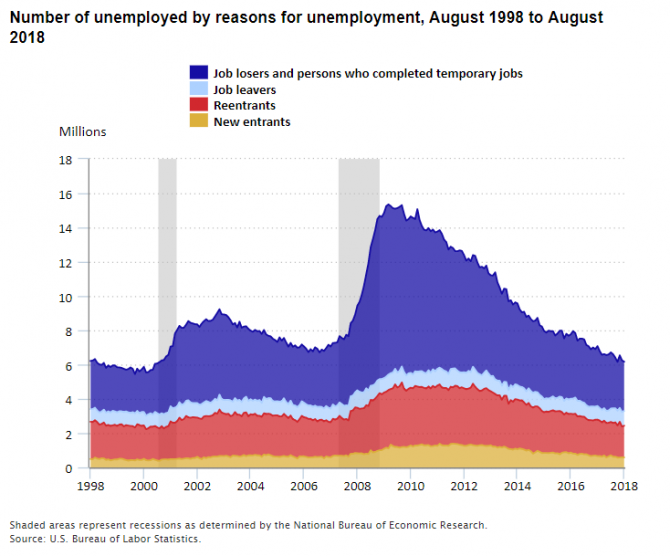
Let’s look at the unemployed in more detail. We can sort the unemployed into 4 groups: (1) new entrants to the labor force (such as recent graduates now looking for work); (2) reentrants to the labor force (those who had a job, then left the labor force, and are now looking for work again); (3) job leavers (those who recently left a job voluntarily); and (4) job losers (those who left a job involuntarily, such as getting laid off or fired or completing temporary jobs).
Typically, the largest share of the unemployed are job losers, and this share jumps during economic downturns. While the other categories are less volatile, they make up a larger share of the total as job losers decline. For example, in August 2018, 44 percent of the unemployed were either reentrants or those who recently left a job. The share of the unemployed in both of these categories is higher than in 2009, when job losers accounted for nearly two-thirds of the unemployed. A potential reason for people to reenter the labor market, or leave an existing job to look for another, is that they perceive jobs are readily available. In periods of high unemployment, reentrants make up a smaller proportion of the unemployed. For example, when the unemployment rate reached 10.0 percent in October 2009, reentrants made up only 22 percent of the unemployed. Similarly, in 2009 and 2010, the share of the unemployed who were job leavers (those who quit their jobs voluntarily) was less than 6 percent, about half of the current share.

Editor’s note: Data for this chart are available from our data-retrieval tool.
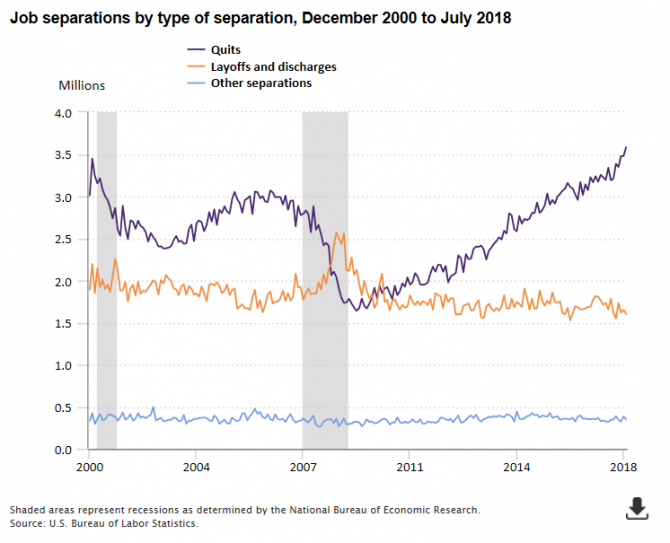
Another measure to assess the strength of the labor market is the number of people quitting their job. These data are from our Job Openings and Labor Turnover Survey. That survey asks employers about the number of “separations” over the past month. It classifies separations as either quits (voluntary), layoffs or discharges (not voluntary), or other (including retirements, deaths, and disability). The most recent data, for July 2018, identified 3.6 million quits over the month, an all-time high. (The survey began in 2000.) The quit rate, which divides quits by total employment, was 2.4 percent, also close to a record high.
Most of the time, quits exceed layoffs and discharges, except in periods of high unemployment.

Editor’s note: Data for this chart are available from our data-retrieval tool.
At any given time, there is a lot of movement in and out of jobs, and in and out of the labor market. And individuals have a variety of reasons for making such moves. But the overall trend in recent years toward individuals coming back into the labor market and voluntarily quitting their jobs suggests that individuals may feel that job opportunities are available.
 United States Department of Labor