We love data at the U.S. Bureau of Labor Statistics. We have lots of data about the labor market and economy, but we sometimes wish we had more. For example, we believe workers, businesses, and public policymakers would benefit if we had up-to-date information on employer-provided training. I recently wrote about the challenges of collecting good data on electronically mediated work, or what many people call “gig” work. I know many of you could make your own list of data you wish BLS had. One topic for which we have no shortage of data is pay and benefits. In fact, we have a dozen surveys or programs that provide information on compensation. We have so much data on compensation that it can be hard to decide which source is best for a particular purpose.
Where can you get pay data on the age, sex, or race of workers? Where should you go if you want pay data for teachers, nurses, accountants, or other occupations? What about if you want occupational pay data for a specific metro area? Or if you want occupational pay data for women and men separately? What if you want information on workers who receive medical insurance from their employers? Where can you find information on employers’ costs for employee benefits? Here’s a short video to get you started.
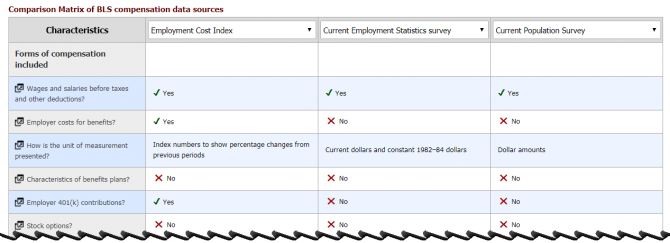
But wait, there’s more! To make it easier to figure out which source is right for your needs, we now have an interactive guide to all BLS data on pay, benefits, wages, earnings, and all the other terms we use to describe compensation. Let me explain what I mean by “interactive.” The guide lists 12 sources of compensation data and 32 key details about those data sources. 12 x 32 = a LOT of information! Having so much information in one place can feel overwhelming, so we created some features to let you choose what you want to see.
For example, the guide limits the display to three data sources at a time, rather than all 12. You can choose which sources you want to learn about from the menus at the top of the guide. 
If you want to learn about one of the 32 key details across all 12 data sources, just press or click that characteristic in the left column. For example, if you choose “Measures available by occupation?” a new window will open on your screen to describe the pay data available from each source on workers’ occupations.
There are links near the bottom of the guide to help you find where to go if you want even more information about each data source.
Check out our overview of statistics on pay and benefits. The first paragraph on that page has a link to the interactive guide. We often like to say, “We’ve got a stat for that!” When it comes to pay and benefits, we have lots of stats for that. Let us know how you like this new interactive guide.
 United States Department of Labor