In many ways, BLS is very much about the now. For example, two of our major statistical programs are the Current Employment Statistics and the Current Population Survey. But to understand the U.S. labor market, we also need a longer-term focus.
The National Longitudinal Surveys (NLS) program provides information about the long-term workings of the economy.
What is a “longitudinal survey”?
A longitudinal survey interviews the same sample of people over time. At each interview, the surveys ask people about their lives and changes since their prior interview. With this information we create histories that allow researchers to answer questions about long-term labor market outcomes. For example, how many jobs do people hold over their lifetimes? How do earnings grow at different stages of workers’ careers? How do events that happened when a person was in high school affect labor market success as an adult?
How does the NLS work?
The NLS program is more than 50 years old, and today we have two active cohorts, or nationally representative samples of people, whom we interview every year or two:
- The National Longitudinal Survey of Youth 1979 (NLSY79) consists of people born from 1957 to 1964, who were ages 14 to 22 when first interviewed in 1979.
- The NLSY79 cohort has been interviewed 27 times since the late 1970s.
- The children of the women in this sample (captured in the NLSY79 Children and Young Adults survey) have been assessed and interviewed 16 times since 1986.
- The National Longitudinal Survey of Youth 1997 (NLSY97) consists of people born in the years 1980 to 1984, who were ages 12 to 17 when first interviewed in 1997.
- The NLSY97 cohort has been interviewed 17 times.
These surveys are voluntary, and what a commitment our participants have shown! A big “thank you” to our respondents for their help!
What information is available from NLS?
By gathering detailed labor market information over time, researchers can create measures that are not available in other surveys.
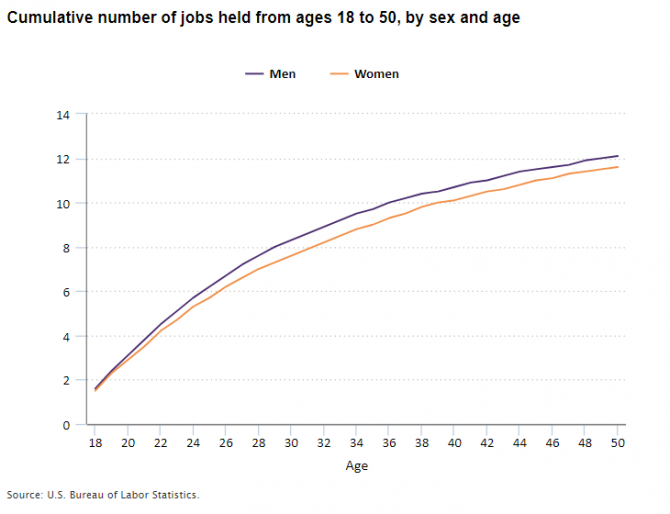
One measure is the number of jobs held across various ages. The chart that follows is from the most recent NLSY79 news release.
- The chart shows the cumulative number of jobs held from ages 18 to 50.
- People born from 1957 to 1964 held an average of 11.9 jobs from ages 18 to 50. From ages 18 to 24 these baby boomers held an average of 5.5 jobs. The number steadily fell over time until these baby boomers held an average of just 0.8 job from ages 45 to 50.
- The decline in the slope of the curves shows that workers change jobs more often when they are younger.

Editor’s note: Data for this chart are available in the table below.
The decline in the number of jobs held over time is also true for the NLSY97 cohort.
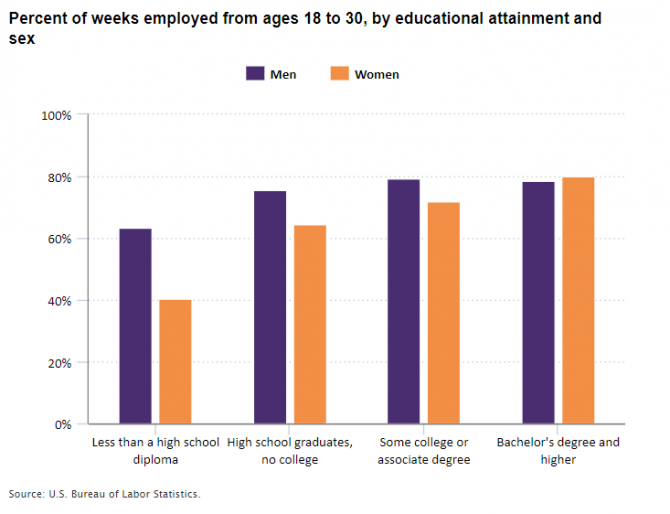
A second measure available from the surveys is the percentage of weeks worked over various ages. Let’s look at data from the most recent NLSY97 news release.
- The chart below shows the percent of weeks worked from ages 18 to 30, by educational attainment and sex.
- Women with less than a high school diploma were employed an average of 40 percent of weeks from ages 18 to 30. Men with less than a high school diploma were employed 64 percent of weeks.
- Among people with a bachelor’s degree and higher, women were employed an average of 80 percent of weeks, while men were employed 78 percent of weeks.

Editor’s note: Data for this chart are available in the table below.
Who uses the NLS?
The main users of these data are researchers in academia, think tanks, and government. They use the surveys to examine how life experiences are connected. For example, how do early life events (schooling, employment during one’s teens, parental divorce) affect adult outcomes (employment, income, family stability)?

Researchers value the surveys’ combination of large samples, long histories, and range of topics. These features allow researchers to study our economy and society from a rare and complex perspective.
Researchers have used the data in thousands of journal articles, working papers, Ph.D. dissertations, and books that shape theory and knowledge in economics, sociology, education, psychology, health sciences, and other fields.
You can find information about more than 8,000 studies in the NLS Bibliography. Looking at journal articles published in 2018, I found these studies using NLS data:
- Racial and Ethnic Variation in the Relationship between Student Loan Debt and the Transition to First Birth
- The Impact of Childhood Neighborhood Disadvantage on Adult Joblessness and Income
- The Effect of an Early Career Recession on Schooling and Lifetime Welfare
- The Early Origins of Birth Order Differences in Children’s Outcomes and Parental Behavior
- Earnings Dynamics: The Role of Education Throughout a Worker’s Career
![“[From the NLS] I learned that we cannot understand why adults have such diverse employment and earnings trajectories without going back to their youth to understand the skill and background differences that shaped how they transitioned into adulthood.” — Derek Neal, Professor of Economics, University of Chicago](/blog/2018/images/bls_nls_quote_callouts-4.png)
How can I get more information?
The data are free to the public and provided online with search and extraction tools and detailed documentation.
If you have a specific question, you might find it answered in our Frequently Asked Questions. Or you can always contact the staff by email or phone at 202-691-7410.
If you care about the long view—how peoples’ careers evolve over time, how people fare after job loss, how childbirth affects women’s careers, and so on—the National Longitudinal Surveys may be just what you need! Check out these gold-standard data!
| Age | Men | Women |
|---|---|---|
| 18 | 1.6 | 1.5 |
| 19 | 2.4 | 2.3 |
| 20 | 3.1 | 2.9 |
| 21 | 3.8 | 3.5 |
| 22 | 4.5 | 4.2 |
| 23 | 5.1 | 4.7 |
| 24 | 5.7 | 5.3 |
| 25 | 6.2 | 5.7 |
| 26 | 6.7 | 6.2 |
| 27 | 7.2 | 6.6 |
| 28 | 7.6 | 7.0 |
| 29 | 8.0 | 7.3 |
| 30 | 8.3 | 7.6 |
| 31 | 8.6 | 7.9 |
| 32 | 8.9 | 8.2 |
| 33 | 9.2 | 8.5 |
| 34 | 9.5 | 8.8 |
| 35 | 9.7 | 9.0 |
| 36 | 10.0 | 9.3 |
| 37 | 10.2 | 9.5 |
| 38 | 10.4 | 9.8 |
| 39 | 10.5 | 10.0 |
| 40 | 10.7 | 10.1 |
| 41 | 10.9 | 10.3 |
| 42 | 11.0 | 10.5 |
| 43 | 11.2 | 10.6 |
| 44 | 11.4 | 10.8 |
| 45 | 11.5 | 11.0 |
| 46 | 11.6 | 11.1 |
| 47 | 11.7 | 11.3 |
| 48 | 11.9 | 11.4 |
| 49 | 12.0 | 11.5 |
| 50 | 12.1 | 11.6 |
| Education | Men | Women |
|---|---|---|
| Less than a high school diploma | 63.5% | 40.3% |
| High school graduates, no college | 75.5 | 64.4 |
| Some college or associate degree | 79.4 | 72.0 |
| Bachelor’s degree and higher | 78.4 | 80.1 |
 United States Department of Labor