Summer is in full swing, which means that when I’m not talking about BLS data, I’m talking about baseball, something I could do full time. Luckily these two topics have a lot in common; nothing quite says statistics in the summertime like baseball does. We fans have followed baseball statistics for nearly as long as the game has been played. Teams today increasingly use statistics—or “analytics”—to decide which players to add to their rosters, who to play in any game situation, and even where to position fielders for certain batters. That’s a lot like the innovations BLS and the other federal statistical agencies focus on to help people make informed decisions for their families, businesses, and the broader economy.
I grew up a St. Louis Cardinals fan until the mid-1960s, when the lamentable Kansas City Athletics moved to Oakland and the American League expansion team, Kansas City Royals, brought winning baseball to Kansas. I had a second home, as it were, in the seats of Kauffman Stadium, or “The K” to us Kansas City Royals fans. Today I cheer for the Washington Nationals, having lived in the D.C. area for the past 25 years. Regardless of your favorite team, if you’re a baseball fan you know statistics are a huge part of how your team performs. While I could talk about George Brett’s batting average, home runs, or wins above replacement, let’s instead look at where America’s agency on labor data meets America’s favorite pastime.
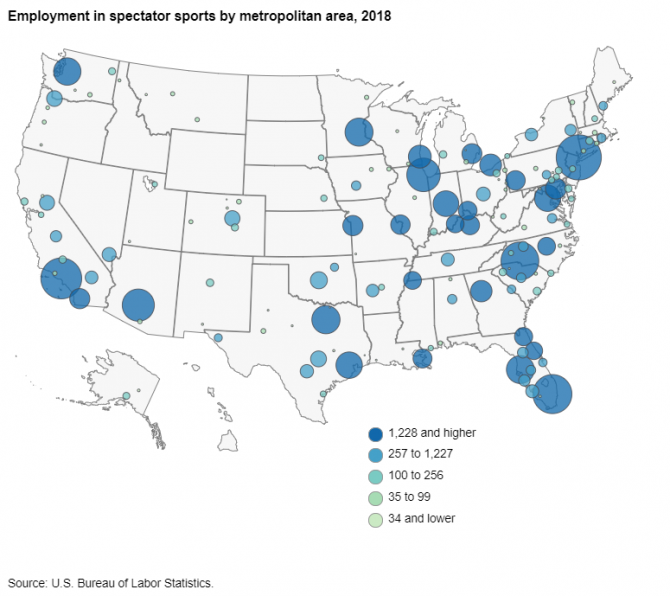
Spectator sports employed over 144,000 workers in 2018. The map below shows the metropolitan areas with the most jobs in spectator sports. The New York-Newark-Jersey City, NY-NJ-PA metro area, home of the Yankees and Mets, employs the most people at 8,674. Spectator sports include all professional and semi-professional sport teams.

Editor’s note: Data for this map are available in the table below.
Also consider the Occupational Employment Statistics program. In 2018, there were 27,780 radio and television announcers and 7,480 public address announcers. There were also 236,970 coaches and scouts and 19,090 umpires and referees in 2018.
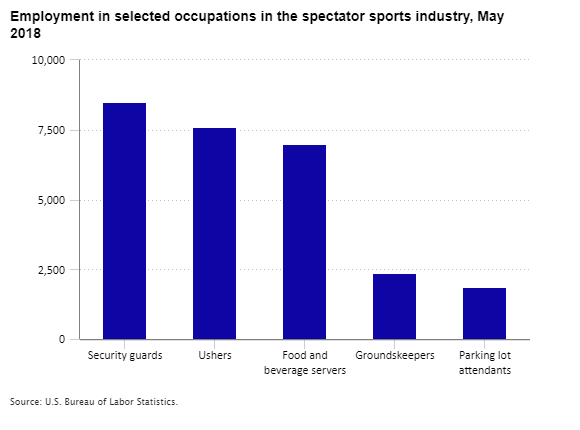
Here’s a look at some of the occupations within the spectator sports industry:

Editor’s note: Data for this chart are available in the table below.
If you’re going to the game, the Consumer Price Index can tell you how prices have changed over time. For example, ticket prices for sporting events decreased 0.8 percent from June 2018 to June 2019. Over the same period, parking fees and tolls increased 3.2 percent and prices for food away from home increased 3.1 percent. At the low end of the increases is beer away from home—a modest 0.8 increase over the year.
Or maybe you just decide to enjoy the game in front of your new 80-inch flat screen TV. You aren’t alone. According to the American Time Use Survey, Americans spend, on average, 2.84 hours a day watching television in 2017. That’s almost enough time to watch your typical 9-inning baseball game.
Can we squeeze any more baseball out of BLS statistics? There’s wage data for ushers, occupational injuries for umpires, and productivity in certain recreation industries. But we’ll save that for another day. For now, sit back and enjoy the game. Play Ball!
| Metropolitan area | Employment |
|---|---|
| Abilene, TX | 14 |
| Akron, OH | 215 |
| Albany-Schenectady-Troy, NY | 537 |
| Albuquerque, NM | 241 |
| Anchorage, AK | 204 |
| Ann Arbor, MI | 84 |
| Atlanta-Sandy Springs-Roswell, GA | 1,948 |
| Augusta-Richmond County, GA-SC | 314 |
| Austin-Round Rock, TX | 1,071 |
| Bakersfield, CA | 229 |
| Baltimore-Columbia-Towson, MD | 1,872 |
| Bangor, ME | 32 |
| Barnstable Town, MA | 9 |
| Baton Rouge, LA | 15 |
| Beaumont-Port Arthur, TX | 5 |
| Billings, MT | 78 |
| Birmingham-Hoover, AL | 372 |
| Bloomington, IL | 54 |
| Boulder, CO | 22 |
| Bridgeport-Stamford-Norwalk, CT | 83 |
| Burlington-South Burlington, VT | 92 |
| Canton-Massillon, OH | 13 |
| Cape Coral-Fort Myers, FL | 718 |
| Charleston, WV | 118 |
| Charleston-North Charleston, SC | 256 |
| Charlotte-Concord-Gastonia, NC-SC | 6,081 |
| Chicago-Naperville-Elgin, IL-IN-WI | 4,763 |
| Cincinnati, OH-KY-IN | 1,473 |
| Cleveland-Elyria, OH | 2,019 |
| Coeur d’Alene, ID | 36 |
| College Station-Bryan, TX | 20 |
| Colorado Springs, CO | 214 |
| Columbia, SC | 383 |
| Columbus, OH | 813 |
| Corpus Christi, TX | 153 |
| Dallas-Fort Worth-Arlington, TX | 3,392 |
| Deltona-Daytona Beach-Ormond Beach, FL | 1,294 |
| Denver-Aurora-Lakewood, CO | 999 |
| Des Moines-West Des Moines, IA | 375 |
| Detroit-Warren-Dearborn, MI | 1,682 |
| Dover, DE | 222 |
| Dubuque, IA | 72 |
| Duluth, MN-WI | 75 |
| El Paso, TX | 269 |
| Erie, PA | 105 |
| Eugene, OR | 67 |
| Evansville, IN-KY | 209 |
| Fairbanks, AK | 29 |
| Flint, MI | 6 |
| Florence, SC | 43 |
| Fort Collins, CO | 4 |
| Fresno, CA | 542 |
| Grand Junction, CO | 67 |
| Grand Rapids-Wyoming, MI | 234 |
| Great Falls, MT | 72 |
| Greeley, CO | 96 |
| Greenville, NC | 54 |
| Greenville-Anderson-Mauldin, SC | 234 |
| Gulfport-Biloxi-Pascagoula, MS | 121 |
| Hagerstown-Martinsburg, MD-WV | 21 |
| Harrisburg-Carlisle, PA | 316 |
| Hartford-West Hartford-East Hartford, CT | 233 |
| Hickory-Lenoir-Morganton, NC | 111 |
| Hot Springs, AR | 665 |
| Houston-The Woodlands-Sugar Land, TX | 2,968 |
| Huntington-Ashland, WV-KY-OH | 27 |
| Huntsville, AL | 47 |
| Indianapolis-Carmel-Anderson, IN | 2,786 |
| Jacksonville, FL | 1,397 |
| Janesville-Beloit, WI | 52 |
| Joplin, MO | 11 |
| Kahului-Wailuku-Lahaina, HI | 3 |
| Kansas City, MO-KS | 1,737 |
| Kennewick-Richland, WA | 84 |
| Lake Charles, LA | 11 |
| Lakeland-Winter Haven, FL | 387 |
| Lancaster, PA | 160 |
| Las Cruces, NM | 18 |
| Las Vegas-Henderson-Paradise, NV | 835 |
| Lebanon, PA | 16 |
| Lexington-Fayette, KY | 1,556 |
| Lincoln, NE | 172 |
| Little Rock-North Little Rock-Conway, AR | 148 |
| Los Angeles-Long Beach-Anaheim, CA | 7,100 |
| Louisville-Jefferson County, KY-IN | 1,337 |
| Lubbock, TX | 12 |
| Manchester-Nashua, NH | 144 |
| Medford, OR | 23 |
| Memphis, TN-MS-AR | 1,349 |
| Miami-Fort Lauderdale-West Palm Beach, FL | 6,476 |
| Midland, TX | 99 |
| Milwaukee-Waukesha-West Allis, WI | 2,218 |
| Minneapolis-St. Paul-Bloomington, MN-WI | 3,337 |
| Missoula, MT | 20 |
| Mobile, AL | 79 |
| Myrtle Beach-Conway-North Myrtle Beach, SC-NC | 171 |
| Naples-Immokalee-Marco Island, FL | 23 |
| Nashville-Davidson–Murfreesboro–Franklin, TN | 721 |
| New Orleans-Metairie, LA | 1,522 |
| New York-Newark-Jersey City, NY-NJ-PA | 8,674 |
| North Port-Sarasota-Bradenton, FL | 549 |
| Norwich-New London, CT | 85 |
| Ocala, FL | 490 |
| Ogden-Clearfield, UT | 120 |
| Oklahoma City, OK | 1,227 |
| Oxnard-Thousand Oaks-Ventura, CA | 82 |
| Palm Bay-Melbourne-Titusville, FL | 301 |
| Phoenix-Mesa-Scottsdale, AZ | 4,398 |
| Pittsburgh, PA | 1,603 |
| Pittsfield, MA | 21 |
| Portland-South Portland, ME | 317 |
| Portland-Vancouver-Hillsboro, OR-WA | 1,042 |
| Providence-Warwick, RI-MA | 348 |
| Raleigh, NC | 1,339 |
| Reading, PA | 198 |
| Richmond, VA | 381 |
| Riverside-San Bernardino-Ontario, CA | 688 |
| Roanoke, VA | 98 |
| Rochester, NY | 676 |
| Sacramento–Roseville–Arden-Arcade, CA | 957 |
| Salem, OR | 56 |
| Salisbury, MD-DE | 138 |
| San Antonio-New Braunfels, TX | 757 |
| San Diego-Carlsbad, CA | 1,720 |
| Santa Rosa, CA | 223 |
| Seattle-Tacoma-Bellevue, WA | 3,176 |
| Sherman-Denison, TX | 6 |
| Sioux Falls, SD | 138 |
| Spartanburg, SC | 15 |
| Spokane-Spokane Valley, WA | 209 |
| St. George, UT | 20 |
| St. Joseph, MO-KS | 13 |
| St. Louis, MO-IL | 1,608 |
| State College, PA | 75 |
| Stockton-Lodi, CA | 130 |
| Tampa-St. Petersburg-Clearwater, FL | 3,302 |
| Trenton, NJ | 159 |
| Tucson, AZ | 83 |
| Tulsa, OK | 281 |
| Virginia Beach-Norfolk-Newport News, VA-NC | 148 |
| Washington-Arlington-Alexandria, DC-VA-MD-WV | 2,931 |
| Waterloo-Cedar Falls, IA | 65 |
| Watertown-Fort Drum, NY | 15 |
| Wausau, WI | 34 |
| Weirton-Steubenville, WV-OH | 18 |
| Wheeling, WV-OH | 47 |
| Winston-Salem, NC | 414 |
| Worcester, MA-CT | 97 |
| Yakima, WA | 21 |
| York-Hanover, PA | 156 |
| Youngstown-Warren-Boardman, OH-PA | 84 |
| Yuba City, CA | 34 |
| Occupation | Employment |
|---|---|
| Security guards | 8,490 |
| Ushers | 7,610 |
| Food and beverage servers | 6,980 |
| Groundskeepers | 2,350 |
| Parking lot attendants | 1,850 |
 United States Department of Labor