
International Women’s Day was first celebrated on March 19, 1911. During International Women’s Year in 1975, the United Nations began celebrating International Women’s Day on March 8.
In the United States, the first National Woman’s Day was observed on February 28, 1909. The Socialist Party of America designated this day to honor the 1908 garment workers’ strike in New York, where women protested against poor working conditions. Since President Jimmy Carter’s Presidential Proclamation in 1980, March has included a celebration of National Women’s History.
This blog celebrates women in the labor force, especially those working in STEM (science, technology, engineering, and math) professions.
Check this out: Earlier this year, to commemorate the 150th anniversary of the creation of the Periodic Table of Chemical Elements, we published our own Periodic Table of STEM Occupations!
But first some context
When President Carter issued his proclamation in 1980, 47.7 percent of women were employed, compared with 54.9 percent of women in 2018. For women ages 25 to 54, there has been an even greater increase in employment — from 60.1 percent in 1980 to 72.8 percent in 2018.
Women work in a variety of occupations. The largest number of women work as:
- Registered nurses (2.8 million)
- Elementary and middle school teachers (2.7 million)
- Secretaries and administrative assistants (2.4 million)
- Cashiers (2.4 million)
The occupations that overwhelmingly comprise women include:
- Preschool and kindergarten teachers (97.6 percent are women)
- Dental hygienists (97.1 percent)
- Speech-language pathologists (96.0 percent)
- Dental assistants (96.0 percent)
How are women doing in STEM occupations?
Three broad occupational groups have many STEM jobs: life, physical, and social science occupations; computer and mathematical occupations; and architecture and engineering occupations.
- Nearly half of the people in life, physical, and social science occupations are women.
- About 1 in 4 people working in computer and mathematical occupations are women.
- About 1 in 6 people working in architecture and engineering occupations are women.
Here’s a look at women’s shares in more specific STEM occupations.
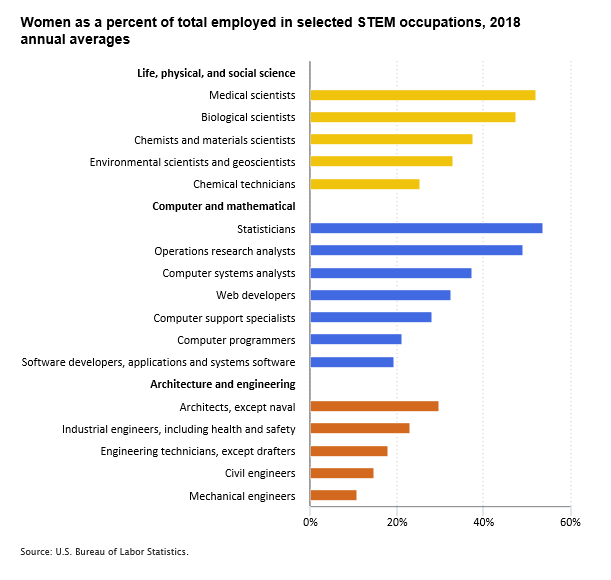
Editor’s note: Data for this chart are available in the table below.
What else can you tell us about STEM jobs?
The Occupational Employment Statistics program provides a wealth of information about employment and wages annually for more than 800 occupations. The occupational employment and wage data below are for 2017. We will release the 2018 data on March 29, 2019.
The Occupational Outlook Handbook can help you find career information on duties, education and training, pay, and job outlook for hundreds of occupations.
Let’s highlight our data for several STEM occupations for all workers:
- National employment is 581,960, and the mean annual wage is $92,740.
- California has the most computer systems analysts, with 72,980; New Jersey is one of the best paying states, at $105,750.
- Computer Systems Analysts have a projected 9-percent increase in employment from 2016 to 2026 (as fast as average).
- National employment is 265,520, and the mean annual wage is $90,340.
- Michigan has the most industrial engineers, with 28,460; Texas is one of the best paying states, at $108,330.
- Industrial Engineers have a projected 10-percent increase in employment from 2016 to 2026 (faster than average).
- National employment is 64,550, and the mean annual wage is $51,010.
- California and Texas have the most chemical technicians, with 6,450 and 6,350, respectively; Delaware is one of the best paying states, at $63,350.
- Chemical Technicians have a projected 4-percent increase in employment from 2016 to 2026 (slower than average).
Some final thoughts
These STEM occupations pay more, and sometimes significantly more, than the mean annual wage for all workers of $50,620. In 2017, the mean wage for STEM jobs was $91,310.
There were nearly 8.9 million STEM jobs in May 2017, representing 6.2 percent of U.S. employment. Employment in STEM occupations is projected to increase by 10.9 percent (faster than average) from 2016 to 2026. This growth is expected to result in 1.0 million new jobs.
Want more information?
Current Population Survey for employment of women: email or phone (202) 691-6378.
Occupational Employment Statistics for occupational employment and wages data at the national, state, and local level: email or phone (202) 691-6569.
Occupational Outlook Handbook for occupational descriptions and projections: email or phone (202) 691-5700.
| Occupation | Percent who are women |
|---|---|
| Life, physical, and social science | 46.7% |
Medical scientists | 52.1 |
Biological scientists | 47.5 |
Chemists and materials scientists | 37.7 |
Environmental scientists and geoscientists | 33.1 |
Chemical technicians | 25.3 |
| Computer and mathematical | 25.6 |
Statisticians | 53.8 |
Operations research analysts | 49.1 |
Computer systems analysts | 37.5 |
Web developers | 32.5 |
Computer support specialists | 28.1 |
Computer programmers | 21.2 |
Software developers, applications and systems software | 19.3 |
| Architecture and engineering | 15.9 |
Architects, except naval | 29.7 |
Industrial engineers, including health and safety | 23.0 |
Engineering technicians, except drafters | 18.1 |
Civil engineers | 14.8 |
Mechanical engineers | 10.9 |