May is Older Americans Month. Who are we calling old?
- The Bureau of Labor Statistics, for one. Next month we will celebrate our 135th birthday. Now that’s old! And we’ve been providing gold-standard information the entire time.
- Today we are focusing on people age 65 and older.
In honor of Older Americans Month, let’s examine some fast facts about older workers. Many of these facts look over the last 30 years.
Employment
- For workers age 65 and older, employment tripled from 1988 to 2018, while employment among younger workers grew by about a third.
- Between 1988 and 2018, employment growth for women age 65 and older outpaced that for men.
- Among people age 75 and older, the number of employed people nearly quadrupled, increasing from 461,000 in 1988 to 1.8 million in 2018.
Participation in the Labor Force
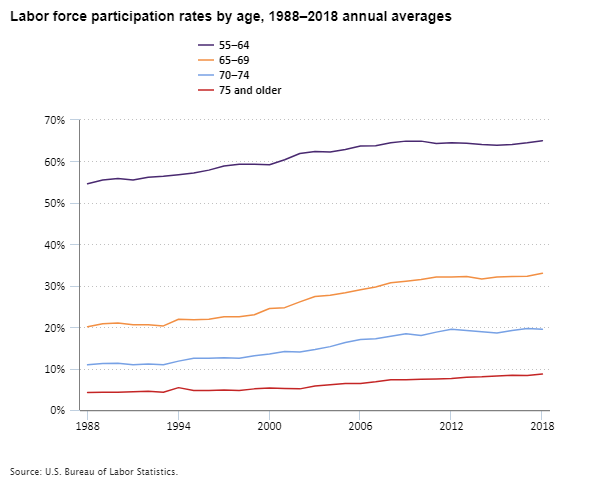
- The labor force participation rate for older workers has been rising steadily since the late 1990s. Participation rates for younger age groups either declined or flattened over this period.

Editor’s note: Data for this chart are available in the table below.
Employment Projections
- The total labor force is projected to increase by 6.6 percent from 2016 to 2026, while the number of workers age 65 and older is predicted to rise by 57.6 percent.
- By 2026, workers age 65 and older are expected to account for 8.6 percent of the total labor force, up from 5.8 percent in 2016.
- The labor force participation rate of people age 65 and older is projected to increase from 19.3 percent in 2016 to 21.8 percent in 2026. This contrasts with the overall labor force participation rate, which is expected to decrease from 62.8 percent to 61.0 percent.
Work Schedules
- Over the past 20 years, the number of older workers on full‐time work schedules grew two and a half times faster than the number working part time.
- Full‐timers now account for a majority among older workers—61 percent in 2018, up from 46 percent in 1998.
Earnings
- In 1998, median weekly earnings of older full‐time employees were 77 percent of the median for workers age 16 and up. In 2018, older workers earned 7 percent more than the median for all workers.
Education
- In 1998, 1 in 5 older workers had less than a high school education. By 2018, fewer than 1 in 10 older workers had less than a high school diploma.
- The percentage of older workers with a college degree grew from 26 percent in 1998 to 42 percent in 2018.
Safety and Health
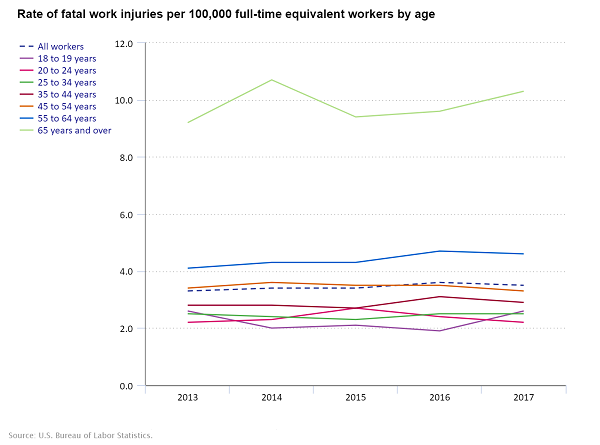
- While fatal occupational injuries to all workers declined 17 percent from 1992 to 2017, workers age 65 and older incurred 66 percent more fatal work injuries in 2017 (775) than they did in 1992 (467).
- Workers age 65 and older had a fatality rate that was nearly three times the rate for all workers in 2017.

Editor’s note: Data for this chart are available in the table below.
Want to know more? These statistical programs contributed data to this blog:
From an American worker’s first job to retirement and everything in between, BLS has a stat for that!
| Year | 55–64 | 65–69 | 70–74 | 75 and older |
|---|---|---|---|---|
| 1988 | 54.6 | 20.1 | 10.9 | 4.2 |
| 1989 | 55.5 | 20.8 | 11.2 | 4.3 |
| 1990 | 55.9 | 21.0 | 11.3 | 4.3 |
| 1991 | 55.5 | 20.6 | 10.9 | 4.4 |
| 1992 | 56.2 | 20.6 | 11.1 | 4.5 |
| 1993 | 56.4 | 20.3 | 10.9 | 4.3 |
| 1994 | 56.8 | 21.9 | 11.8 | 5.4 |
| 1995 | 57.2 | 21.8 | 12.5 | 4.7 |
| 1996 | 57.9 | 21.9 | 12.5 | 4.7 |
| 1997 | 58.9 | 22.5 | 12.6 | 4.8 |
| 1998 | 59.3 | 22.5 | 12.5 | 4.7 |
| 1999 | 59.3 | 23.0 | 13.1 | 5.1 |
| 2000 | 59.2 | 24.5 | 13.5 | 5.3 |
| 2001 | 60.4 | 24.7 | 14.1 | 5.2 |
| 2002 | 61.9 | 26.1 | 14.0 | 5.1 |
| 2003 | 62.4 | 27.4 | 14.6 | 5.8 |
| 2004 | 62.3 | 27.7 | 15.3 | 6.1 |
| 2005 | 62.9 | 28.3 | 16.3 | 6.4 |
| 2006 | 63.7 | 29.0 | 17.0 | 6.4 |
| 2007 | 63.8 | 29.7 | 17.2 | 6.8 |
| 2008 | 64.5 | 30.7 | 17.8 | 7.3 |
| 2009 | 64.9 | 31.1 | 18.4 | 7.3 |
| 2010 | 64.9 | 31.5 | 18.0 | 7.4 |
| 2011 | 64.3 | 32.1 | 18.8 | 7.5 |
| 2012 | 64.5 | 32.1 | 19.5 | 7.6 |
| 2013 | 64.4 | 32.2 | 19.2 | 7.9 |
| 2014 | 64.1 | 31.6 | 18.9 | 8.0 |
| 2015 | 63.9 | 32.1 | 18.6 | 8.2 |
| 2016 | 64.1 | 32.2 | 19.2 | 8.4 |
| 2017 | 64.5 | 32.3 | 19.7 | 8.3 |
| 2018 | 65.0 | 33.0 | 19.5 | 8.7 |
| Year | All workers | 18 to 19 years | 20 to 24 years | 25 to 34 years | 35 to 44 years | 45 to 54 years | 55 to 64 years | 65 years and over |
|---|---|---|---|---|---|---|---|---|
| 2013 | 3.3 | 2.6 | 2.2 | 2.5 | 2.8 | 3.4 | 4.1 | 9.2 |
| 2014 | 3.4 | 2.0 | 2.3 | 2.4 | 2.8 | 3.6 | 4.3 | 10.7 |
| 2015 | 3.4 | 2.1 | 2.7 | 2.3 | 2.7 | 3.5 | 4.3 | 9.4 |
| 2016 | 3.6 | 1.9 | 2.4 | 2.5 | 3.1 | 3.5 | 4.7 | 9.6 |
| 2017 | 3.5 | 2.6 | 2.2 | 2.5 | 2.9 | 3.3 | 4.6 | 10.3 |
 United States Department of Labor