
While international trade has become increasingly important to our economy over the past 60 years, U.S. households and businesses continue to rely primarily on local markets for most goods and services. The products we create come from all over our country. Workers, businesses, and policymakers care deeply about the economy in our own backyards. That’s why BLS recently began publishing new data on labor productivity by state and, separately, on job openings and labor turnover by state.
State labor productivity
Our measures of labor productivity for states are still experimental, meaning we’re still assessing them and considering ways to improve them. These measures cover the private nonfarm sector for all 50 states and the District of Columbia from 2007 to 2017. They show that labor productivity growth varies a lot from state to state. From 2007 to 2017, labor productivity changes ranged from a gain of 3.1 percent per year in North Dakota to a loss of 0.7 percent per year in Louisiana. In 2017, labor productivity grew fastest in Montana (2.0 percent), West Virginia (1.9 percent), California (1.8 percent), and Hawaii (1.7 percent). You can get the complete dataset from our state labor productivity page.
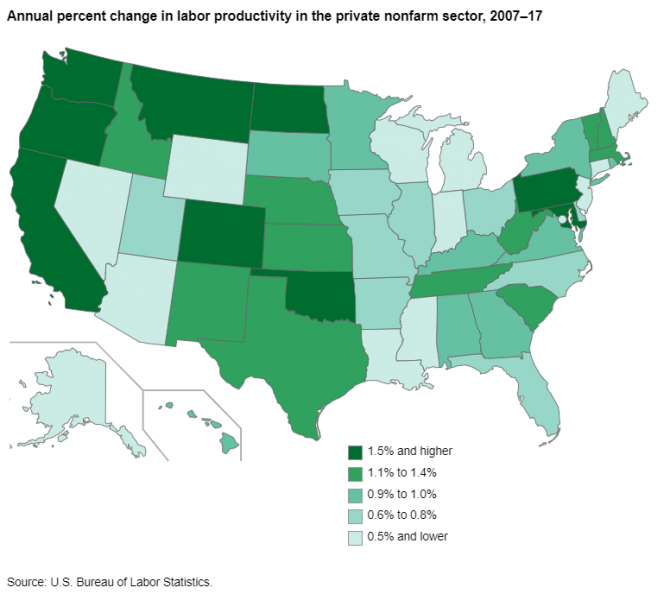
Editor’s note: Data for this map are available in the table below.
We construct these state measures from data published by several BLS programs and by our colleagues at the Bureau of Economic Analysis. A recent Monthly Labor Review article, “BLS publishes experimental state-level labor productivity measures,” explains the data and the methods for putting them all together. The article also highlights how you might use these new state data. We’re happy to have your feedback on these new measures. Just send us an email.
State job openings and labor turnover
We also have new data on job openings, hiring, and separations by state. Data from the Job Openings and Labor Turnover Survey are widely used by economic policymakers and others who want to understand the job flows that lead to net changes in employment. We have these data back to December 2000 and update them every month for the nation and the four broad census regions. Now we have them for all states and the District of Columbia too. These state estimates are available from February 2001 through December 2018 for the total nonfarm sector.
Many of you have told us you want more geographic details about job openings and turnover. To make sense of data on job openings, for example, it helps to know where the jobs are. The survey sample size is designed to estimate job openings and turnover for major industries only at the national and regional levels. For several years we have researched ways to produce model-assisted estimates for states. As with the state productivity data, these estimates are experimental. We plan to update the state estimates each quarter while we assess your feedback on the models and the usefulness of the data. We encourage you to send us your comments.
But wait, there’s more! We’ve updated the BLS Local Data App!
In previous blog posts, we’ve told you about our mobile app for customers who want to know more about local labor markets. This app now includes employment and wage data for detailed industries and occupations. (It doesn’t yet have the new data on state productivity, job openings, and turnover.)
Interested in local data for a particular industry or occupation? The latest version allows you to quickly search or use the built-in industry and occupational lists. Want to know which industry employs the most workers in your area or which occupation pays the highest? The updated app allows you to sort the employment and wage data across groups of industries and occupations. You can still find data on unemployment rates and total employment. You also can find your state, metro area, or county by searching for a zip code or using your device’s current location.
These new data and features result from the continued partnership between BLS and the U.S. Department of Labor’s Office of the Chief Information Officer. Be on the lookout for more new features to be added in future releases.
Download the BLS Local Data app from the App Store or Google Play today!
| State | Annual percent change |
|---|---|
| North Dakota | 3.1 |
| California | 1.7 |
| Oregon | 1.7 |
| Washington | 1.7 |
| Colorado | 1.6 |
| Oklahoma | 1.6 |
| Maryland | 1.5 |
| Montana | 1.5 |
| Pennsylvania | 1.5 |
| Massachusetts | 1.4 |
| New Mexico | 1.4 |
| Vermont | 1.4 |
| Idaho | 1.3 |
| Kansas | 1.3 |
| Nebraska | 1.1 |
| New Hampshire | 1.1 |
| South Carolina | 1.1 |
| Tennessee | 1.1 |
| Texas | 1.1 |
| West Virginia | 1.1 |
| Alabama | 1.0 |
| Hawaii | 1.0 |
| Kentucky | 1.0 |
| Minnesota | 1.0 |
| New York | 1.0 |
| Rhode Island | 1.0 |
| South Dakota | 1.0 |
| Virginia | 1.0 |
| Georgia | 0.9 |
| Arkansas | 0.8 |
| Missouri | 0.8 |
| Ohio | 0.8 |
| Utah | 0.8 |
| Illinois | 0.7 |
| North Carolina | 0.7 |
| Delaware | 0.6 |
| Florida | 0.6 |
| Iowa | 0.6 |
| Indiana | 0.5 |
| Mississippi | 0.5 |
| New Jersey | 0.5 |
| Wisconsin | 0.5 |
| Alaska | 0.4 |
| Arizona | 0.4 |
| District of Columbia | 0.4 |
| Michigan | 0.4 |
| Maine | 0.3 |
| Nevada | 0.3 |
| Wyoming | 0.1 |
| Connecticut | -0.5 |
| Louisiana | -0.7 |