
We have a guest blogger for this edition of Commissioner’s Corner. Brendan Williams is an economist in the Office of Prices and Living Conditions at the U.S. Bureau of Labor Statistics.
For nearly as long as cars and trucks have been sold, the BLS Consumer Price Index (CPI) has tracked changes in the prices consumers pay for new vehicles. Our traditional method of determining the change in vehicle prices is to survey dealers and collect estimated prices for models with a specific set of features. For example, a Brand X 8-cylinder two-door sports coupe with a sunroof. We recently debuted a research index for new vehicles based on a large dataset of prices actually paid, which we call “transaction” prices. This is just one of many efforts currently underway in the CPI (and throughout BLS) to identify and introduce new sources of data into our statistical measures. As you are about to learn, a lot goes into introducing these new measures.
We purchased the new data for new vehicles from J.D. Power. The new dataset includes records of the prices paid during hundreds of thousands of transactions every month—far more than the roughly 2,000 vehicle prices in the CPI sample. The larger dataset provides more precise measures of price change.
But it’s not as simple as plugging the new data into the monthly CPI. We found that applying current CPI methods to the transaction data produced a biased index. So we had to make some changes. We combined an estimate of the long-run trend in new vehicle prices with a measure of high-frequency fluctuations in the market. The long-run trend is based on the year-over-year price change between a vehicle in the current month and the same vehicle in the prior model year 12 months ago; we get these values from the J.D. Power data. The high-frequency fluctuation is extracted from a monthly index based on current methods used in the CPI.
The research index includes all types of new vehicles—cars, SUVs, and trucks. And since the data reflect actual transactions, the shift in consumer preference from cars to other types of vehicles is reflected in the data. This differs from the currently published CPI, which has maintained a roughly equal weight between cars and trucks.
The new vehicles research index performs very similarly to the published index. From December 2007 to March 2020, the research index (untaxed) increased 8.2 percent, while the official new vehicles index (which is taxed) increased 7.7 percent. Looking under the hood, the research truck index is also similar to its published index. The difference in the car indexes is larger, with the official index showing a 5.2-percent increase, while the research index shows only a 1.5-percent increase.
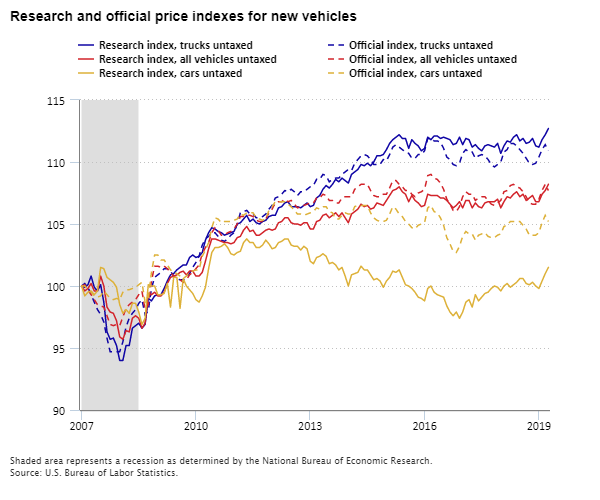
Editor’s note: Data for this chart are available in the table below.
While the new vehicle indexes look similar, the research index has a much lower standard error, which means there is less variation in the data. The research index had a 12-month standard error of 0.11, compared to the 0.43 standard error in the new vehicles index.
This research index is just one of many ways BLS is innovating the CPI and all our measures. For more information on BLS efforts to use new sources of data in the CPI, see “Big Data in the U.S. Consumer Price Index: Experiences & Plans.” Details of the methods and other aspects of research are in, “A New Vehicles Transaction Price Index: Offsetting the Effects of Price Discrimination and Product Cycle Bias with a Year-Over-Year Index.”
We are asking for your feedback about whether to use this research index or the current index. We specifically want to know whether you think this proposal improves our methods and data sources. Please tell us what you think about the research new vehicles data by emailing cpixnv@bls.gov. You can send other CPI-related questions to cpi_info@bls.gov.
| Month | Research index, trucks untaxed | Official index, trucks untaxed | Research index, all vehicles untaxed | Official index, all vehicles untaxed | Research index, cars untaxed | Official index, cars untaxed |
|---|---|---|---|---|---|---|
| Dec 2007 | 100.0 | 100.0 | 100.0 | 100.0 | 100.0 | 100.0 |
| Jan 2008 | 99.9 | 100.2 | 99.6 | 100.1 | 99.2 | 100.0 |
| Feb 2008 | 100.1 | 99.9 | 99.8 | 99.7 | 99.5 | 99.7 |
| Mar 2008 | 100.8 | 99.3 | 100.2 | 99.3 | 99.6 | 99.5 |
| Apr 2008 | 99.9 | 98.7 | 99.6 | 98.9 | 99.3 | 99.2 |
| May 2008 | 99.6 | 98.1 | 99.6 | 98.5 | 99.6 | 99.1 |
| Jun 2008 | 100.1 | 97.7 | 100.8 | 98.4 | 101.5 | 99.2 |
| Jul 2008 | 98.7 | 97.1 | 100.0 | 98.3 | 101.4 | 99.6 |
| Aug 2008 | 96.3 | 95.8 | 98.3 | 97.6 | 100.7 | 99.3 |
| Sep 2008 | 95.7 | 94.7 | 97.9 | 96.9 | 100.5 | 99.0 |
| Oct 2008 | 95.8 | 94.7 | 97.8 | 96.8 | 100.3 | 98.9 |
| Nov 2008 | 95.2 | 94.7 | 97.2 | 96.9 | 99.9 | 99.0 |
| Dec 2008 | 94.0 | 94.7 | 95.9 | 96.8 | 98.5 | 98.9 |
| Jan 2009 | 94.0 | 95.5 | 95.7 | 97.5 | 97.8 | 99.5 |
| Feb 2009 | 95.2 | 96.7 | 96.4 | 98.2 | 98.1 | 99.7 |
| Mar 2009 | 95.2 | 97.4 | 96.3 | 98.5 | 97.8 | 99.7 |
| Apr 2009 | 96.6 | 97.8 | 97.4 | 98.7 | 98.6 | 99.8 |
| May 2009 | 96.8 | 98.1 | 97.6 | 98.9 | 98.6 | 99.9 |
| Jun 2009 | 97.0 | 98.6 | 97.4 | 99.3 | 97.9 | 100.1 |
| Jul 2009 | 96.6 | 98.9 | 96.6 | 99.6 | 96.9 | 100.3 |
| Aug 2009 | 96.9 | 97.7 | 97.0 | 98.1 | 97.4 | 98.7 |
| Sep 2009 | 99.0 | 98.0 | 99.4 | 98.5 | 100.1 | 99.0 |
| Oct 2009 | 98.8 | 99.8 | 99.3 | 100.4 | 100.0 | 101.1 |
| Nov 2009 | 99.2 | 100.7 | 99.5 | 101.6 | 100.0 | 102.5 |
| Dec 2009 | 99.3 | 100.9 | 99.2 | 101.6 | 99.3 | 102.5 |
| Jan 2010 | 99.3 | 101.1 | 99.2 | 101.5 | 99.3 | 102.1 |
| Feb 2010 | 99.8 | 101.4 | 99.5 | 101.6 | 99.4 | 102.1 |
| Mar 2010 | 100.4 | 101.4 | 100.2 | 101.4 | 100.2 | 101.7 |
| Apr 2010 | 100.9 | 101.2 | 100.7 | 101.1 | 98.3 | 101.3 |
| May 2010 | 101.0 | 100.8 | 100.8 | 100.8 | 100.7 | 101.1 |
| Jun 2010 | 101.3 | 100.6 | 100.9 | 100.6 | 100.7 | 101.0 |
| Jul 2010 | 101.5 | 100.5 | 101.1 | 100.5 | 98.2 | 100.8 |
| Aug 2010 | 101.7 | 100.5 | 101.2 | 100.3 | 100.6 | 100.6 |
| Sep 2010 | 101.7 | 100.7 | 100.9 | 100.5 | 100.0 | 100.8 |
| Oct 2010 | 102.3 | 101.0 | 101.2 | 100.9 | 99.7 | 101.1 |
| Nov 2010 | 102.5 | 101.5 | 101.2 | 101.1 | 99.4 | 101.2 |
| Dec 2010 | 102.3 | 101.9 | 100.8 | 101.4 | 98.9 | 101.3 |
| Jan 2011 | 102.4 | 102.4 | 100.8 | 101.7 | 98.7 | 101.3 |
| Feb 2011 | 102.7 | 103.3 | 101.1 | 102.6 | 99.2 | 102.4 |
| Mar 2011 | 103.7 | 103.8 | 102.0 | 103.1 | 99.9 | 102.9 |
| Apr 2011 | 104.3 | 104.0 | 103.0 | 103.5 | 101.4 | 103.5 |
| May 2011 | 104.7 | 104.3 | 103.8 | 104.3 | 102.7 | 104.7 |
| Jun 2011 | 104.6 | 104.3 | 103.8 | 104.7 | 103.1 | 105.5 |
| Jul 2011 | 104.4 | 104.0 | 103.7 | 104.5 | 103.1 | 105.4 |
| Aug 2011 | 104.3 | 103.7 | 103.6 | 104.1 | 103.2 | 105.1 |
| Sep 2011 | 104.1 | 103.6 | 103.5 | 104.1 | 103.4 | 105.2 |
| Oct 2011 | 104.2 | 103.8 | 103.5 | 104.3 | 103.1 | 105.2 |
| Nov 2011 | 104.3 | 104.1 | 103.4 | 104.4 | 102.6 | 105.2 |
| Dec 2011 | 104.4 | 104.3 | 103.5 | 104.6 | 102.5 | 105.3 |
| Jan 2012 | 105.0 | 105.0 | 103.9 | 105.0 | 102.7 | 105.4 |
| Feb 2012 | 105.1 | 105.9 | 104.0 | 105.6 | 102.8 | 105.8 |
| Mar 2012 | 105.4 | 106.0 | 104.5 | 105.6 | 103.5 | 105.7 |
| Apr 2012 | 105.7 | 106.1 | 104.8 | 105.7 | 103.8 | 105.9 |
| May 2012 | 105.2 | 105.8 | 104.4 | 105.7 | 103.5 | 105.9 |
| Jun 2012 | 105.4 | 105.8 | 104.5 | 105.6 | 103.5 | 105.9 |
| Jul 2012 | 105.1 | 105.5 | 104.1 | 105.3 | 103.1 | 105.5 |
| Aug 2012 | 105.0 | 105.5 | 104.1 | 105.2 | 103.1 | 105.4 |
| Sep 2012 | 105.2 | 105.6 | 104.3 | 105.2 | 103.3 | 105.3 |
| Oct 2012 | 105.3 | 105.8 | 104.5 | 105.4 | 103.7 | 105.4 |
| Nov 2012 | 105.6 | 106.2 | 104.6 | 105.9 | 103.4 | 106.1 |
| Dec 2012 | 105.7 | 106.5 | 104.5 | 106.2 | 103.0 | 106.4 |
| Jan 2013 | 105.7 | 107.1 | 104.6 | 106.7 | 103.1 | 106.8 |
| Feb 2013 | 106.3 | 107.2 | 105.1 | 106.8 | 103.5 | 106.8 |
| Mar 2013 | 106.4 | 107.4 | 105.2 | 106.8 | 103.6 | 106.8 |
| Apr 2013 | 106.7 | 107.7 | 105.5 | 107.0 | 103.8 | 106.8 |
| May 2013 | 106.8 | 107.6 | 105.5 | 106.8 | 103.8 | 106.6 |
| Jun 2013 | 106.4 | 107.8 | 105.1 | 106.9 | 103.3 | 106.4 |
| Jul 2013 | 106.4 | 107.6 | 105.0 | 106.6 | 103.2 | 106.1 |
| Aug 2013 | 106.4 | 107.3 | 105.0 | 106.3 | 103.2 | 105.8 |
| Sep 2013 | 106.3 | 107.6 | 104.9 | 106.4 | 102.9 | 105.8 |
| Oct 2013 | 106.5 | 107.6 | 105.1 | 106.5 | 103.2 | 105.7 |
| Nov 2013 | 106.7 | 107.8 | 105.1 | 106.6 | 103.0 | 105.8 |
| Dec 2013 | 106.4 | 108.0 | 104.6 | 106.7 | 102.0 | 105.9 |
| Jan 2014 | 106.5 | 108.1 | 104.6 | 106.7 | 101.8 | 106.0 |
| Feb 2014 | 107.1 | 108.6 | 105.2 | 107.1 | 102.3 | 106.3 |
| Mar 2014 | 107.3 | 108.6 | 105.3 | 107.1 | 102.4 | 106.2 |
| Apr 2014 | 107.8 | 109.0 | 105.7 | 107.4 | 102.6 | 106.4 |
| May 2014 | 108.1 | 108.9 | 105.8 | 107.3 | 102.4 | 106.4 |
| Jun 2014 | 107.9 | 108.4 | 105.5 | 106.9 | 101.8 | 106.0 |
| Jul 2014 | 108.2 | 108.6 | 105.7 | 106.9 | 101.9 | 105.9 |
| Aug 2014 | 108.6 | 108.7 | 105.9 | 106.7 | 101.7 | 105.4 |
| Sep 2014 | 108.4 | 108.7 | 105.6 | 106.7 | 101.3 | 105.4 |
| Oct 2014 | 108.7 | 109.0 | 105.9 | 107.1 | 101.5 | 105.7 |
| Nov 2014 | 108.5 | 109.2 | 105.5 | 107.2 | 100.8 | 105.9 |
| Dec 2014 | 108.3 | 109.4 | 105.1 | 107.2 | 100.0 | 105.8 |
| Jan 2015 | 109.0 | 109.3 | 105.8 | 107.2 | 100.9 | 105.8 |
| Feb 2015 | 109.2 | 109.9 | 106.0 | 107.8 | 101.0 | 106.4 |
| Mar 2015 | 109.4 | 110.2 | 106.2 | 108.0 | 101.1 | 106.5 |
| Apr 2015 | 109.8 | 110.5 | 106.6 | 108.2 | 101.6 | 106.5 |
| May 2015 | 109.7 | 110.6 | 106.4 | 108.2 | 101.3 | 106.5 |
| Jun 2015 | 109.9 | 110.5 | 106.5 | 108.2 | 101.3 | 106.5 |
| Jul 2015 | 109.7 | 110.2 | 106.2 | 107.7 | 100.9 | 105.9 |
| Aug 2015 | 110.0 | 109.8 | 106.3 | 107.3 | 100.5 | 105.5 |
| Sep 2015 | 110.5 | 109.8 | 106.7 | 107.2 | 100.6 | 105.3 |
| Oct 2015 | 110.5 | 109.8 | 106.6 | 107.2 | 100.4 | 105.2 |
| Nov 2015 | 110.6 | 110.2 | 106.5 | 107.4 | 99.9 | 105.2 |
| Dec 2015 | 111.0 | 110.1 | 106.9 | 107.4 | 100.4 | 105.3 |
| Jan 2016 | 111.5 | 110.6 | 107.3 | 107.9 | 100.7 | 105.8 |
| Feb 2016 | 111.8 | 111.2 | 107.7 | 108.5 | 101.2 | 106.4 |
| Mar 2016 | 112.0 | 111.4 | 107.8 | 108.5 | 101.1 | 106.2 |
| Apr 2016 | 112.2 | 111.2 | 108.0 | 108.2 | 101.3 | 105.8 |
| May 2016 | 111.9 | 111.0 | 107.6 | 108.0 | 100.7 | 105.6 |
| Jun 2016 | 111.9 | 110.8 | 107.4 | 107.7 | 100.1 | 105.2 |
| Jul 2016 | 111.1 | 110.7 | 106.8 | 107.7 | 100.0 | 105.0 |
| Aug 2016 | 111.8 | 110.3 | 107.3 | 107.4 | 99.8 | 104.7 |
| Sep 2016 | 111.5 | 110.3 | 106.9 | 107.2 | 99.5 | 104.6 |
| Oct 2016 | 111.3 | 110.6 | 106.7 | 107.5 | 99.1 | 104.9 |
| Nov 2016 | 110.9 | 110.6 | 106.4 | 107.6 | 99.0 | 105.0 |
| Dec 2016 | 111.1 | 110.9 | 106.5 | 107.8 | 98.8 | 105.1 |
| Jan 2017 | 112.0 | 111.9 | 107.4 | 108.9 | 99.8 | 106.3 |
| Feb 2017 | 111.8 | 111.9 | 107.3 | 109.0 | 100.0 | 106.5 |
| Mar 2017 | 112.1 | 111.7 | 107.3 | 108.7 | 99.5 | 106.0 |
| Apr 2017 | 112.1 | 111.7 | 107.3 | 108.6 | 99.3 | 105.9 |
| May 2017 | 111.9 | 111.6 | 107.1 | 108.3 | 99.2 | 105.5 |
| Jun 2017 | 112.0 | 111.1 | 107.1 | 107.8 | 99.1 | 104.9 |
| Jul 2017 | 111.9 | 110.4 | 106.9 | 107.0 | 98.4 | 103.9 |
| Aug 2017 | 111.8 | 110.2 | 106.6 | 106.6 | 97.9 | 103.4 |
| Sep 2017 | 111.4 | 109.8 | 106.3 | 106.1 | 97.6 | 102.8 |
| Oct 2017 | 111.5 | 109.7 | 106.5 | 106.0 | 97.9 | 102.7 |
| Nov 2017 | 112.0 | 109.9 | 106.8 | 106.4 | 97.4 | 103.2 |
| Dec 2017 | 111.4 | 110.7 | 106.3 | 107.2 | 97.9 | 104.0 |
| Jan 2018 | 111.9 | 111.0 | 106.9 | 107.6 | 98.7 | 104.4 |
| Feb 2018 | 111.8 | 110.8 | 106.9 | 107.4 | 98.9 | 104.2 |
| Mar 2018 | 111.2 | 110.8 | 106.3 | 107.4 | 98.3 | 104.2 |
| Apr 2018 | 111.4 | 110.3 | 106.7 | 106.9 | 99.3 | 103.7 |
| May 2018 | 111.1 | 110.5 | 106.4 | 107.1 | 98.8 | 104.1 |
| Jun 2018 | 110.9 | 110.6 | 106.3 | 107.2 | 99.1 | 104.2 |
| Jul 2018 | 111.3 | 110.5 | 106.7 | 107.2 | 99.4 | 104.3 |
| Aug 2018 | 111.4 | 110.2 | 106.8 | 106.9 | 99.5 | 104.0 |
| Sep 2018 | 111.3 | 109.8 | 106.8 | 106.6 | 99.8 | 103.9 |
| Oct 2018 | 111.2 | 109.6 | 106.8 | 106.5 | 100.0 | 103.9 |
| Nov 2018 | 111.5 | 109.8 | 107.0 | 106.7 | 99.9 | 104.1 |
| Dec 2018 | 110.7 | 110.0 | 106.3 | 106.9 | 99.6 | 104.2 |
| Jan 2019 | 111.3 | 110.8 | 106.8 | 107.6 | 100.0 | 104.8 |
| Feb 2019 | 111.7 | 111.0 | 107.2 | 107.7 | 100.2 | 104.9 |
| Mar 2019 | 111.6 | 111.5 | 107.1 | 108.1 | 99.9 | 105.2 |
| Apr 2019 | 112.0 | 111.5 | 107.4 | 108.2 | 100.1 | 105.2 |
| May 2019 | 112.2 | 111.3 | 107.6 | 108.0 | 100.3 | 105.2 |
| Jun 2019 | 111.7 | 111.0 | 107.2 | 107.9 | 100.6 | 105.2 |
| Jul 2019 | 111.9 | 110.7 | 107.4 | 107.6 | 100.6 | 104.9 |
| Aug 2019 | 111.5 | 110.3 | 106.9 | 107.2 | 100.2 | 104.6 |
| Sep 2019 | 111.6 | 109.9 | 107.1 | 106.7 | 100.1 | 104.1 |
| Oct 2019 | 111.9 | 109.8 | 107.3 | 106.6 | 100.3 | 104.1 |
| Nov 2019 | 111.3 | 109.9 | 106.8 | 106.6 | 100.0 | 104.1 |
| Dec 2019 | 111.2 | 110.4 | 106.8 | 107.0 | 99.8 | 104.3 |
| Jan 2020 | 111.8 | 111.0 | 107.4 | 107.7 | 100.4 | 105.1 |
| Feb 2020 | 112.2 | 111.4 | 107.7 | 108.2 | 101.0 | 105.7 |
| Mar 2020 | 112.7 | 110.9 | 108.2 | 107.7 | 101.5 | 105.2 |