
BLS recently began publishing a new set of measures on employment changes in states and metropolitan areas. For decades we have published monthly estimates of employment, hours, and earnings for each state and metro area. Our new measure summarizes how widespread employment increases or decreases are across all states or metro areas. We call this measure a diffusion index.
What’s a diffusion index? Let me explain how we create the measure.
Let’s say we’re creating a diffusion index for the 50 states and the District of Columbia. We start by assigning each state and D.C. a value depending on whether its employment decreased, stayed the same, or increased over the period we’re looking at.
- The assigned value is 0 if employment decreased.
- The assigned value is 50 if employment stayed the same.
- The assigned value is 100 if employment increased.
The diffusion index is the average of those 51 values. To create a diffusion index for metro areas, we assign values of 0, 50, or 100 for each of 388 metro areas and then average those values. We calculate diffusion indexes for employment changes over 1 month, 3 months, 6 months, and 12 months.
Now that we understand the simple arithmetic for calculating diffusion indexes, what do they mean? An index greater than 50 means more states or metro areas had increasing employment over the period. An index below 50 means more states or metro areas had decreasing employment. At the extremes, an index of 0 means employment fell in all states or metro areas; an index of 100 means employment rose in all of them. A diffusion index of 50 doesn’t necessarily mean 50 percent of the states or areas had increasing employment and the other 50 percent had decreasing employment. It just means the same number of states or areas had increases and decreases, with any of the other states or areas having no change.
The chart below shows 3-month diffusion indexes for all states and metro areas. You can see how all states and nearly all metro areas had job losses during the worst of the 2007–09 recession. We see it again more recently with the downturn associated with the COVID-19 pandemic.
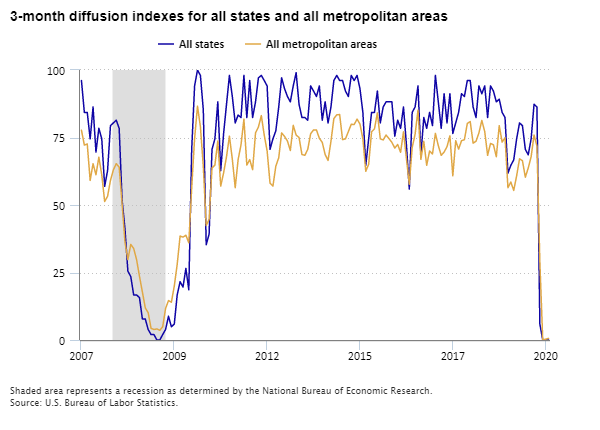
Editor’s note: Data for this chart are available in the table below.
Diffusion indexes aren’t a new analytical tool. We publish other diffusion indexes using national employment data that summarize how employment change is dispersed across industries. The Federal Reserve Bank of Philadelphia publishes diffusion indexes using a variety of data. The new BLS diffusion indexes summarize how employment is changing across geographic areas to give us another perspective of the labor market.
Keep a look out for the new data. We update the indexes each month in our public database.
| Month | All states | All metropolitan areas |
|---|---|---|
Jan 2007 | 96.1 | 77.7 |
Feb 2007 | 84.3 | 72.2 |
Mar 2007 | 84.3 | 72.6 |
Apr 2007 | 74.5 | 59.1 |
May 2007 | 86.3 | 65.3 |
Jun 2007 | 69.6 | 61.2 |
Jul 2007 | 78.4 | 67.7 |
Aug 2007 | 74.5 | 61.2 |
Sep 2007 | 56.9 | 51.3 |
Oct 2007 | 62.7 | 53.2 |
Nov 2007 | 79.4 | 59.1 |
Dec 2007 | 80.4 | 63.0 |
Jan 2008 | 81.4 | 65.3 |
Feb 2008 | 78.4 | 64.0 |
Mar 2008 | 52.0 | 50.6 |
Apr 2008 | 41.2 | 36.2 |
May 2008 | 25.5 | 29.8 |
Jun 2008 | 23.5 | 35.4 |
Jul 2008 | 16.7 | 33.9 |
Aug 2008 | 16.7 | 29.8 |
Sep 2008 | 15.7 | 23.6 |
Oct 2008 | 7.8 | 17.8 |
Nov 2008 | 7.8 | 11.9 |
Dec 2008 | 3.9 | 10.1 |
Jan 2009 | 2.0 | 4.3 |
Feb 2009 | 2.0 | 3.9 |
Mar 2009 | 0.0 | 4.1 |
Apr 2009 | 0.0 | 3.6 |
May 2009 | 2.0 | 4.9 |
Jun 2009 | 3.9 | 11.7 |
Jul 2009 | 8.8 | 14.6 |
Aug 2009 | 4.9 | 14.0 |
Sep 2009 | 5.9 | 20.0 |
Oct 2009 | 16.7 | 28.0 |
Nov 2009 | 21.6 | 38.5 |
Dec 2009 | 19.6 | 38.1 |
Jan 2010 | 26.5 | 38.8 |
Feb 2010 | 18.6 | 36.0 |
Mar 2010 | 70.6 | 56.3 |
Apr 2010 | 94.1 | 74.6 |
May 2010 | 100.0 | 86.6 |
Jun 2010 | 98.0 | 79.0 |
Jul 2010 | 85.3 | 64.3 |
Aug 2010 | 35.3 | 42.4 |
Sep 2010 | 39.2 | 44.7 |
Oct 2010 | 70.6 | 63.7 |
Nov 2010 | 74.5 | 64.8 |
Dec 2010 | 88.2 | 73.7 |
Jan 2011 | 62.7 | 57.0 |
Feb 2011 | 76.5 | 61.9 |
Mar 2011 | 87.3 | 67.9 |
Apr 2011 | 98.0 | 75.5 |
May 2011 | 90.2 | 67.0 |
Jun 2011 | 80.4 | 56.4 |
Jul 2011 | 83.3 | 66.8 |
Aug 2011 | 82.4 | 72.3 |
Sep 2011 | 98.0 | 81.8 |
Oct 2011 | 82.4 | 64.8 |
Nov 2011 | 96.1 | 66.8 |
Dec 2011 | 82.4 | 63.1 |
Jan 2012 | 88.2 | 76.7 |
Feb 2012 | 97.1 | 78.9 |
Mar 2012 | 98.0 | 83.1 |
Apr 2012 | 96.1 | 75.9 |
May 2012 | 94.1 | 70.0 |
Jun 2012 | 70.6 | 58.1 |
Jul 2012 | 74.5 | 57.0 |
Aug 2012 | 77.5 | 64.4 |
Sep 2012 | 86.3 | 67.5 |
Oct 2012 | 97.1 | 76.7 |
Nov 2012 | 93.1 | 75.4 |
Dec 2012 | 90.2 | 73.7 |
Jan 2013 | 88.2 | 70.2 |
Feb 2013 | 94.1 | 79.5 |
Mar 2013 | 99.0 | 75.9 |
Apr 2013 | 87.3 | 75.0 |
May 2013 | 82.4 | 68.7 |
Jun 2013 | 82.4 | 68.4 |
Jul 2013 | 81.4 | 70.6 |
Aug 2013 | 94.1 | 76.4 |
Sep 2013 | 92.2 | 77.8 |
Oct 2013 | 90.2 | 77.8 |
Nov 2013 | 94.1 | 74.7 |
Dec 2013 | 81.4 | 73.2 |
Jan 2014 | 88.2 | 68.7 |
Feb 2014 | 80.4 | 66.5 |
Mar 2014 | 86.3 | 73.6 |
Apr 2014 | 96.1 | 82.0 |
May 2014 | 98.0 | 83.4 |
Jun 2014 | 96.1 | 83.5 |
Jul 2014 | 96.1 | 74.2 |
Aug 2014 | 92.2 | 74.5 |
Sep 2014 | 90.2 | 77.2 |
Oct 2014 | 98.0 | 79.9 |
Nov 2014 | 96.1 | 79.8 |
Dec 2014 | 98.0 | 81.8 |
Jan 2015 | 93.1 | 80.0 |
Feb 2015 | 84.3 | 74.5 |
Mar 2015 | 64.7 | 62.5 |
Apr 2015 | 74.5 | 65.1 |
May 2015 | 84.3 | 77.1 |
Jun 2015 | 84.3 | 78.2 |
Jul 2015 | 92.2 | 84.1 |
Aug 2015 | 80.4 | 74.5 |
Sep 2015 | 86.3 | 74.1 |
Oct 2015 | 88.2 | 75.9 |
Nov 2015 | 88.2 | 74.6 |
Dec 2015 | 88.2 | 73.2 |
Jan 2016 | 75.5 | 71.1 |
Feb 2016 | 81.4 | 72.4 |
Mar 2016 | 78.4 | 69.5 |
Apr 2016 | 86.3 | 77.1 |
May 2016 | 72.5 | 67.3 |
Jun 2016 | 55.9 | 57.7 |
Jul 2016 | 84.3 | 71.3 |
Aug 2016 | 86.3 | 76.2 |
Sep 2016 | 94.1 | 85.1 |
Oct 2016 | 68.6 | 66.9 |
Nov 2016 | 82.4 | 73.6 |
Dec 2016 | 78.4 | 64.7 |
Jan 2017 | 84.3 | 70.0 |
Feb 2017 | 79.4 | 68.9 |
Mar 2017 | 98.0 | 76.5 |
Apr 2017 | 88.2 | 72.0 |
May 2017 | 78.4 | 68.4 |
Jun 2017 | 91.2 | 69.6 |
Jul 2017 | 80.4 | 71.6 |
Aug 2017 | 91.2 | 75.6 |
Sep 2017 | 76.5 | 60.8 |
Oct 2017 | 80.4 | 73.8 |
Nov 2017 | 84.3 | 70.7 |
Dec 2017 | 91.2 | 73.8 |
Jan 2018 | 90.2 | 74.2 |
Feb 2018 | 96.1 | 80.2 |
Mar 2018 | 96.1 | 80.9 |
Apr 2018 | 86.3 | 72.9 |
May 2018 | 82.4 | 73.6 |
Jun 2018 | 94.1 | 76.7 |
Jul 2018 | 91.2 | 81.3 |
Aug 2018 | 94.1 | 77.2 |
Sep 2018 | 82.4 | 68.4 |
Oct 2018 | 94.1 | 72.8 |
Nov 2018 | 92.2 | 72.3 |
Dec 2018 | 88.2 | 67.9 |
Jan 2019 | 89.2 | 79.4 |
Feb 2019 | 84.3 | 73.3 |
Mar 2019 | 82.4 | 74.9 |
Apr 2019 | 61.8 | 56.4 |
May 2019 | 64.7 | 58.5 |
Jun 2019 | 66.7 | 55.4 |
Jul 2019 | 74.5 | 60.8 |
Aug 2019 | 80.4 | 67.1 |
Sep 2019 | 79.4 | 66.4 |
Oct 2019 | 70.6 | 60.3 |
Nov 2019 | 68.6 | 63.7 |
Dec 2019 | 74.5 | 67.9 |
Jan 2020 | 87.3 | 75.9 |
Feb 2020 | 86.3 | 71.8 |
Mar 2020 | 5.9 | 29.0 |
Apr 2020 | 0.0 | 0.0 |
May 2020 | 0.0 | 0.3 |
Jun 2020[p] | 0.0 | 0.6 |
[p] preliminary | ||