
We have a guest blogger for this edition of Commissioner’s Corner. Jennifer Price is an economist in the Office of Productivity and Technology at the U.S. Bureau of Labor Statistics. She enjoys watching theatrical performances when she’s not working.
I recently had the pleasure of attending a high school play. The cast was composed of a male and female lead and at least a dozen supporting actors. The program listed the performers and acknowledged many other students, parents, teachers, and administrators. They all played some important role to bring the play to life—lighting, sound, painting props, sewing costumes, creating promotional materials, selling tickets, working concessions. All of these pieces came together harmoniously to make the performance a success.
Setting the Stage: New Measures of State Productivity
We can view the health of the nation’s economy through the same lens. Our diversified economy is made up of lead performers and supporting roles in the form of industries. Some industries contribute more heavily to growth in output or productivity, playing the star role. Other industries are supporting characters, contributing to a smaller, but necessary, share of growth. Our productivity program recently published a webpage that examines how industries contribute to the nation’s private business output and productivity growth.
We also can examine these roles geographically. Until recently, BLS productivity measures were only produced at the national level. Last June, BLS published experimental measures of state labor productivity for the private nonfarm business sector. These measures, which cover the period from 2007 to 2017, will help us learn more about productivity growth in each state and how each state contributes to national productivity trends.
Measuring productivity for all states allows us to credit the role played by each state, not just the total performance of the national economy or region. Just as each person, no matter how small their role, was necessary for the success of the school play, each state contributes to how we evaluate national or regional productivity. When we examine the contribution of each state to total productivity trends, we find that, like actors, no two states perform identically. Similar individual growth rates may have different impacts on the productivity of the nation or region. By analyzing state productivity trends over the long term, we learn more about regional business cycles, regional income inequality, and the role of local regulations and taxes on growth.
From 2007 to 2017, labor productivity changes ranged from a gain of 3.1 percent per year in North Dakota to a loss of 0.7 percent per year in Louisiana.
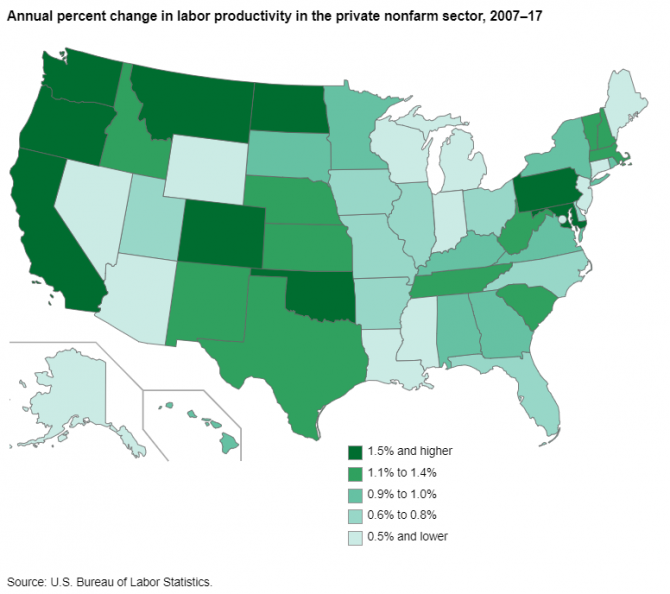
Editor’s note: Data for this map are available in the table below.
We estimate each state’s annual contribution to national or regional productivity growth by multiplying the state’s productivity growth rate by its average share of total current dollar national or regional output. The economic size of each state influences its contribution to national and regional estimates. From 2007 to 2017, California was our lead performer, with the largest contribution to national productivity growth. The state’s productivity grew 1.7 percent per year on average, and its large economy means it contributed more than one-fifth of the 1.0-percent growth in national labor productivity.
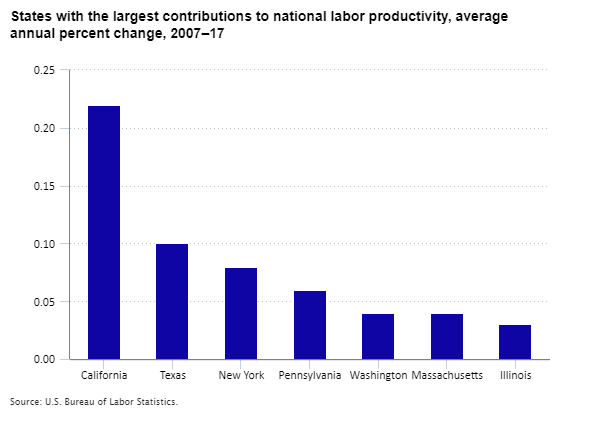
Editor’s note: Data for this chart are available in the table below.
Supporting actors included Texas and New York. Making a cameo appearance was North Dakota; despite having the largest productivity growth rate, it ranked 28th in terms of its contribution to national productivity growth. Stars in each region included Illinois (Midwest), New York (Northeast), Texas (South), and California (West). Understudies—those states with the largest growth rates—were North Dakota (Midwest), Pennsylvania (Northeast), and Oklahoma (South). Oregon and Washington shared this role out West.
Second Act
For now, our new measures cover the private nonfarm sector for all 50 states and the District of Columbia from 2007 to 2017. These measures include output per hour, output, hours, unit labor costs, hourly compensation, and real hourly compensation. Our measures of labor productivity for states are experimental, meaning we’re still assessing them and considering ways to improve them. In the second act, we will be looking into producing state-level measures for more detailed sectors and industries.
For an encore performance, check out our state labor productivity page. We’d love to hear your feedback! Email comments to productivity@bls.gov.
| State | Annual percent change |
|---|---|
North Dakota | 3.1 |
California | 1.7 |
Oregon | 1.7 |
Washington | 1.7 |
Colorado | 1.6 |
Oklahoma | 1.6 |
Maryland | 1.5 |
Montana | 1.5 |
Pennsylvania | 1.5 |
Massachusetts | 1.4 |
New Mexico | 1.4 |
Vermont | 1.4 |
Idaho | 1.3 |
Kansas | 1.3 |
Nebraska | 1.1 |
New Hampshire | 1.1 |
South Carolina | 1.1 |
Tennessee | 1.1 |
Texas | 1.1 |
West Virginia | 1.1 |
Alabama | 1.0 |
Hawaii | 1.0 |
Kentucky | 1.0 |
Minnesota | 1.0 |
New York | 1.0 |
Rhode Island | 1.0 |
South Dakota | 1.0 |
Virginia | 1.0 |
Georgia | 0.9 |
Arkansas | 0.8 |
Missouri | 0.8 |
Ohio | 0.8 |
Utah | 0.8 |
Illinois | 0.7 |
North Carolina | 0.7 |
Delaware | 0.6 |
Florida | 0.6 |
Iowa | 0.6 |
Indiana | 0.5 |
Mississippi | 0.5 |
New Jersey | 0.5 |
Wisconsin | 0.5 |
Alaska | 0.4 |
Arizona | 0.4 |
District of Columbia | 0.4 |
Michigan | 0.4 |
Maine | 0.3 |
Nevada | 0.3 |
Wyoming | 0.1 |
Connecticut | -0.5 |
Louisiana | -0.7 |
| State | State contribution to U.S. labor productivity |
|---|---|
California | 0.22 |
Texas | 0.10 |
New York | 0.08 |
Pennsylvania | 0.06 |
Washington | 0.04 |
Massachusetts | 0.04 |
Illinois | 0.03 |