
For readers around several Eastern and Midwest states, you likely know that “Brood X” is the name of the cohort of 17-year cicadas that have made their appearance known, and heard, starting in mid-May 2021. According to the U.S. Forest Service, scientists have been studying cicadas for a couple of centuries, and there are historical reports going back centuries. In fact, in The Iliad, Homer speaks of two elder sages who were “… too old to fight, but they were fluent orators, and sat on the tower like cicadas that chirrup delicately from the boughs of some high tree in a wood.”

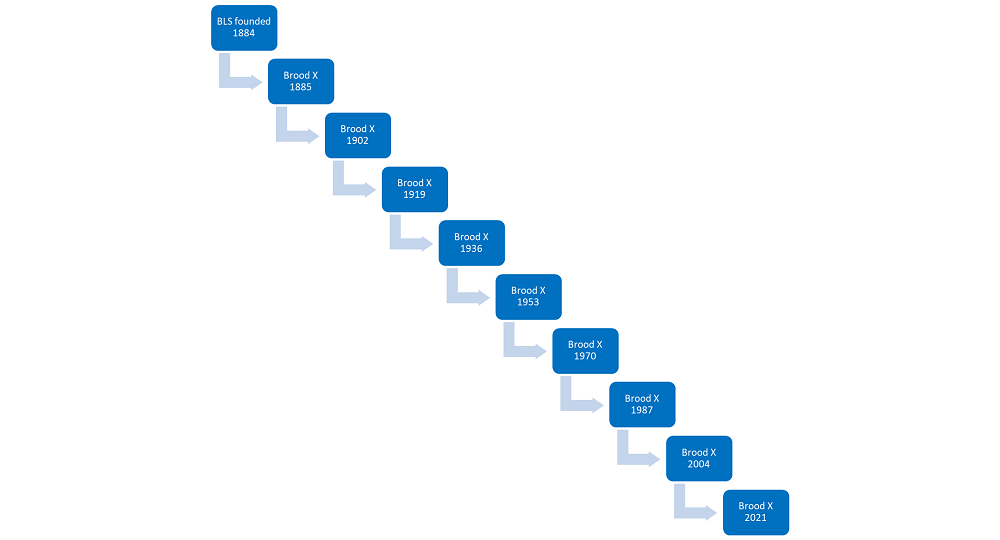
We can’t find any record of President Chester A. Arthur (who signed the law to create BLS) nor Carroll Wright (the first BLS Commissioner) speaking of cicadas, but is it a coincidence that Brood X appeared just one year after BLS was founded in 1884? Since BLS has lived through 9 appearances of Brood X, let’s take a look at what we reported during those years.
Brood X of 1919 was the first to encounter the BLS Consumer Price Index, which provides information back to 1913. Using the CPI Inflation Calculator, you can look at how buying power has changed over time. As the chart below shows, Brood X from 1919 could spend $6.31 and have buying power equal to their great, great, great, great grandchildren spending $100 today. The 1936 cicadas were affected by the Great Depression, with increasing buying power because of deflation. The 1987 cicadas were affected by high inflation rates that occurred after their 1970 ancestors disappeared.
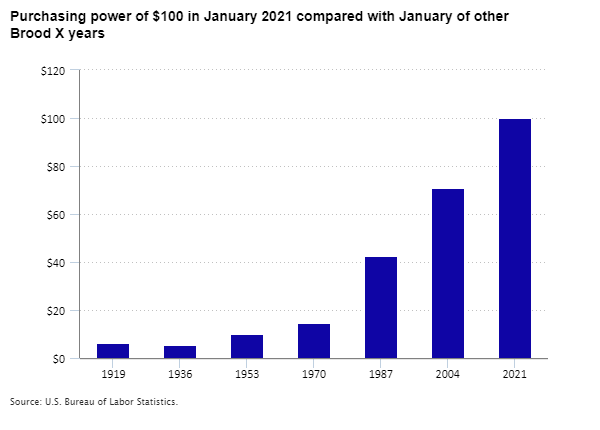
Editor’s note: Data for this chart are available in the table below.
While BLS has reported on the number of workers on employer payrolls since before the 1919 cicadas came out of the ground, consistent data for all states were not available until the late 1940s. That was in time for the 1953 cicadas, which witnessed about 43 million jobs on private nonfarm payrolls. The 1953 cicadas saw about 45 percent of private sector employment in good-producing industries — mining, construction, and manufacturing. Interestingly, cicadas from the groups that followed saw little change in the number of jobs on good-producing payrolls. The peak number in Brood X years was 23 million in 1987. Goods-producing employment in 2021 is just over 20 million. In contrast, payrolls of service-providing industries have soared over the same period, from nearly 24 million in 1953 to just over 100 million today. These service-providing industries include trade, transportation, financial activities, education and health services, restaurants and other hospitality businesses, and many more. The 2021 cicadas have seen that 83 percent of payroll employment is in service-providing industries.
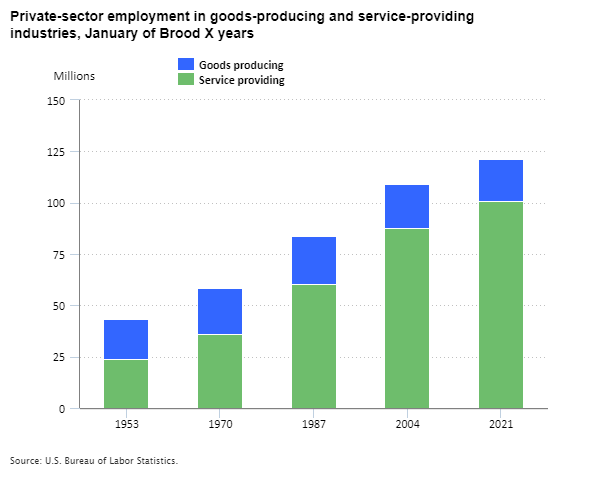
Editor’s note: Data for this chart are available in the table below.
BLS has been studying productivity since before Brood X of 1902 emerged. The first such study was of “Hand and Machine Labor” in 1898. Consistent measures of labor productivity in the nonfarm business sector date from 1947, in time for the 1953 cicadas. Over the more than 70-year history of these data, the percent change from the previous quarter, at an annual rate, has been negative about 20 percent of the time (based on the first quarter of each year). But perhaps the sound and fury of Brood X has some influence, as 2 out of 5 (40 percent) of the cicada-year changes have been negative. Yes, it’s a small sample, but let’s not discount the cicada effect.
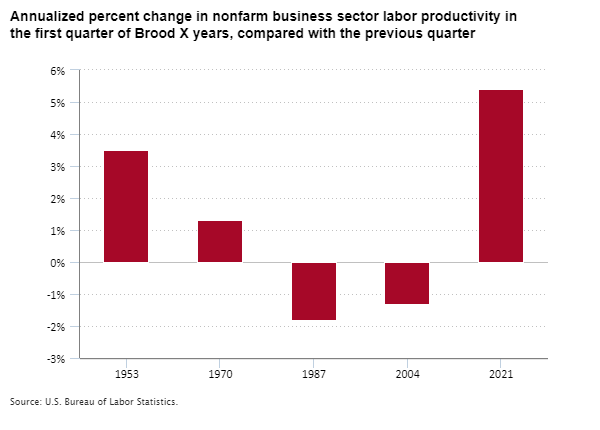
Editor’s note: Data for this chart are available in the table below.
Finally, our flying friends have studied BLS data on pay and know about all our measures of worker pay. The longest consistent series on pay began in 1964, in time for the 1970 cicadas to track average hourly earnings for production and nonsupervisory employees. The 1987 cicadas saw pay nearly triple from that of their parents, and future generations saw continued increases as well.
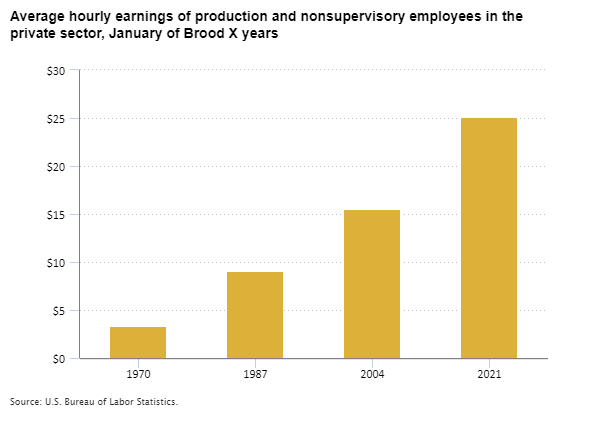
Editor’s note: Data for this chart are available in the table below.
BLS is looking forward to providing the latest in labor statistics in 2038, when the children of the 2021 cicadas check out the latest on www.bls.gov. In the meantime, maybe they’ll follow us on Twitter.
| Year | Purchasing power |
|---|---|
1919 | $6.31 |
1936 | 5.28 |
1953 | 10.17 |
1970 | 14.45 |
1987 | 42.51 |
2004 | 70.80 |
2021 | 100.00 |
| Year | Goods producing | Service providing |
|---|---|---|
1953 | 19,721,000 | 23,629,000 |
1970 | 22,726,000 | 35,954,000 |
1987 | 23,232,000 | 60,401,000 |
2004 | 21,715,000 | 87,516,000 |
2021 | 20,221,000 | 100,948,000 |
| Year | Annualized percent change |
|---|---|
1953 | 3.5% |
1970 | 1.3 |
1987 | -1.8 |
2004 | -1.3 |
2021 | 5.4 |
| Year | Average hourly earnings |
|---|---|
1970 | $3.31 |
1987 | 9.02 |
2004 | 15.51 |
2021 | 25.14 |