
May is Asian-Pacific American Heritage Month, so let’s take a closer look at national employment statistics for Asians and for Native Hawaiians and Other Pacific Islanders (NHPIs). We’ll focus on how the COVID-19 pandemic affected the labor market for these groups.
BLS has been collecting data in its household survey since 2003 on the labor market characteristics of people who identify their race as Asian or NHPI. Looking at historical data, we’ve noticed that the employment–population ratio—the percentage of the population that is employed—is generally higher for Asians and NHPIs than for the U.S. average. The ratio in 2019 was 62.3 percent for Asians and 66.2 percent for NHPIs, well above the national average of 60.8 percent. The greater likelihood of employment among Asians and NHPIs reflects the fact that both groups—particularly NHPIs—are more likely to be ages 25 to 54 than the overall population. People in this age range are more likely to be employed than those in younger and older age groups. Regardless of age, employment declined sharply for Asians and NHPIs in 2020, reflecting the impact of the pandemic.
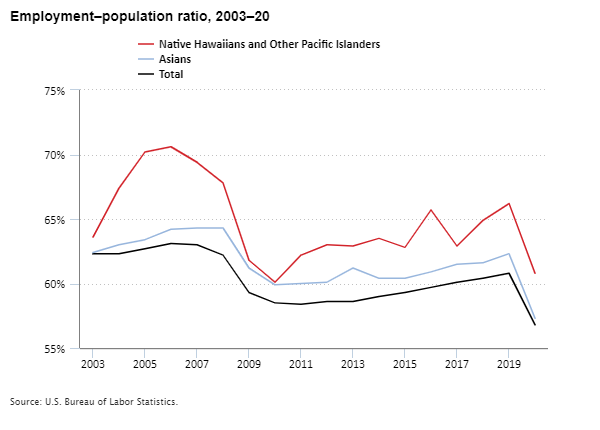
Editor’s note: Data for this chart are available in the table below.
To get a better sense of how Asians and NHPIs fared in the labor market during the pandemic, we compared employment–population ratios for the 12 months before the pandemic with estimates for the 12 months after it started. The following chart shows the decline in the average employment–population ratio for the 12 months ending in February 2021 compared with the 12 months ending in February 2020. The employment–population ratio for NHPIs fell 6.0 percentage points, and the ratio for Asians fell 5.4 percentage points. These compare with a decline of 4.7 percentage points for the overall population.
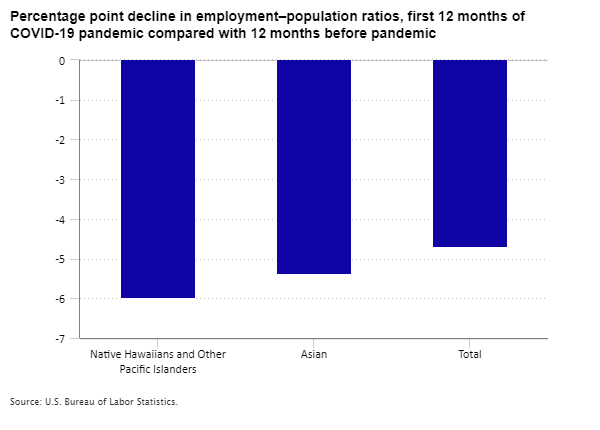
Editor’s note: Data for this chart are available in the table below.
We used the same approach to look at different groups within the Asian population. The employment–population ratio for Asian women declined by 5.7 percentage points from the 12 months before the pandemic to the 12 months following the onset of the pandemic. This was more than the 5.2 percentage point decline for Asian men. Asians age 55 and older had a greater drop in their employment–population ratio (−6.1 percentage points) than did Asians in younger age groups: −5.2 percentage points for Asians ages 25 to 54 and −4.7 percentage points for Asians ages 16 to 24. The decline in the percentage of foreign-born Asians who were employed—6.1 percentage points—was greater than that for native-born Asians (−4.2 percentage points). (Unfortunately, we can’t make these same comparisons for NHPIs because of their small sample size in the survey.)
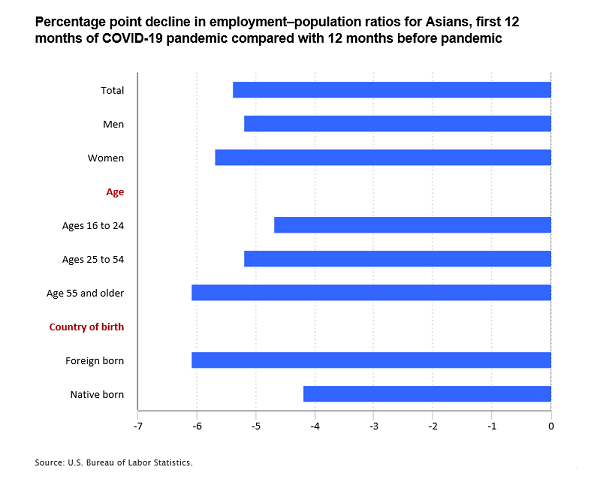
Editor’s note: Data for this chart are available in the table below.
Asians trace their roots to many different distinct and culturally diverse peoples. Our household survey collects information on seven different Asian groups—Asian Indian, Chinese, Filipino, Japanese, Korean, Vietnamese, and Other Asian. Of these groups, the percentage point decline in the employment–population ratio for the 12 months after the onset of the pandemic was largest for the Vietnamese (−8.8 percentage points). This likely reflects the large number of Vietnamese workers employed in the other services industry. This industry—particularly the nail salon component, in which Vietnamese workers are especially prevalent—lost much of its employment in the early months of the pandemic, when mandatory business closures, stay-at-home orders, and fear of the illness kept many people from engaging in both labor market and consumer activity. By contrast, employment–population ratios for Asian Indians and for Japanese dropped by 3.4 percentage points and 3.0 percentage points, respectively; these two Asian groups are more likely to be employed in industries that lost smaller proportions of employment, such as professional and business services. Notably, workers in this industry were more likely to telework due to the pandemic than workers employed in other services.
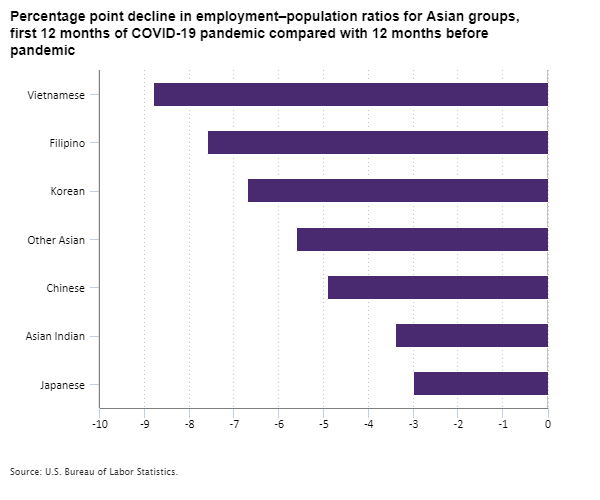
Editor’s note: Data for this chart are available in the table below.
If you want to learn more about how Asians and NHPIs are faring in the labor market, please check out our data on race and ethnicity.
| Year | Total | Asians | Native Hawaiians and Other Pacific Islanders |
|---|---|---|---|
2003 | 62.3% | 62.4% | 63.6% |
2004 | 62.3 | 63.0 | 67.4 |
2005 | 62.7 | 63.4 | 70.2 |
2006 | 63.1 | 64.2 | 70.6 |
2007 | 63.0 | 64.3 | 69.4 |
2008 | 62.2 | 64.3 | 67.8 |
2009 | 59.3 | 61.2 | 61.8 |
2010 | 58.5 | 59.9 | 60.1 |
2011 | 58.4 | 60.0 | 62.2 |
2012 | 58.6 | 60.1 | 63.0 |
2013 | 58.6 | 61.2 | 62.9 |
2014 | 59.0 | 60.4 | 63.5 |
2015 | 59.3 | 60.4 | 62.8 |
2016 | 59.7 | 60.9 | 65.7 |
2017 | 60.1 | 61.5 | 62.9 |
2018 | 60.4 | 61.6 | 64.9 |
2019 | 60.8 | 62.3 | 66.2 |
2020 | 56.8 | 57.3 | 60.8 |
| Group | Percentage point change |
|---|---|
Native Hawaiians and Other Pacific Islanders | -6.0 |
Asian | -5.4 |
Total | -4.7 |
| Group | Percentage point change |
|---|---|
Total | -5.4 |
Men | -5.2 |
Women | -5.7 |
Age | |
Ages 16 to 24 | -4.7 |
Ages 25 to 54 | -5.2 |
Age 55 and older | -6.1 |
Country of birth | |
Foreign born | -6.1 |
Native born | -4.2 |
| Group | Percentage point change |
|---|---|
Vietnamese | -8.8 |
Filipino | -7.6 |
Korean | -6.7 |
Other Asian | -5.6 |
Chinese | -4.9 |
Asian Indian | -3.4 |
Japanese | -3.0 |
Total | -5.4 |