The U.S. Congress passed Public Law 100-9 on March 12, 1987, designating March as Women’s History Month. Beginning in 1995, each President has issued annual proclamations designating March as Women’s History Month.
Public Law 100-9 states in part:
“Whereas American women have played and continue to play a critical economic, cultural, and social role in every sphere of our Nation’s life by constituting a significant portion of the labor force working in and outside of the home;”
We at BLS have a lot to say about the critical role women have played in the economic health of our nation, especially their role in the labor market.
Let’s begin with the theme of this year’s Women’s History Month, “Providing healing and promoting hope.” This theme is especially relevant today as women serve on the front lines of the world’s battle against the COVID-19 pandemic. But women have been providing healing and promoting hope since time immemorial. BLS doesn’t have data going back that far, but we have interesting data on women employed in the health care and social assistance industry that highlight the critical importance of women in maintaining the health of our nation.
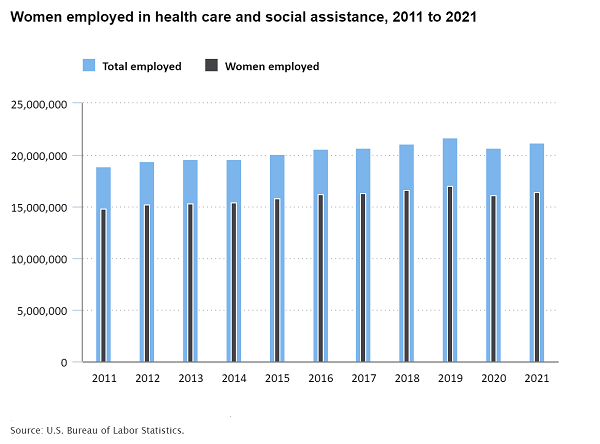
Women made up 77.6 percent of health care and social assistance employment
In 2021, 16.4 million women were employed in the health care and social assistance industry. This was 77.6 percent of the total 21.2 million workers in the industry. Looking at the component industries that make up health care and social assistance, women accounted for 75.0 percent of total employment in hospitals, 77.4 percent of total employment in health services, except hospitals, and 84.0 percent of total employment in social assistance. Social assistance includes child day care services, vocational rehabilitation services, and services for the elderly and disabled, among other industries.

Editor’s note: Data for this chart are available in the table below.
Women providing care to household members
The excerpt from Public Law 100-9 I shared earlier mentioned activity both inside and outside the home. Data from the American Time Use Survey can shed light on the many ways women provide healing and promote hope, even when it is not directly related to their paid employment.
From May to December 2020, 84.5 percent of women engaged in household activities on a given day. Women who engaged in household activities spent an average of 2.77 hours per day on them as their primary activity.
Almost 25 percent of women also cared for and helped household members on a given day. These women averaged 2.41 hours per day caring for a household member as their primary activity.
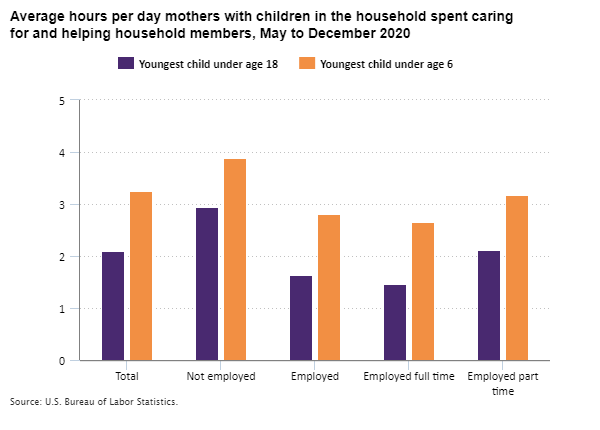
Among women who were mothers, the time they spent caring for and helping household members varied depending on the age of the children and the employment status of the parent. Women of all marital and employment statuses averaged 2.1 hours per day caring for household members if their youngest child was under age 18 and 3.25 hours a day if their youngest child was under age 6. The averages were higher if women were not employed: 2.95 hours per day for women with children under age 18 and 3.88 hours for women with children under age 6.

Editor’s note: Data for this chart are available in the table below.
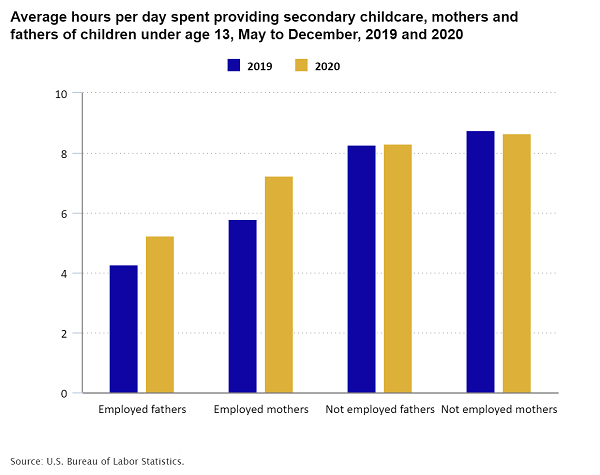
The COVID-19 pandemic may have had several effects. Mothers of children under age 13 who were employed spent 7.3 hours per day during the pandemic in 2020 providing secondary childcare. Secondary childcare is when parents had at least one child under age 13 in their care while doing activities other than primary childcare. This was up by 1.5 hours per day from 2019. Employed fathers spent about 1 hour more per day providing secondary childcare in 2020 than in 2019.
Mothers and fathers of children under 13 who were not employed spent more time providing secondary childcare than those who were employed. Mothers who were not employed spent 8.7 hours per day providing secondary childcare, and fathers who were not employed spent 8.3 hours in 2020. Both figures are essentially unchanged from 2019.

Editor’s note: Data for this chart are available in the table below.
This March, we are happy once again to celebrate the women who have made an impact both in the workforce and at home. Now more than ever, the world has come to count on women as healers and caregivers. On behalf of everyone at BLS, I am grateful for all the women who continue this crucial work. Not just this month, but every month.
| Year | Total employed | Women employed | Percent of total employed that are women |
|---|---|---|---|
2011 | 18,902,000 | 14,836,000 | 78.5% |
2012 | 19,405,000 | 15,209,000 | 78.4 |
2013 | 19,562,000 | 15,343,000 | 78.4 |
2014 | 19,577,000 | 15,379,000 | 78.6 |
2015 | 20,077,000 | 15,752,000 | 78.5 |
2016 | 20,589,000 | 16,212,000 | 78.7 |
2017 | 20,720,000 | 16,271,000 | 78.5 |
2018 | 21,133,000 | 16,558,000 | 78.4 |
2019 | 21,701,000 | 16,959,000 | 78.1 |
2020 | 20,736,000 | 16,141,000 | 77.8 |
2021 | 21,204,000 | 16,446,000 | 77.6 |
| Employment status | Youngest child under age 18 | Youngest child under age 6 |
|---|---|---|
Total | 2.10 | 3.25 |
Not employed | 2.95 | 3.88 |
Employed | 1.64 | 2.81 |
Employed full time | 1.47 | 2.65 |
Employed part time | 2.12 | 3.18 |
| Year | Employed fathers | Employed mothers | Not employed fathers | Not employed mothers |
|---|---|---|---|---|
2019 | 4.29 | 5.78 | 8.29 | 8.76 |
2020 | 5.24 | 7.25 | 8.32 | 8.66 |
 United States Department of Labor