
I recently had the pleasure of speaking at the National Association for Business Economics Policy Conference, regarding labor market recovery. Today I’m sharing some highlights from that talk, updated to include the latest BLS data.
There continues to be widespread interest in how well U.S. labor markets are recovering from the massive job losses at the start of the COVID-19 pandemic. Not only does this interest involve counting the number of jobs, but it also includes shifts in labor skills and changes in compensation levels. Some parts of the labor market may emerge from a recession very differently from how they entered. This difference could be in skills required, compensation, changes in the workplace, or a worker’s use of capital. Thus, we always should consider the possibility that recovery in a labor market will differ from what we had before the economic shock. In other words, we should be ready to be surprised.
What does “labor market recovery” mean? According to the National Bureau of Economic Research, the pandemic-related recession lasted just 2 months in the first half of 2020. But we know resumption of work varied considerably over the past 2 years, with some industries maintaining or even expanding employment in the early months of the pandemic, while others continue a slower return to pre-pandemic work levels.
Let’s now step through some ways to understand labor market recovery. Many observers would define recovery as a return to the employment levels before the recession, or, in our case, before the economic collapse and slower economic activity as the pandemic continued. We measure this definition of recovery by the number of jobs below and above the February 2020 levels. Based on our most recent data releases, total nonfarm employment, as measured by the BLS Current Employment Statistics survey, has recovered 93 percent of the jobs lost in March and April 2020. This chart shows the change in employment since February 2020 for major industry groups. It’s easy to see industries with large gains and industries that have not yet recovered their previous employment level.
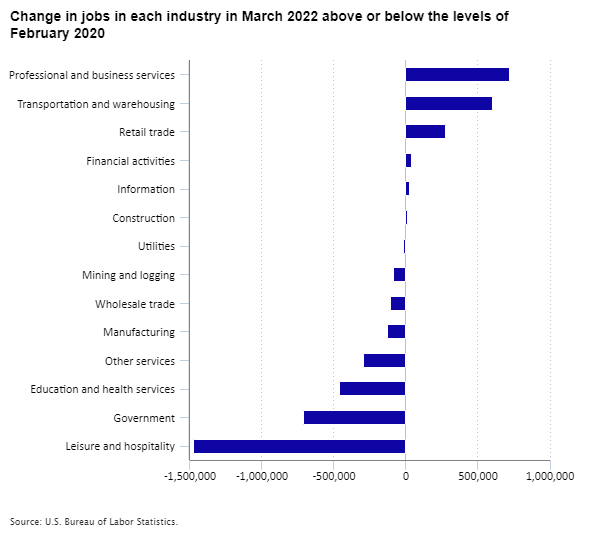
Editor’s note: Data for this chart are available in the table below.
However, this straightforward definition of recovery does not account for the growth in the civilian population (16 years and older) over the past 2 years, which constitutes the base of employment and potential employment. The U.S. population age 16 and older grew by around 3.8 million between February 2020 and March 2022. Thus, we could define recovery as total jobs from February 2020 plus additional employment to account for population growth.
Of course, that does not account for one of the principal labor market characteristics of the past 2 years: The number of workers who left the labor force and never returned. Looking at data from the Current Population Survey, we learn that many of those people who are not in the labor force indicate that they want a job but are not looking. That number rose by nearly 5 million at the beginning of the pandemic but has declined significantly since then. In fact, it was still 741,000 higher in March 2022 than in February of 2020. And we still have nearly a million people who say they are not looking for work now because of the pandemic.
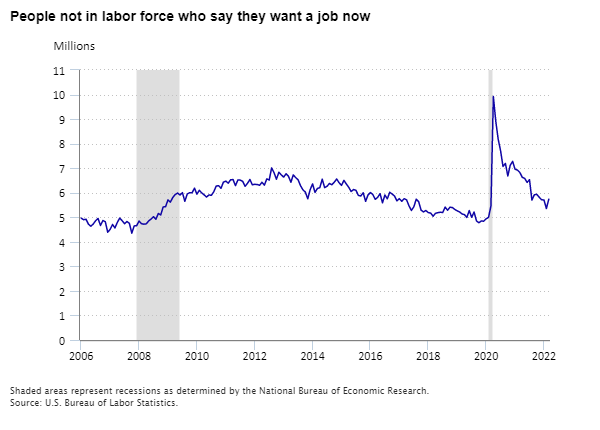
Editor’s note: Data for this chart are available in the table below.
In addition to these straightforward concepts of recovery, our colleagues at the Bureau of Economic Analysis report on our nation’s output of goods and services, called Gross Domestic Product (GDP). Nominal GDP was $4.5 trillion higher in the fourth quarter of 2021 than in the depths of the recession in the second quarter of 2020; after adjusting for inflation, real GDP was $2.5 trillion higher. Both nominal and real GDP were also higher in the fourth quarter of 2021 than in the quarters before the pandemic and recession. The recovery in output implies that the current labor force is enough to support more GDP than we had in the pre-pandemic economy.
Likewise, the BLS index of total private sector labor hours is 99.9 percent recovered from its February 2020 level.
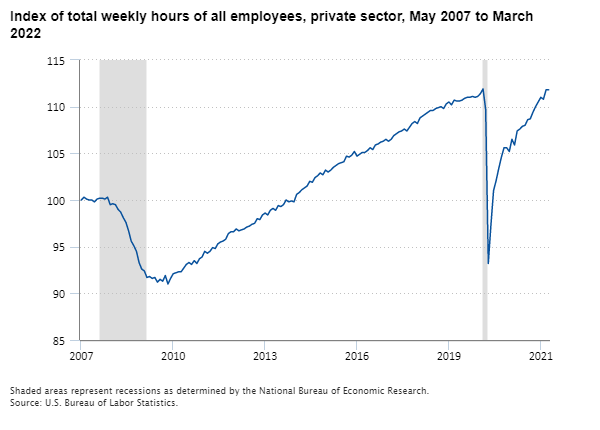
Editor’s note: Data for this chart are available in the table below.
Still another way to think about labor market recovery is to measure the return of demand for labor. Labor demand is tricky because it is driven by so many factors in the product and service markets. That said, some recent evidence is instructive. In February 2022, the Job Openings and Labor Turnover Survey reported 11.3 million job openings, which is near a historical high. Hires stood at 6.7 million, and separations at 6.1 million. That’s a hires rate of 4.4 percent, little changed from the prior 12 months. In short, demand is high and rising, but hires remain relatively flat and at a normal level.
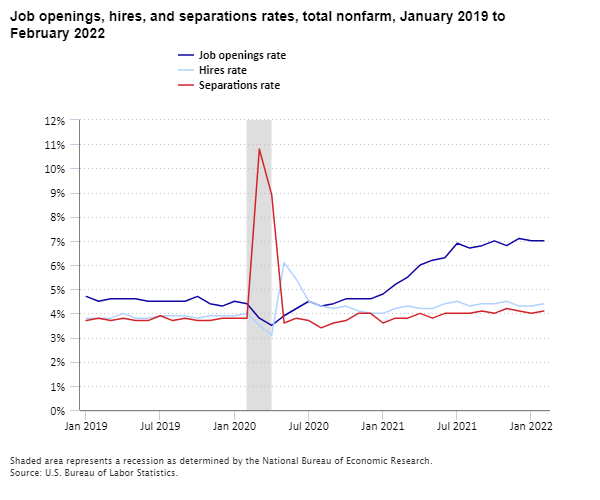
Editor’s note: Data for this chart are available in the table below.
Finally, there’s the issue of labor force participation, the percentage of people age 16 and older who either are working or have looked for work in the past 4 weeks. The latest rate is 62.4 percent in March 2022, up from a low of 60.2 percent in April 2020. However, the rate stood at 63.4 percent in January and February of 2020.
For people ages 25 to 54, the March 2022 labor force participation rate for men was 88.7 percent, compared with 89.3 percent in January 2020. For women, the March 2022 rate was 76.5 percent, down from 76.9 percent in January 2020. Both rates, but particularly the rate for women, were buffeted by the waves of infections and the closing of schools and daycare facilities.
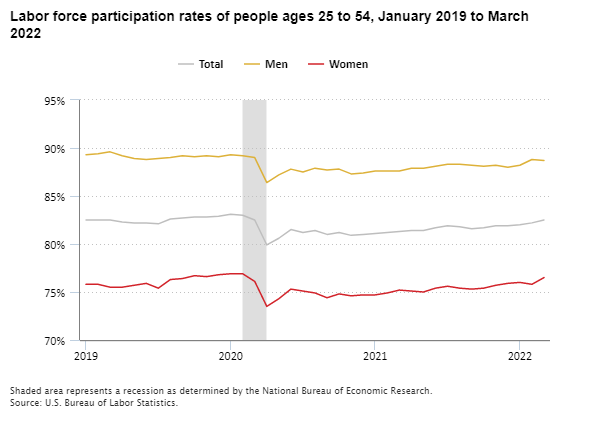
Editor’s note: Data for this chart are available in the table below.
Let me conclude with a few observations. First, we see total work hours returning to their pre-pandemic level and GDP increasing. Labor force participation continues to lag its pre-pandemic rate. The recovery in output suggests the lagging labor force participation may result from demographic and other social factors, and not just economic conditions.
| Industry | Employment change |
|---|---|
Professional and business services | 723,000 |
Transportation and warehousing | 607,500 |
Retail trade | 278,300 |
Financial activities | 41,000 |
Information | 26,000 |
Construction | 4,000 |
Utilities | -10,000 |
Mining and logging | -86,000 |
Wholesale trade | -103,900 |
Manufacturing | -128,000 |
Other services | -291,000 |
Education and health services | -456,000 |
Government | -710,000 |
Leisure and hospitality | -1,474,000 |
| Month | Want a job now |
|---|---|
Jan 2006 | 4,964,000 |
Feb 2006 | 4,901,000 |
Mar 2006 | 4,918,000 |
Apr 2006 | 4,719,000 |
May 2006 | 4,635,000 |
Jun 2006 | 4,726,000 |
Jul 2006 | 4,862,000 |
Aug 2006 | 4,951,000 |
Sep 2006 | 4,666,000 |
Oct 2006 | 4,868,000 |
Nov 2006 | 4,818,000 |
Dec 2006 | 4,390,000 |
Jan 2007 | 4,506,000 |
Feb 2007 | 4,706,000 |
Mar 2007 | 4,565,000 |
Apr 2007 | 4,794,000 |
May 2007 | 4,968,000 |
Jun 2007 | 4,857,000 |
Jul 2007 | 4,737,000 |
Aug 2007 | 4,827,000 |
Sep 2007 | 4,750,000 |
Oct 2007 | 4,352,000 |
Nov 2007 | 4,648,000 |
Dec 2007 | 4,657,000 |
Jan 2008 | 4,846,000 |
Feb 2008 | 4,739,000 |
Mar 2008 | 4,718,000 |
Apr 2008 | 4,733,000 |
May 2008 | 4,851,000 |
Jun 2008 | 4,929,000 |
Jul 2008 | 5,023,000 |
Aug 2008 | 4,922,000 |
Sep 2008 | 5,153,000 |
Oct 2008 | 5,094,000 |
Nov 2008 | 5,421,000 |
Dec 2008 | 5,431,000 |
Jan 2009 | 5,708,000 |
Feb 2009 | 5,617,000 |
Mar 2009 | 5,807,000 |
Apr 2009 | 5,927,000 |
May 2009 | 5,986,000 |
Jun 2009 | 5,908,000 |
Jul 2009 | 6,003,000 |
Aug 2009 | 5,649,000 |
Sep 2009 | 5,949,000 |
Oct 2009 | 6,002,000 |
Nov 2009 | 5,998,000 |
Dec 2009 | 6,186,000 |
Jan 2010 | 5,942,000 |
Feb 2010 | 6,098,000 |
Mar 2010 | 5,993,000 |
Apr 2010 | 5,913,000 |
May 2010 | 5,824,000 |
Jun 2010 | 5,909,000 |
Jul 2010 | 5,895,000 |
Aug 2010 | 6,037,000 |
Sep 2010 | 6,270,000 |
Oct 2010 | 6,289,000 |
Nov 2010 | 6,182,000 |
Dec 2010 | 6,431,000 |
Jan 2011 | 6,472,000 |
Feb 2011 | 6,390,000 |
Mar 2011 | 6,527,000 |
Apr 2011 | 6,537,000 |
May 2011 | 6,289,000 |
Jun 2011 | 6,519,000 |
Jul 2011 | 6,513,000 |
Aug 2011 | 6,463,000 |
Sep 2011 | 6,262,000 |
Oct 2011 | 6,384,000 |
Nov 2011 | 6,538,000 |
Dec 2011 | 6,323,000 |
Jan 2012 | 6,343,000 |
Feb 2012 | 6,335,000 |
Mar 2012 | 6,302,000 |
Apr 2012 | 6,426,000 |
May 2012 | 6,309,000 |
Jun 2012 | 6,564,000 |
Jul 2012 | 6,516,000 |
Aug 2012 | 7,011,000 |
Sep 2012 | 6,817,000 |
Oct 2012 | 6,551,000 |
Nov 2012 | 6,833,000 |
Dec 2012 | 6,728,000 |
Jan 2013 | 6,637,000 |
Feb 2013 | 6,772,000 |
Mar 2013 | 6,670,000 |
Apr 2013 | 6,428,000 |
May 2013 | 6,726,000 |
Jun 2013 | 6,614,000 |
Jul 2013 | 6,526,000 |
Aug 2013 | 6,284,000 |
Sep 2013 | 6,119,000 |
Oct 2013 | 6,024,000 |
Nov 2013 | 5,754,000 |
Dec 2013 | 6,126,000 |
Jan 2014 | 6,360,000 |
Feb 2014 | 6,011,000 |
Mar 2014 | 6,174,000 |
Apr 2014 | 6,207,000 |
May 2014 | 6,553,000 |
Jun 2014 | 6,207,000 |
Jul 2014 | 6,264,000 |
Aug 2014 | 6,376,000 |
Sep 2014 | 6,326,000 |
Oct 2014 | 6,431,000 |
Nov 2014 | 6,558,000 |
Dec 2014 | 6,406,000 |
Jan 2015 | 6,300,000 |
Feb 2015 | 6,503,000 |
Mar 2015 | 6,355,000 |
Apr 2015 | 6,221,000 |
May 2015 | 6,051,000 |
Jun 2015 | 6,130,000 |
Jul 2015 | 6,097,000 |
Aug 2015 | 5,890,000 |
Sep 2015 | 5,868,000 |
Oct 2015 | 5,997,000 |
Nov 2015 | 5,649,000 |
Dec 2015 | 5,909,000 |
Jan 2016 | 6,006,000 |
Feb 2016 | 5,927,000 |
Mar 2016 | 5,730,000 |
Apr 2016 | 5,812,000 |
May 2016 | 5,962,000 |
Jun 2016 | 5,590,000 |
Jul 2016 | 5,906,000 |
Aug 2016 | 5,752,000 |
Sep 2016 | 6,017,000 |
Oct 2016 | 5,948,000 |
Nov 2016 | 5,864,000 |
Dec 2016 | 5,668,000 |
Jan 2017 | 5,758,000 |
Feb 2017 | 5,653,000 |
Mar 2017 | 5,758,000 |
Apr 2017 | 5,708,000 |
May 2017 | 5,465,000 |
Jun 2017 | 5,277,000 |
Jul 2017 | 5,425,000 |
Aug 2017 | 5,734,000 |
Sep 2017 | 5,637,000 |
Oct 2017 | 5,293,000 |
Nov 2017 | 5,219,000 |
Dec 2017 | 5,275,000 |
Jan 2018 | 5,191,000 |
Feb 2018 | 5,169,000 |
Mar 2018 | 5,044,000 |
Apr 2018 | 5,163,000 |
May 2018 | 5,188,000 |
Jun 2018 | 5,204,000 |
Jul 2018 | 5,195,000 |
Aug 2018 | 5,413,000 |
Sep 2018 | 5,288,000 |
Oct 2018 | 5,408,000 |
Nov 2018 | 5,398,000 |
Dec 2018 | 5,320,000 |
Jan 2019 | 5,262,000 |
Feb 2019 | 5,216,000 |
Mar 2019 | 5,136,000 |
Apr 2019 | 5,107,000 |
May 2019 | 4,994,000 |
Jun 2019 | 5,272,000 |
Jul 2019 | 4,999,000 |
Aug 2019 | 5,212,000 |
Sep 2019 | 4,852,000 |
Oct 2019 | 4,778,000 |
Nov 2019 | 4,849,000 |
Dec 2019 | 4,839,000 |
Jan 2020 | 4,937,000 |
Feb 2020 | 4,996,000 |
Mar 2020 | 5,462,000 |
Apr 2020 | 9,921,000 |
May 2020 | 8,916,000 |
Jun 2020 | 8,182,000 |
Jul 2020 | 7,712,000 |
Aug 2020 | 7,070,000 |
Sep 2020 | 7,194,000 |
Oct 2020 | 6,685,000 |
Nov 2020 | 7,120,000 |
Dec 2020 | 7,277,000 |
Jan 2021 | 6,956,000 |
Feb 2021 | 6,923,000 |
Mar 2021 | 6,822,000 |
Apr 2021 | 6,628,000 |
May 2021 | 6,583,000 |
Jun 2021 | 6,422,000 |
Jul 2021 | 6,529,000 |
Aug 2021 | 5,701,000 |
Sep 2021 | 5,918,000 |
Oct 2021 | 5,935,000 |
Nov 2021 | 5,819,000 |
Dec 2021 | 5,713,000 |
Jan 2022 | 5,704,000 |
Feb 2022 | 5,355,000 |
Mar 2022 | 5,737,000 |
| Month | Index |
|---|---|
May 2007 | 100.0 |
Jun 2007 | 100.3 |
Jul 2007 | 100.1 |
Aug 2007 | 100.0 |
Sep 2007 | 100.0 |
Oct 2007 | 99.8 |
Nov 2007 | 100.1 |
Dec 2007 | 100.2 |
Jan 2008 | 100.2 |
Feb 2008 | 100.1 |
Mar 2008 | 100.3 |
Apr 2008 | 99.5 |
May 2008 | 99.6 |
Jun 2008 | 99.5 |
Jul 2008 | 99.0 |
Aug 2008 | 98.7 |
Sep 2008 | 98.1 |
Oct 2008 | 97.6 |
Nov 2008 | 96.7 |
Dec 2008 | 95.6 |
Jan 2009 | 95.1 |
Feb 2009 | 94.5 |
Mar 2009 | 93.3 |
Apr 2009 | 92.6 |
May 2009 | 92.4 |
Jun 2009 | 91.7 |
Jul 2009 | 91.8 |
Aug 2009 | 91.6 |
Sep 2009 | 91.7 |
Oct 2009 | 91.2 |
Nov 2009 | 91.5 |
Dec 2009 | 91.3 |
Jan 2010 | 91.9 |
Feb 2010 | 91.0 |
Mar 2010 | 91.6 |
Apr 2010 | 92.1 |
May 2010 | 92.2 |
Jun 2010 | 92.3 |
Jul 2010 | 92.3 |
Aug 2010 | 92.7 |
Sep 2010 | 93.1 |
Oct 2010 | 93.3 |
Nov 2010 | 93.1 |
Dec 2010 | 93.5 |
Jan 2011 | 93.2 |
Feb 2011 | 93.7 |
Mar 2011 | 93.9 |
Apr 2011 | 94.5 |
May 2011 | 94.3 |
Jun 2011 | 94.5 |
Jul 2011 | 94.9 |
Aug 2011 | 94.8 |
Sep 2011 | 95.3 |
Oct 2011 | 95.5 |
Nov 2011 | 95.6 |
Dec 2011 | 95.8 |
Jan 2012 | 96.4 |
Feb 2012 | 96.6 |
Mar 2012 | 96.6 |
Apr 2012 | 96.9 |
May 2012 | 96.7 |
Jun 2012 | 96.8 |
Jul 2012 | 96.9 |
Aug 2012 | 97.1 |
Sep 2012 | 97.2 |
Oct 2012 | 97.4 |
Nov 2012 | 97.5 |
Dec 2012 | 98.0 |
Jan 2013 | 97.9 |
Feb 2013 | 98.4 |
Mar 2013 | 98.6 |
Apr 2013 | 98.4 |
May 2013 | 98.9 |
Jun 2013 | 99.1 |
Jul 2013 | 98.9 |
Aug 2013 | 99.4 |
Sep 2013 | 99.3 |
Oct 2013 | 99.5 |
Nov 2013 | 100.0 |
Dec 2013 | 99.8 |
Jan 2014 | 99.9 |
Feb 2014 | 99.8 |
Mar 2014 | 100.6 |
Apr 2014 | 100.8 |
May 2014 | 101.1 |
Jun 2014 | 101.3 |
Jul 2014 | 101.5 |
Aug 2014 | 102.0 |
Sep 2014 | 101.9 |
Oct 2014 | 102.4 |
Nov 2014 | 102.6 |
Dec 2014 | 102.9 |
Jan 2015 | 102.7 |
Feb 2015 | 103.2 |
Mar 2015 | 103.0 |
Apr 2015 | 103.2 |
May 2015 | 103.5 |
Jun 2015 | 103.7 |
Jul 2015 | 103.9 |
Aug 2015 | 104.0 |
Sep 2015 | 104.1 |
Oct 2015 | 104.7 |
Nov 2015 | 104.6 |
Dec 2015 | 104.8 |
Jan 2016 | 105.2 |
Feb 2016 | 104.7 |
Mar 2016 | 104.9 |
Apr 2016 | 105.1 |
May 2016 | 105.1 |
Jun 2016 | 105.3 |
Jul 2016 | 105.6 |
Aug 2016 | 105.4 |
Sep 2016 | 105.9 |
Oct 2016 | 106.0 |
Nov 2016 | 106.2 |
Dec 2016 | 106.3 |
Jan 2017 | 106.5 |
Feb 2017 | 106.3 |
Mar 2017 | 106.5 |
Apr 2017 | 106.9 |
May 2017 | 107.1 |
Jun 2017 | 107.3 |
Jul 2017 | 107.4 |
Aug 2017 | 107.6 |
Sep 2017 | 107.4 |
Oct 2017 | 107.8 |
Nov 2017 | 108.2 |
Dec 2017 | 108.4 |
Jan 2018 | 108.2 |
Feb 2018 | 108.8 |
Mar 2018 | 109.0 |
Apr 2018 | 109.2 |
May 2018 | 109.4 |
Jun 2018 | 109.6 |
Jul 2018 | 109.6 |
Aug 2018 | 109.8 |
Sep 2018 | 109.9 |
Oct 2018 | 110.0 |
Nov 2018 | 109.8 |
Dec 2018 | 110.3 |
Jan 2019 | 110.5 |
Feb 2019 | 110.2 |
Mar 2019 | 110.7 |
Apr 2019 | 110.6 |
May 2019 | 110.6 |
Jun 2019 | 110.7 |
Jul 2019 | 110.9 |
Aug 2019 | 111.0 |
Sep 2019 | 111.0 |
Oct 2019 | 111.1 |
Nov 2019 | 111.0 |
Dec 2019 | 111.1 |
Jan 2020 | 111.4 |
Feb 2020 | 111.9 |
Mar 2020 | 109.7 |
Apr 2020 | 93.2 |
May 2020 | 97.3 |
Jun 2020 | 101.0 |
Jul 2020 | 102.1 |
Aug 2020 | 103.4 |
Sep 2020 | 104.6 |
Oct 2020 | 105.6 |
Nov 2020 | 105.6 |
Dec 2020 | 105.2 |
Jan 2021 | 106.5 |
Feb 2021 | 105.9 |
Mar 2021 | 107.4 |
Apr 2021 | 107.6 |
May 2021 | 107.9 |
Jun 2021 | 108.0 |
Jul 2021 | 108.6 |
Aug 2021 | 108.7 |
Sep 2021 | 109.4 |
Oct 2021 | 110.0 |
Nov 2021 | 110.5 |
Dec 2021 | 111.0 |
Jan 2022 | 110.8 |
Feb 2022 | 111.8 |
Mar 2022 | 111.8 |
| Month | Job openings rate | Hires rate | Separations rate |
|---|---|---|---|
Jan 2019 | 4.7% | 3.8% | 3.7% |
Feb 2019 | 4.5 | 3.8 | 3.8 |
Mar 2019 | 4.6 | 3.8 | 3.7 |
Apr 2019 | 4.6 | 4.0 | 3.8 |
May 2019 | 4.6 | 3.8 | 3.7 |
Jun 2019 | 4.5 | 3.8 | 3.7 |
Jul 2019 | 4.5 | 3.9 | 3.9 |
Aug 2019 | 4.5 | 3.9 | 3.7 |
Sep 2019 | 4.5 | 3.9 | 3.8 |
Oct 2019 | 4.7 | 3.8 | 3.7 |
Nov 2019 | 4.4 | 3.9 | 3.7 |
Dec 2019 | 4.3 | 3.9 | 3.8 |
Jan 2020 | 4.5 | 3.9 | 3.8 |
Feb 2020 | 4.4 | 4.0 | 3.8 |
Mar 2020 | 3.8 | 3.5 | 10.8 |
Apr 2020 | 3.5 | 3.1 | 8.9 |
May 2020 | 3.9 | 6.1 | 3.6 |
Jun 2020 | 4.2 | 5.4 | 3.8 |
Jul 2020 | 4.5 | 4.5 | 3.7 |
Aug 2020 | 4.3 | 4.3 | 3.4 |
Sep 2020 | 4.4 | 4.2 | 3.6 |
Oct 2020 | 4.6 | 4.3 | 3.7 |
Nov 2020 | 4.6 | 4.1 | 4.0 |
Dec 2020 | 4.6 | 4.0 | 4.0 |
Jan 2021 | 4.8 | 4.0 | 3.6 |
Feb 2021 | 5.2 | 4.2 | 3.8 |
Mar 2021 | 5.5 | 4.3 | 3.8 |
Apr 2021 | 6.0 | 4.2 | 4.0 |
May 2021 | 6.2 | 4.2 | 3.8 |
Jun 2021 | 6.3 | 4.4 | 4.0 |
Jul 2021 | 6.9 | 4.5 | 4.0 |
Aug 2021 | 6.7 | 4.3 | 4.0 |
Sep 2021 | 6.8 | 4.4 | 4.1 |
Oct 2021 | 7.0 | 4.4 | 4.0 |
Nov 2021 | 6.8 | 4.5 | 4.2 |
Dec 2021 | 7.1 | 4.3 | 4.1 |
Jan 2022 | 7.0 | 4.3 | 4.0 |
Feb 2022 | 7.0 | 4.4 | 4.1 |
| Month | Total | Men | Women |
|---|---|---|---|
Jan 2019 | 82.5% | 89.3% | 75.8% |
Feb 2019 | 82.5 | 89.4 | 75.8 |
Mar 2019 | 82.5 | 89.6 | 75.5 |
Apr 2019 | 82.3 | 89.2 | 75.5 |
May 2019 | 82.2 | 88.9 | 75.7 |
Jun 2019 | 82.2 | 88.8 | 75.9 |
Jul 2019 | 82.1 | 88.9 | 75.4 |
Aug 2019 | 82.6 | 89.0 | 76.3 |
Sep 2019 | 82.7 | 89.2 | 76.4 |
Oct 2019 | 82.8 | 89.1 | 76.7 |
Nov 2019 | 82.8 | 89.2 | 76.6 |
Dec 2019 | 82.9 | 89.1 | 76.8 |
Jan 2020 | 83.1 | 89.3 | 76.9 |
Feb 2020 | 83.0 | 89.2 | 76.9 |
Mar 2020 | 82.5 | 89.0 | 76.1 |
Apr 2020 | 79.9 | 86.4 | 73.5 |
May 2020 | 80.6 | 87.2 | 74.3 |
Jun 2020 | 81.5 | 87.8 | 75.3 |
Jul 2020 | 81.2 | 87.5 | 75.1 |
Aug 2020 | 81.4 | 87.9 | 74.9 |
Sep 2020 | 81.0 | 87.7 | 74.4 |
Oct 2020 | 81.2 | 87.8 | 74.8 |
Nov 2020 | 80.9 | 87.3 | 74.6 |
Dec 2020 | 81.0 | 87.4 | 74.7 |
Jan 2021 | 81.1 | 87.6 | 74.7 |
Feb 2021 | 81.2 | 87.6 | 74.9 |
Mar 2021 | 81.3 | 87.6 | 75.2 |
Apr 2021 | 81.4 | 87.9 | 75.1 |
May 2021 | 81.4 | 87.9 | 75.0 |
Jun 2021 | 81.7 | 88.1 | 75.4 |
Jul 2021 | 81.9 | 88.3 | 75.6 |
Aug 2021 | 81.8 | 88.3 | 75.4 |
Sep 2021 | 81.6 | 88.2 | 75.3 |
Oct 2021 | 81.7 | 88.1 | 75.4 |
Nov 2021 | 81.9 | 88.2 | 75.7 |
Dec 2021 | 81.9 | 88.0 | 75.9 |
Jan 2022 | 82.0 | 88.2 | 76.0 |
Feb 2022 | 82.2 | 88.8 | 75.8 |
Mar 2022 | 82.5 | 88.7 | 76.5 |