
At BLS, we are always looking for new ways to help readers understand the latest economic data. As measures of price change have garnered a heaping amount of financial coverage lately, the pastry chefs who publish our monthly inflation figures are experimenting with some new recipes to highlight current results. Our first attempt, straight out of the fryer: an inflation doughnut, in honor of National Doughnut Day.
We don’t mean to sugarcoat the impact of inflation on economic markets and household budgets, as high inflation can have disruptive and acrid consequences. Instead, we aim here to showcase the statistics in a window display that highlights the data in a fresh perspective. We start with an inflation doughnut, which is divided into sections to compare how many prices are increasing (inflation), decreasing (deflation), or remaining unchanged. You can display an inflation doughnut for just one month (think of it as just a doughnut hole) or over a longer time like a year or more (like a baker’s dozen). For this price change doughnut, we show all the ingredients to overall price change—the increases, the decreases, and the components with no change. Let’s look at an inflation doughnut example from the Consumer Price Index.
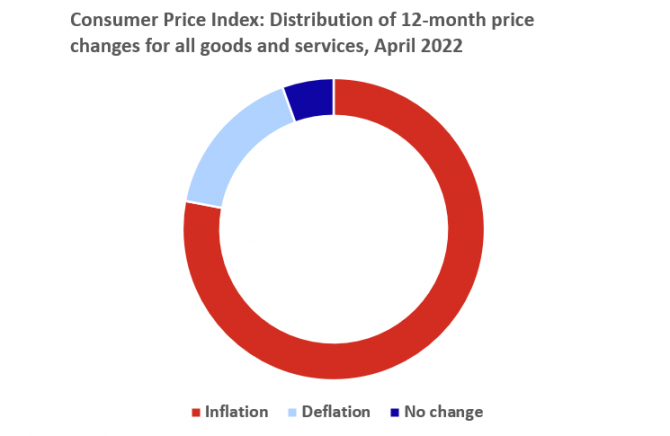
Editor’s note: Data for this chart are available in the table below.
But not everyone likes doughnuts, including my editors, who seem partial to crullers and other more linear pastries. Apparently, these circular graphics can be hard to understand. So, the charts below focus on the same data, but with a different look. Nonetheless, the doughnut references are too good to pass up.
As a reminder, BLS has three monthly price programs, each of which produces many different estimates. By tracking each of these programs, you can learn more about price transmission through the production process. (Hmm, that sounds like a topic for a future blog.) Here’s a brief reminder about the BLS price programs:
- The Import/Export Price Indexes contain data on changes in prices of nonmilitary goods and services traded between the United States and the rest of the world. As the new kid on the block, import and export price indexes are like those new gourmet doughnuts, perhaps topped with bacon and maple syrup.
- The Producer Price Index (PPI) measures the average change over time in the selling prices received by domestic producers for their output. As the oldest price index program, the PPI is the workhorse, your basic powdered doughnut. It’s been around for years but still hits the spot.
- The Consumer Price Index (CPI) measures the average change over time in the prices paid by urban consumers for a market basket of consumer goods and services. The CPI is the doughnut on the top shelf that gets most of the attention, maybe with chocolate frosting and multi-colored sprinkles.
Now that your mouth is watering, let’s look at the data.
Starting with import and export price data, we can see that nearly half of import item prices were higher over the past year, with 48 percent of all imports prices exhibiting inflationary trends; for imports of consumer goods, 42 percent had higher prices. We see similar trends among exports.
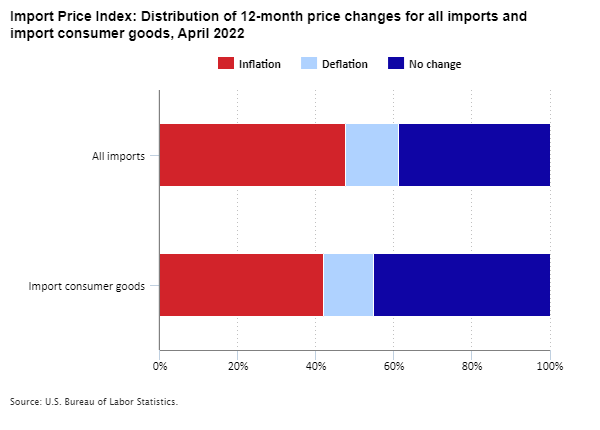
Editor’s note: Data for this chart are available in the table below.
With the PPI, we focus on the share of industries showing price changes. Data are available for three different sectors. In keeping with the doughnut theme, goods-producing industries represent the jelly filling, with 98 percent of these industries exhibiting inflation over the past year. In the center, or the cake, 86 percent of service-providing industries were inflationary. Finally, the strawberry glaze on the outside looks at construction industries, with all showing inflation.
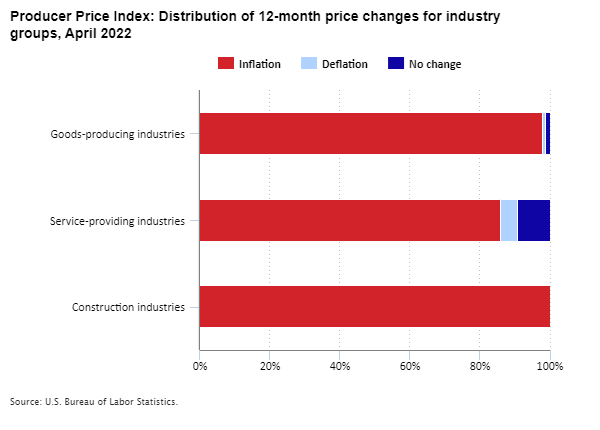
Editor’s note: Data for this chart are available in the table below.
Finally, we look again at data for the CPI, but this time our doughnuts are flattened. Here we show the share of items in the market basket that experience rising or falling prices or no change. As a doughnut, the “core” CPI, that is, all items less food and energy, is somewhat vanilla, like Boston Cream filling. Over the past 12 months, about three-quarters of core items have shown price increases, 19 percent have shown price decreases, and a small percentage show no change. In contrast, the prices for food and energy pack more zest, like a chocolate glaze, showing considerable inflation—nearly 89 percent of items—with only a small amount of deflation. The food and energy inflation may be influenced by rising energy prices, perhaps related to an increase in late-night drives to the local bakery.
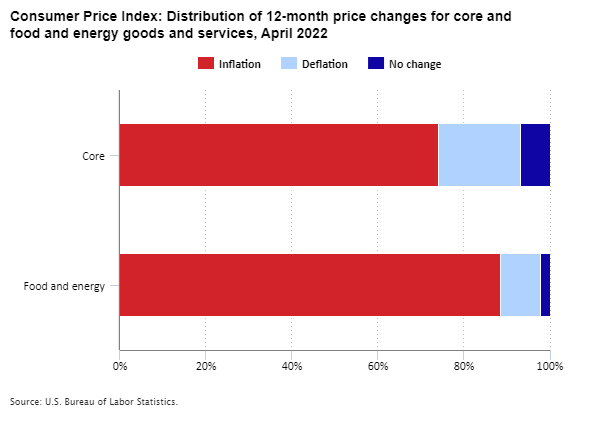
Editor’s note: Data for this chart are available in the table below.
We hope our tour of the pastry shop has added some spice to your understanding of price change statistics. For more traditional graphics showing trends in BLS data, check out the Graphics for Economic News Releases page on our website. Next time, try the pumpkin spice.
| Index | Inflation | Deflation | No change |
|---|---|---|---|
CPI for All Urban Consumers | 78.0 | 16.5 | 5.5 |
| Category | Inflation | Deflation | No change |
|---|---|---|---|
All imports | 47.7 | 13.7 | 38.6 |
Import consumer goods | 42.0 | 12.8 | 45.3 |
| Industry group | Inflation | Deflation | No change |
|---|---|---|---|
Goods-producing industries | 98 | 1 | 1 |
Service-providing industries | 86 | 5 | 9 |
Construction industries | 100 | 0 | 0 |
| Category | Inflation | Deflation | No change |
|---|---|---|---|
Core | 74.2 | 19.0 | 6.8 |
Food and energy | 88.6 | 9.4 | 2.0 |