
The U.S. labor market experienced a period of unprecedented volatility during the COVID-19 pandemic. Our monthly survey of nonfarm establishments recorded a decrease in employment of 13.6 percent (20.5 million jobs) between March and April 2020, the largest 1-month drop since the survey began in 1939. The survey then showed an employment gain of 3.4 percent (4.5 million jobs) from May to June 2020, the largest 1-month increase since the survey began. Our monthly survey of U.S. households, the Current Population Survey (CPS), recorded similarly extreme changes in the number of employed Americans for these months.
These statistics are the net result of firms adding and eliminating jobs and workers gaining and losing employment between months. Changes in the employment of individuals are not readily apparent from the headline numbers. Are more people exiting employment, or are fewer entering? To what extent are changes driving firms to hire more workers? To what extent are workers separating from their employers? Let’s look at estimates from two different BLS sources to answer these questions: the Job Opening and Labor Turnover Survey (JOLTS) and research data from the CPS on flows between labor force statuses.
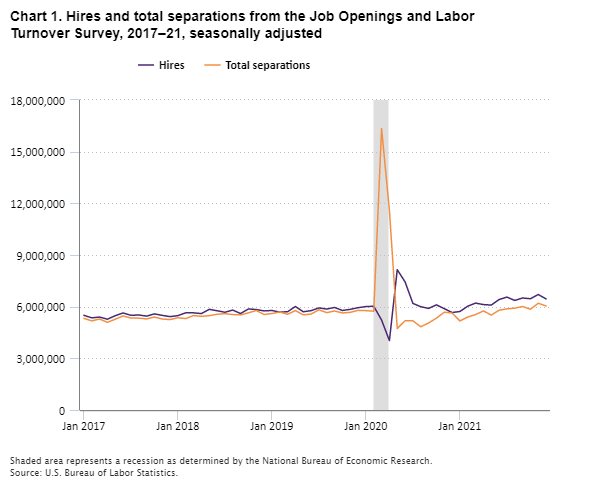
JOLTS samples about 21,000 business establishments to provide monthly data on job openings, hires, and separations. Hires are all additions to payroll during the month, and separations are all employees who separated from payroll for any reason during the month.
Chart 1 shows JOLTS hires and separations for 2017 to 2021. The initial pandemic-related shock is apparent mostly as an increase in separations, from 5.7 million in February 2020 to 16.3 million in March 2020, a historical high. Hires also decreased, from 6.0 million in February 2020 to 5.2 million in March and 4.0 million in April. But the decrease in hires was a small fraction of the increase in separations. Thus, JOLTS separation data captured the extreme impact of the pandemic in the March 2020 data, like the large movements in our monthly employment surveys.
Editor’s note: Data for this chart are available in the table below.
The mid-2020 rebound in employment reversed this pattern. By May 2020, hires increased to a historical high of 8.1 million, while separations sharply declined to 4.7 million, a 7-year low. Although hires declined from that initial rebound, they were mostly at or above pre-pandemic levels by February 2021 and continued increasing through the rest of the year. Separations also increased, but more slowly, exceeding pre-pandemic levels by mid- to late 2021.
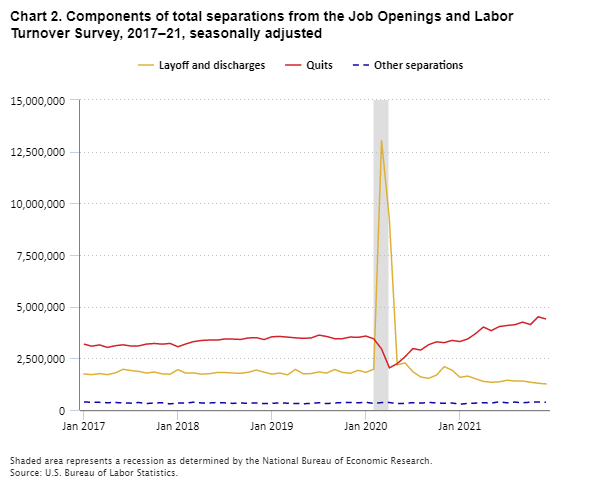
Chart 2 breaks separations into quits, layoffs and discharges, and other separations (retirements, transfers to other locations, deaths, or separations due to employee disability). Both the initial jump in separations and the sharp decline in mid-2020 were mostly because of the changes in the number of layoffs and discharges. However, the increase in separations later in 2020 and into 2021 resulted from increasing quits. Layoffs and discharges continued to decline and reached a low of 1.26 million at the end of 2021. From May 2020 to December 2021 quits trended up, reaching a high of 4.5 million by November 2021.
Editor’s note: Data for this chart are available in the table below.
We might expect higher levels of layoffs and discharges to be associated with larger flows out of employment, as workers who left their jobs involuntarily likely would experience at least brief spells of unemployment or leave the labor force, while workers who quit would be more likely to take jobs at other firms. The decline in layoffs and discharges hints that the number of workers exiting employment was decreasing throughout 2021. However, while JOLTS provides insight into the hiring and separation behavior in firms, it does not directly answer questions regarding the employment status of workers. JOLTS cannot distinguish among newly discharged employees who found another job immediately, searched for jobs, or exited the labor force entirely. Similarly, JOLTS cannot distinguish between newly hired workers who had previously been unemployed and those who had been working at other firms.
To answer these questions, we turn to CPS research data on labor force flows. These data measure the month-to-month movements of people among employment, unemployment, and not in the labor force. For example, we can use these data to see the number of people employed in one month who were unemployed the previous month. Higher levels of hires would be associated with higher flows into employment, as firms hire individuals without a current job as well as workers from other firms.
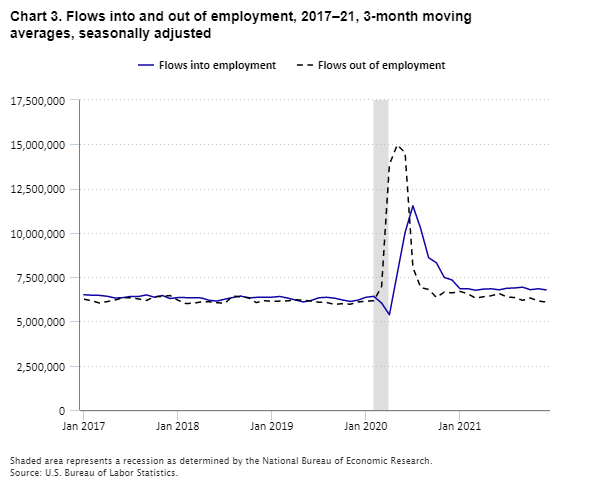
Chart 3 shows 3-month moving averages of flows into and out of employment from 2017 through 2021. The extreme changes in spring 2020 are readily apparent, with the 3-month average of flows out of employment peaking at 15.0 million in March–May 2020. (The highest single month was 26.9 million in April 2020; we show 3-month averages to better show variation in flows at other dates.) Flows into employment dipped from a pre-pandemic level of about 6.0 million to 5.4 million in February–April 2020 before increasing rapidly in the next few months to peak at 11.5 million in May–July 2020. Both peaks are well above all values since the data began in 1990. Associating hires with flows into employment and layoffs and discharges with flows out of employment, the basic pattern is similar between CPS and JOLTS.
Editor’s note: Data for this chart are available in the table below.
Both flows into and out of employment declined sharply after their peaks. By October–December 2021, flows into employment were still appreciably above pre-pandemic levels at 6.8 million, a similar pattern as JOLTS hires. Flows out of employment were comparable to those 2 years earlier at about 6.1 million. In contrast, JOLTS layoffs and discharges fell below pre-pandemic levels. However, quits increased substantially during 2021, and some of the increase in quits was likely reflected in increased exits from employment even if some quits simply reflected changing jobs. Changes in exits from employment from the reduction in layoffs and discharges and the increase in quits may roughly offset each other.
Overall, both JOLTS and the CPS flows data tell a consistent story. After the unprecedented volatility of the early months of the pandemic, the labor market recovery mostly shows increased hires rather than decreased separations.
| Month | Hires | Total separations |
|---|---|---|
Jan 2017 | 5,499,000 | 5,320,000 |
Feb 2017 | 5,350,000 | 5,176,000 |
Mar 2017 | 5,395,000 | 5,280,000 |
Apr 2017 | 5,272,000 | 5,091,000 |
May 2017 | 5,477,000 | 5,270,000 |
Jun 2017 | 5,635,000 | 5,463,000 |
Jul 2017 | 5,497,000 | 5,338,000 |
Aug 2017 | 5,519,000 | 5,334,000 |
Sep 2017 | 5,450,000 | 5,289,000 |
Oct 2017 | 5,581,000 | 5,397,000 |
Nov 2017 | 5,494,000 | 5,283,000 |
Dec 2017 | 5,421,000 | 5,249,000 |
Jan 2018 | 5,480,000 | 5,358,000 |
Feb 2018 | 5,644,000 | 5,307,000 |
Mar 2018 | 5,641,000 | 5,484,000 |
Apr 2018 | 5,599,000 | 5,439,000 |
May 2018 | 5,845,000 | 5,477,000 |
Jun 2018 | 5,763,000 | 5,559,000 |
Jul 2018 | 5,676,000 | 5,595,000 |
Aug 2018 | 5,803,000 | 5,540,000 |
Sep 2018 | 5,601,000 | 5,522,000 |
Oct 2018 | 5,867,000 | 5,641,000 |
Nov 2018 | 5,833,000 | 5,777,000 |
Dec 2018 | 5,754,000 | 5,546,000 |
Jan 2019 | 5,778,000 | 5,600,000 |
Feb 2019 | 5,684,000 | 5,694,000 |
Mar 2019 | 5,706,000 | 5,558,000 |
Apr 2019 | 6,010,000 | 5,773,000 |
May 2019 | 5,704,000 | 5,523,000 |
Jun 2019 | 5,769,000 | 5,570,000 |
Jul 2019 | 5,928,000 | 5,818,000 |
Aug 2019 | 5,862,000 | 5,653,000 |
Sep 2019 | 5,954,000 | 5,750,000 |
Oct 2019 | 5,779,000 | 5,634,000 |
Nov 2019 | 5,845,000 | 5,670,000 |
Dec 2019 | 5,941,000 | 5,786,000 |
Jan 2020 | 6,005,000 | 5,769,000 |
Feb 2020 | 6,025,000 | 5,738,000 |
Mar 2020 | 5,222,000 | 16,336,000 |
Apr 2020 | 4,031,000 | 11,590,000 |
May 2020 | 8,145,000 | 4,732,000 |
Jun 2020 | 7,438,000 | 5,182,000 |
Jul 2020 | 6,188,000 | 5,179,000 |
Aug 2020 | 5,998,000 | 4,833,000 |
Sep 2020 | 5,898,000 | 5,052,000 |
Oct 2020 | 6,105,000 | 5,331,000 |
Nov 2020 | 5,885,000 | 5,677,000 |
Dec 2020 | 5,660,000 | 5,634,000 |
Jan 2021 | 5,719,000 | 5,172,000 |
Feb 2021 | 6,028,000 | 5,400,000 |
Mar 2021 | 6,208,000 | 5,540,000 |
Apr 2021 | 6,121,000 | 5,753,000 |
May 2021 | 6,092,000 | 5,513,000 |
Jun 2021 | 6,414,000 | 5,793,000 |
Jul 2021 | 6,556,000 | 5,874,000 |
Aug 2021 | 6,362,000 | 5,913,000 |
Sep 2021 | 6,504,000 | 6,008,000 |
Oct 2021 | 6,460,000 | 5,852,000 |
Nov 2021 | 6,705,000 | 6,197,000 |
Dec 2021 | 6,450,000 | 6,042,000 |
| Month | Layoff and discharges | Quits | Other separations |
|---|---|---|---|
Jan 2017 | 1,745,000 | 3,188,000 | 387,000 |
Feb 2017 | 1,711,000 | 3,089,000 | 376,000 |
Mar 2017 | 1,762,000 | 3,150,000 | 369,000 |
Apr 2017 | 1,710,000 | 3,028,000 | 353,000 |
May 2017 | 1,794,000 | 3,111,000 | 364,000 |
Jun 2017 | 1,970,000 | 3,154,000 | 339,000 |
Jul 2017 | 1,910,000 | 3,097,000 | 332,000 |
Aug 2017 | 1,868,000 | 3,103,000 | 362,000 |
Sep 2017 | 1,787,000 | 3,190,000 | 312,000 |
Oct 2017 | 1,837,000 | 3,219,000 | 341,000 |
Nov 2017 | 1,747,000 | 3,186,000 | 349,000 |
Dec 2017 | 1,732,000 | 3,222,000 | 295,000 |
Jan 2018 | 1,953,000 | 3,060,000 | 344,000 |
Feb 2018 | 1,784,000 | 3,195,000 | 329,000 |
Mar 2018 | 1,797,000 | 3,309,000 | 379,000 |
Apr 2018 | 1,734,000 | 3,364,000 | 341,000 |
May 2018 | 1,754,000 | 3,384,000 | 339,000 |
Jun 2018 | 1,815,000 | 3,381,000 | 363,000 |
Jul 2018 | 1,813,000 | 3,437,000 | 345,000 |
Aug 2018 | 1,790,000 | 3,431,000 | 319,000 |
Sep 2018 | 1,772,000 | 3,414,000 | 337,000 |
Oct 2018 | 1,828,000 | 3,487,000 | 326,000 |
Nov 2018 | 1,933,000 | 3,502,000 | 341,000 |
Dec 2018 | 1,831,000 | 3,407,000 | 308,000 |
Jan 2019 | 1,735,000 | 3,545,000 | 320,000 |
Feb 2019 | 1,789,000 | 3,558,000 | 347,000 |
Mar 2019 | 1,702,000 | 3,527,000 | 329,000 |
Apr 2019 | 1,967,000 | 3,491,000 | 316,000 |
May 2019 | 1,753,000 | 3,468,000 | 301,000 |
Jun 2019 | 1,762,000 | 3,486,000 | 322,000 |
Jul 2019 | 1,844,000 | 3,624,000 | 350,000 |
Aug 2019 | 1,786,000 | 3,557,000 | 309,000 |
Sep 2019 | 1,961,000 | 3,452,000 | 338,000 |
Oct 2019 | 1,819,000 | 3,453,000 | 362,000 |
Nov 2019 | 1,777,000 | 3,530,000 | 363,000 |
Dec 2019 | 1,919,000 | 3,516,000 | 350,000 |
Jan 2020 | 1,821,000 | 3,578,000 | 370,000 |
Feb 2020 | 1,973,000 | 3,445,000 | 320,000 |
Mar 2020 | 13,026,000 | 2,951,000 | 359,000 |
Apr 2020 | 9,191,000 | 2,038,000 | 361,000 |
May 2020 | 2,180,000 | 2,244,000 | 308,000 |
Jun 2020 | 2,279,000 | 2,580,000 | 323,000 |
Jul 2020 | 1,850,000 | 2,973,000 | 357,000 |
Aug 2020 | 1,598,000 | 2,901,000 | 333,000 |
Sep 2020 | 1,531,000 | 3,158,000 | 363,000 |
Oct 2020 | 1,687,000 | 3,297,000 | 347,000 |
Nov 2020 | 2,097,000 | 3,258,000 | 321,000 |
Dec 2020 | 1,928,000 | 3,368,000 | 338,000 |
Jan 2021 | 1,582,000 | 3,311,000 | 278,000 |
Feb 2021 | 1,641,000 | 3,439,000 | 319,000 |
Mar 2021 | 1,512,000 | 3,695,000 | 333,000 |
Apr 2021 | 1,384,000 | 4,015,000 | 354,000 |
May 2021 | 1,343,000 | 3,838,000 | 333,000 |
Jun 2021 | 1,361,000 | 4,035,000 | 397,000 |
Jul 2021 | 1,440,000 | 4,088,000 | 346,000 |
Aug 2021 | 1,404,000 | 4,126,000 | 383,000 |
Sep 2021 | 1,405,000 | 4,253,000 | 349,000 |
Oct 2021 | 1,342,000 | 4,132,000 | 379,000 |
Nov 2021 | 1,295,000 | 4,510,000 | 393,000 |
Dec 2021 | 1,262,000 | 4,403,000 | 377,000 |
| Month | Flows into employment | Flows out of employment |
|---|---|---|
Jan 2017 | 6,506,000 | 6,255,667 |
Feb 2017 | 6,480,333 | 6,168,000 |
Mar 2017 | 6,470,000 | 6,038,333 |
Apr 2017 | 6,419,000 | 6,122,333 |
May 2017 | 6,319,667 | 6,209,667 |
Jun 2017 | 6,345,667 | 6,335,333 |
Jul 2017 | 6,413,667 | 6,330,000 |
Aug 2017 | 6,409,667 | 6,267,333 |
Sep 2017 | 6,498,333 | 6,185,333 |
Oct 2017 | 6,365,000 | 6,396,000 |
Nov 2017 | 6,464,667 | 6,417,000 |
Dec 2017 | 6,292,667 | 6,460,333 |
Jan 2018 | 6,347,333 | 6,198,667 |
Feb 2018 | 6,343,333 | 6,008,333 |
Mar 2018 | 6,337,000 | 6,031,333 |
Apr 2018 | 6,327,667 | 6,101,333 |
May 2018 | 6,190,333 | 6,106,667 |
Jun 2018 | 6,150,333 | 6,058,333 |
Jul 2018 | 6,257,000 | 6,026,000 |
Aug 2018 | 6,349,333 | 6,436,333 |
Sep 2018 | 6,434,000 | 6,387,333 |
Oct 2018 | 6,325,333 | 6,344,000 |
Nov 2018 | 6,358,000 | 6,063,333 |
Dec 2018 | 6,368,667 | 6,169,667 |
Jan 2019 | 6,368,333 | 6,134,333 |
Feb 2019 | 6,409,000 | 6,148,000 |
Mar 2019 | 6,318,667 | 6,161,000 |
Apr 2019 | 6,211,333 | 6,224,667 |
May 2019 | 6,100,667 | 6,199,667 |
Jun 2019 | 6,181,000 | 6,149,667 |
Jul 2019 | 6,336,667 | 6,083,333 |
Aug 2019 | 6,361,333 | 6,067,667 |
Sep 2019 | 6,313,333 | 5,960,333 |
Oct 2019 | 6,212,333 | 6,003,333 |
Nov 2019 | 6,128,000 | 5,970,333 |
Dec 2019 | 6,203,667 | 6,097,667 |
Jan 2020 | 6,362,667 | 6,143,667 |
Feb 2020 | 6,416,667 | 6,167,667 |
Mar 2020 | 6,040,333 | 6,964,000 |
Apr 2020 | 5,377,000 | 13,861,667 |
May 2020 | 7,700,667 | 14,964,333 |
Jun 2020 | 10,020,333 | 14,522,000 |
Jul 2020 | 11,525,333 | 8,047,333 |
Aug 2020 | 10,232,333 | 6,909,333 |
Sep 2020 | 8,599,667 | 6,807,667 |
Oct 2020 | 8,309,333 | 6,357,000 |
Nov 2020 | 7,483,000 | 6,653,667 |
Dec 2020 | 7,337,667 | 6,612,000 |
Jan 2021 | 6,850,667 | 6,694,000 |
Feb 2021 | 6,848,333 | 6,567,000 |
Mar 2021 | 6,761,000 | 6,313,000 |
Apr 2021 | 6,823,667 | 6,394,000 |
May 2021 | 6,841,667 | 6,450,000 |
Jun 2021 | 6,785,667 | 6,579,000 |
Jul 2021 | 6,871,000 | 6,380,000 |
Aug 2021 | 6,890,333 | 6,347,000 |
Sep 2021 | 6,933,667 | 6,190,667 |
Oct 2021 | 6,790,667 | 6,324,000 |
Nov 2021 | 6,843,667 | 6,150,000 |
Dec 2021 | 6,782,333 | 6,096,667 |