
An official website of the United States government
An official website of the United States government
The .gov means it's official.
Federal government websites often end in .gov or .mil. Before sharing sensitive information,
make sure you're on a federal government site.
The site is secure.
The
https:// ensures that you are connecting to the official website and that any
information you provide is encrypted and transmitted securely.
Data Finder is a new search and navigation tool for BLS time series data, found under the Beta menu on www.bls.gov. Data Finder allows users to search across multiple data sets and extract specific data by searching using key words and/or filtering through multiple categories such as topics and measures.
BLS time series can be described as a measure of one or more topics. Topics are akin to physical objects that have attributes or characteristics like location, industry, occupation, and demographic. Measures are numeric scale like counts, hours, rate, and earnings. For this reason, Data Finder was designed with Topics and Measures as the top level filters.
This new data query tool is comprised of three separate but integrated components—Data Finder, Data Viewer, and Data API:
This tool is being designed to eventually replace some of the existing BLS data query tools. Data Finder is being deployed iteratively with new features and data being added with each release. The following BLS time series data are available:
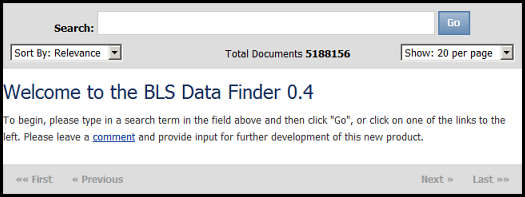
The Data Finder provides features for a user to perform searches on BLS time series by allowing a user to enter one or more terms in the search box at the top of the page. The search functionality enables users to narrow the scope of their search by using hierarchical categories/filters .
Employing a direct search paradigm and a navigational filtering approach, known as a “faceted search”, has become the prevailing user interaction mechanism in e-commerce sites. For BLS time series, facets correspond to the time series metadata used to describe the series using pre-determined classifications or common filters—such as topics, measures, and the various attributes exposed by Data Finder. This approach is useful for searching both structured and semi-structured data such as BLS time series.
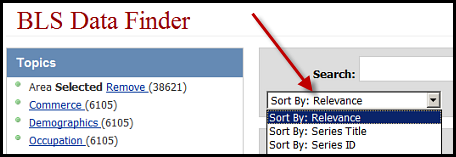
Data series search results are displayed in the Data Finder after a user types in search text and/or filters through the facets (topics, measures, and attributes) to narrow down the search. Users have the option to sort the search results by relevance, series title, series identification code (Series ID), and any selected topics. Relevance sort ranking is determined by factors such as multiple terms match and term frequency. Search results can display 20, 50 or 100 series per result page.
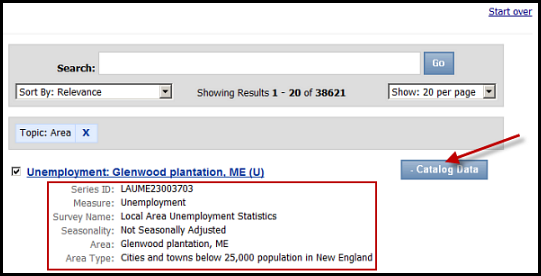
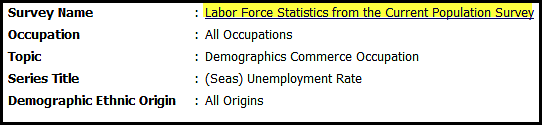
To reveal a more complete series description (catalog), users can click on the “Catalog Data” button to view the details for a specific time series. See the example below:
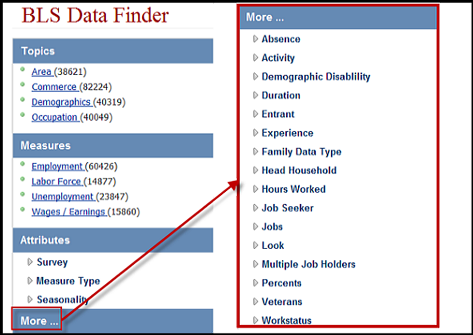
The ‘More...’ facet feature, as pictured below, displays attributes that allow for additional filtering by clicking on the hyper-linked text—More....
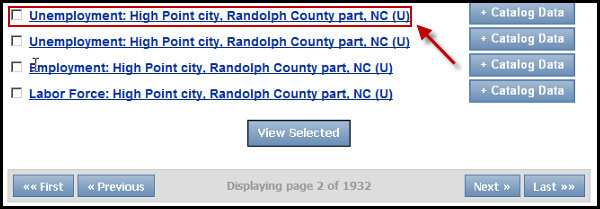
A user can view data for a single series by clicking on the series title link as shown in the example below for “Unemployment: High Point city, Randolph County part, NC (U)”.
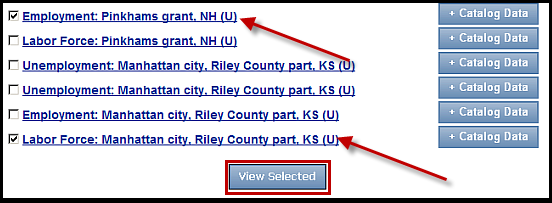
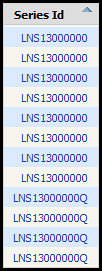
A user can view data of multiple series by clicking on the checkbox to the left of each series title, and scrolling to the bottom of the page and clicking on the “View Selected” button. In the example below, multiple series are selected from the same survey.
The Data Viewer displays the result of user selections from Data Finder. The selected time series data and related information are displayed through the Data Viewer in a table. The default time period in Data Viewer is set to three years of data. Users have the options to change the start and end years and to request net changes and percent changes for 1-month, 2-month, 3-month, 5-month, 6-month, and 12-month periods. The series title is displayed at the top of the graph. The selected measure (data type) is labeled along the y-axis. The data value is visible when the mouse cursor hovers over the graph line. The Series ID is labeled along the x-axis.
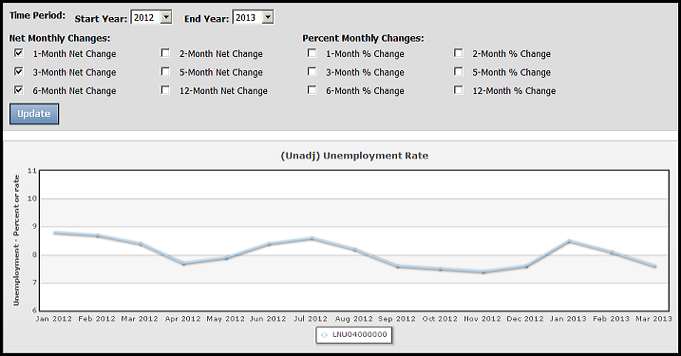
The time period parameters can be set via the Data Viewer after the initial query result. To set the beginning and ending dates for the displayed series, the user can click on the drop-down arrow for Start and End Year boxes. The user must click on the “Update” button to view the results. Net change and percent change can be displayed by selecting the checkboxes and clicking on the “Update” button to view the results in the data table.
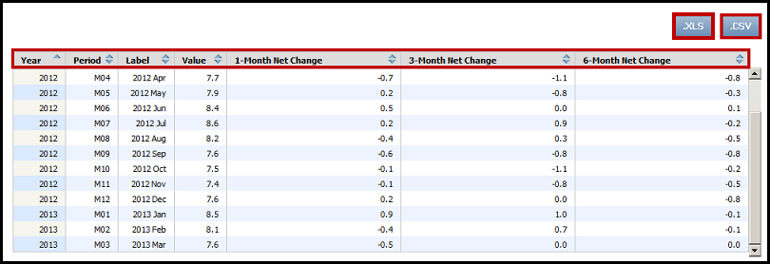
A user can sort the data in the column by clicking on the up/down arrows for the selected column. To sort more than one column, press SHIFT and select additional column headers. The default order of data displayed in a table is by year and period. For example, one can sort the 1-month percent change in descending order to determine what year/month had the largest changes from the prior month.
Data Viewer can export the data in the tables to Microsoft Excel and CSV by choosing one of the buttons located on the right-hand side above the data table. To download the data to an Excel file, a user must click on the “XLS” button. Each time series with its catalog information displayed in the data table is saved to separate worksheets within an Excel file. A user can also receive a CSV (comma separated values) by selecting the “CSV” button. The file will only contain the time series observations without the series catalog. The Label field is useful for labeling graphs when exporting data to Microsoft Excel.
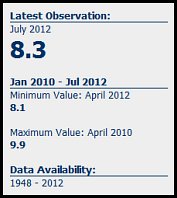
When a user elects to view a single time series by either clicking on a time series title link or checking the box next to the title and clicking on the “View Selected” button, Data Viewer displays all single series with series highlights in a box, (As shown in the example below, in addition to the data table and line graph).
Data Viewer displays multiple series information in a Data Table only. The first column displays the Series identifier (Series ID). Multiple series from the same survey are displayed in one table, as shown in the example below. Currently, the Data Viewer does not display multiple series in a graph. Multi-series graphing may be available in future releases.
The survey name displayed in the catalog information is a link to the selected series' program homepage.
The Data API (Application Programming Interface) enables the Data Finder tool to access information and observations from the BLS time series database and displays the data via the Data Viewer. Currently, the Data Finder API is not available for direct public use. However, in a later release, an API will be available for query and data extraction without interacting with Data Finder or Data Viewer components.
Refer to the following link for a full description of known limitations and future release details on Data Finder: https://www.bls.gov/bls/data_finder.htm.
Last Modified Date: May 21, 2013