Water work: Jobs related to water utilities
Elka Torpey | April 2017
More than 70 percent of the earth’s surface is covered in it.
We use most of it for purposes other than drinking.
We need it to survive.
It’s water, of course. But less than 1 percent of this essential compound is accessible for our consumption. We rely on workers in water and wastewater treatment to keep the supply we do have clean and safe—and available to us.
Industries related to water utilities include local government utilities; water, sewage, and other systems; and water and sewer system construction. As chart 1 shows, employment in local government utilities and water, sewage, and other systems has been relatively stable over the past decade. Water and sewer system construction employment, like construction employment as a whole, has fluctuated.
Chart 1. Employment in selected water-related industries, 2006–16
| Industry |
Local government utilities(1) |
Water and sewer system construction |
Water, sewage, and other systems |
|
Jan-2006
|
238,400 |
206,700 |
45,200 |
|
Feb-2006
|
238,400 |
207,700 |
45,200 |
|
Mar-2006
|
238,500 |
207,200 |
45,300 |
|
Apr-2006
|
238,500 |
209,900 |
46,000 |
|
May-2006
|
238,500 |
209,200 |
45,900 |
|
Jun-2006
|
238,700 |
210,500 |
46,000 |
|
Jul-2006
|
239,200 |
210,800 |
45,800 |
|
Aug-2006
|
239,800 |
211,100 |
46,100 |
|
Sep-2006
|
239,900 |
212,300 |
47,000 |
|
Oct-2006
|
240,300 |
211,000 |
46,000 |
|
Nov-2006
|
240,500 |
212,000 |
46,800 |
|
Dec-2006
|
240,700 |
211,600 |
46,900 |
|
Jan-2007
|
241,000 |
215,100 |
47,200 |
|
Feb-2007
|
241,400 |
208,500 |
47,300 |
|
Mar-2007
|
241,800 |
211,300 |
47,400 |
|
Apr-2007
|
242,000 |
213,600 |
47,400 |
|
May-2007
|
242,500 |
216,700 |
49,000 |
|
Jun-2007
|
242,800 |
213,100 |
50,000 |
|
Jul-2007
|
242,400 |
212,700 |
49,600 |
|
Aug-2007
|
242,200 |
205,700 |
49,400 |
|
Sep-2007
|
242,400 |
206,200 |
48,700 |
|
Oct-2007
|
242,800 |
204,500 |
48,800 |
|
Nov-2007
|
243,100 |
202,600 |
48,400 |
|
Dec-2007
|
243,200 |
202,500 |
48,700 |
|
Jan-2008
|
243,600 |
200,600 |
48,300 |
|
Feb-2008
|
243,800 |
200,100 |
47,900 |
|
Mar-2008
|
244,300 |
200,100 |
47,700 |
|
Apr-2008
|
244,800 |
196,400 |
48,100 |
|
May-2008
|
245,200 |
195,400 |
47,800 |
|
Jun-2008
|
246,100 |
192,600 |
47,000 |
|
Jul-2008
|
246,400 |
191,400 |
47,600 |
|
Aug-2008
|
246,900 |
192,600 |
47,500 |
|
Sep-2008
|
246,600 |
193,000 |
48,900 |
|
Oct-2008
|
246,500 |
187,800 |
48,400 |
|
Nov-2008
|
246,900 |
182,300 |
47,800 |
|
Dec-2008
|
246,800 |
181,700 |
47,600 |
|
Jan-2009
|
247,000 |
180,500 |
47,500 |
|
Feb-2009
|
247,200 |
177,200 |
47,800 |
|
Mar-2009
|
247,300 |
171,600 |
47,600 |
|
Apr-2009
|
246,700 |
164,700 |
47,400 |
|
May-2009
|
247,200 |
164,400 |
47,600 |
|
Jun-2009
|
247,000 |
162,000 |
47,600 |
|
Jul-2009
|
247,300 |
161,400 |
46,700 |
|
Aug-2009
|
246,500 |
159,700 |
46,400 |
|
Sep-2009
|
246,600 |
157,800 |
46,800 |
|
Oct-2009
|
246,000 |
156,500 |
47,000 |
|
Nov-2009
|
245,200 |
157,900 |
47,400 |
|
Dec-2009
|
244,900 |
153,700 |
47,000 |
|
Jan-2010
|
244,400 |
150,500 |
47,300 |
|
Feb-2010
|
243,800 |
150,200 |
47,000 |
|
Mar-2010
|
243,300 |
155,700 |
47,000 |
|
Apr-2010
|
243,100 |
158,700 |
46,700 |
|
May-2010
|
242,800 |
158,700 |
46,700 |
|
Jun-2010
|
242,300 |
158,400 |
46,800 |
|
Jul-2010
|
241,500 |
158,200 |
47,300 |
|
Aug-2010
|
241,800 |
157,900 |
47,500 |
|
Sep-2010
|
241,700 |
157,400 |
46,800 |
|
Oct-2010
|
241,600 |
157,300 |
46,500 |
|
Nov-2010
|
241,500 |
158,300 |
46,700 |
|
Dec-2010
|
241,700 |
153,400 |
47,100 |
|
Jan-2011
|
241,600 |
149,100 |
46,700 |
|
Feb-2011
|
241,300 |
150,000 |
46,800 |
|
Mar-2011
|
240,900 |
151,100 |
46,900 |
|
Apr-2011
|
240,700 |
151,500 |
46,700 |
|
May-2011
|
240,100 |
151,200 |
46,400 |
|
Jun-2011
|
239,800 |
151,300 |
45,400 |
|
Jul-2011
|
239,700 |
150,500 |
45,700 |
|
Aug-2011
|
240,600 |
150,100 |
45,600 |
|
Sep-2011
|
240,500 |
152,400 |
45,800 |
|
Oct-2011
|
240,400 |
154,000 |
46,000 |
|
Nov-2011
|
240,700 |
154,000 |
46,100 |
|
Dec-2011
|
239,900 |
154,300 |
46,300 |
|
Jan-2012
|
239,600 |
153,900 |
46,700 |
|
Feb-2012
|
239,600 |
153,000 |
46,800 |
|
Mar-2012
|
239,600 |
151,800 |
47,600 |
|
Apr-2012
|
239,700 |
151,700 |
46,300 |
|
May-2012
|
239,600 |
150,900 |
47,000 |
|
Jun-2012
|
239,500 |
151,700 |
47,600 |
|
Jul-2012
|
239,600 |
151,700 |
48,000 |
|
Aug-2012
|
239,000 |
151,500 |
48,200 |
|
Sep-2012
|
238,600 |
152,200 |
48,300 |
|
Oct-2012
|
238,600 |
150,800 |
48,200 |
|
Nov-2012
|
240,300 |
151,500 |
48,000 |
|
Dec-2012
|
239,700 |
153,800 |
47,400 |
|
Jan-2013
|
239,100 |
155,600 |
47,500 |
|
Feb-2013
|
239,100 |
155,800 |
47,800 |
|
Mar-2013
|
239,100 |
153,200 |
47,400 |
|
Apr-2013
|
239,000 |
153,100 |
47,600 |
|
May-2013
|
239,200 |
153,300 |
48,200 |
|
Jun-2013
|
238,900 |
153,600 |
47,800 |
|
Jul-2013
|
238,900 |
153,600 |
47,300 |
|
Aug-2013
|
239,100 |
153,400 |
47,200 |
|
Sep-2013
|
239,200 |
153,700 |
47,400 |
|
Oct-2013
|
239,200 |
154,300 |
47,300 |
|
Nov-2013
|
239,300 |
156,000 |
47,400 |
|
Dec-2013
|
239,300 |
154,200 |
47,300 |
|
Jan-2014
|
239,400 |
156,300 |
47,500 |
|
Feb-2014
|
239,500 |
155,600 |
47,300 |
|
Mar-2014
|
239,700 |
158,500 |
48,100 |
|
Apr-2014
|
240,000 |
159,700 |
48,400 |
|
May-2014
|
240,300 |
161,400 |
48,000 |
|
Jun-2014
|
240,500 |
160,600 |
47,800 |
|
Jul-2014
|
240,600 |
160,000 |
47,800 |
|
Aug-2014
|
240,700 |
161,700 |
48,400 |
|
Sep-2014
|
240,800 |
160,700 |
48,200 |
|
Oct-2014
|
240,900 |
161,700 |
48,400 |
|
Nov-2014
|
241,300 |
162,700 |
48,200 |
|
Dec-2014
|
240,800 |
164,500 |
49,300 |
|
Jan-2015
|
241,700 |
164,800 |
48,700 |
|
Feb-2015
|
241,500 |
168,300 |
48,800 |
|
Mar-2015
|
241,900 |
167,900 |
48,600 |
|
Apr-2015
|
242,000 |
166,600 |
48,700 |
|
May-2015
|
242,200 |
168,400 |
48,800 |
|
Jun-2015
|
242,300 |
169,400 |
48,800 |
|
Jul-2015
|
242,500 |
170,700 |
49,300 |
|
Aug-2015
|
242,700 |
172,100 |
50,100 |
|
Sep-2015
|
242,900 |
172,300 |
48,300 |
|
Oct-2015
|
243,100 |
173,000 |
48,200 |
|
Nov-2015
|
243,300 |
173,500 |
49,000 |
|
Dec-2015
|
243,500 |
174,900 |
48,800 |
|
Jan-2016
|
243,600 |
176,000 |
48,500 |
|
Feb-2016
|
243,800 |
178,500 |
48,500 |
|
Mar-2016
|
244,000 |
178,100 |
48,700 |
|
Apr-2016
|
244,100 |
179,400 |
48,800 |
|
May-2016
|
244,300 |
178,900 |
48,900 |
|
Jun-2016
|
243,900 |
179,100 |
49,400 |
|
Jul-2016
|
244,700 |
181,700 |
50,600 |
|
Aug-2016
|
244,900 |
179,400 |
50,300 |
|
Sep-2016
|
244,600 |
182,500 |
50,800 |
|
Oct-2016
|
245,200 |
183,100 |
51,100 |
|
Nov-2016
|
245,400 |
183,300 |
51,900 |
|
Dec-2016
|
245,200 |
181,200 |
52,300 |
These industries employ workers in a variety of jobs, including those in:
- management and supervision;
- design and construction;
- operations and maintenance; and
- office and administrative support.
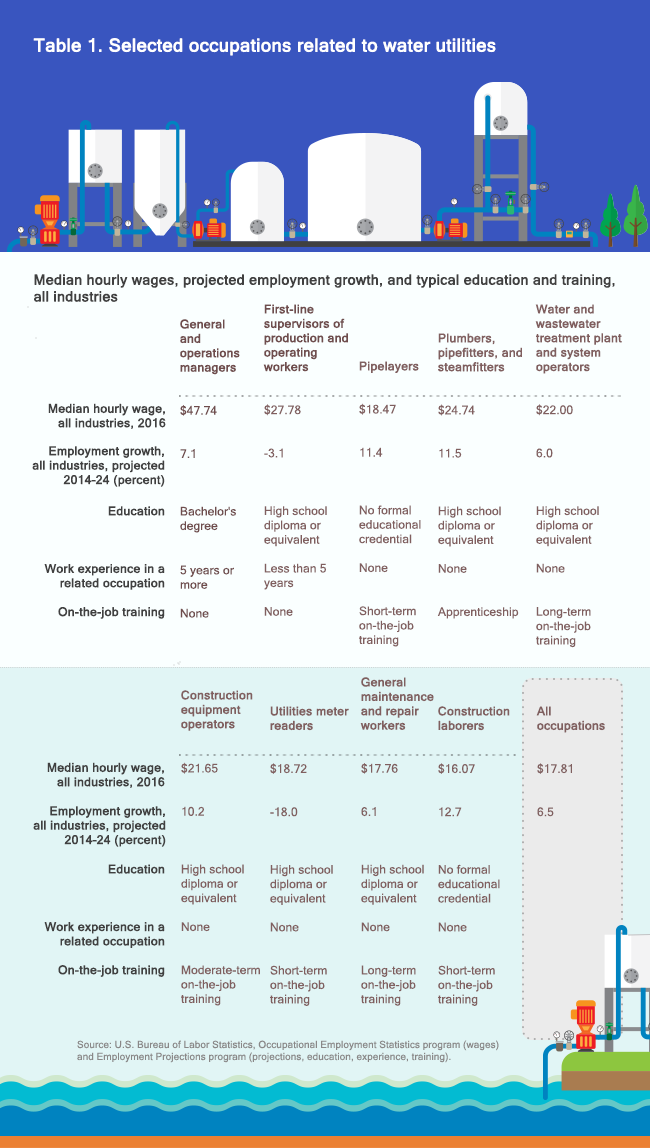
As table 1 shows, compared with all occupations, many of the selected occupations offer either higher pay or better job prospects, or both. And you can enter most of the occupations shown in the table with a high school diploma and on-the-job training.

Table 1. Median hourly wages, projected employment growth, and typical education and training, all industries, for selected occupations related to water utilities
| Occupation |
Median hourly wage, all industries, 2015 |
Employment growth, all industries, projected 2014–24 (percent) |
Education |
Work experience in a related occupation |
On-the-job training |
|
General and operations managers
|
$46.99 |
7.1 |
Bachelor's degree |
5 years or more |
None |
|
First-line supervisors of production and operating workers
|
$27.09 |
-3.1 |
High school diploma or equivalent |
Less than 5 years |
None |
|
Pipelayers
|
$18.16 |
11.4 |
No formal educational credential |
None |
Short-term on-the-job training |
|
Plumbers, pipefitters, and steamfitters
|
$24.34 |
11.5 |
High school diploma or equivalent |
None |
Apprenticeship |
|
Water and wastewater treatment plant and system operators
|
$21.53 |
6.0 |
High school diploma or equivalent |
None |
Long-term on-the-job training |
|
Construction equipment operators
|
$21.06 |
10.2 |
High school diploma or equivalent |
None |
Moderate-term on-the-job training |
|
Utilities meter readers
|
$18.51 |
-18.0 |
High school diploma or equivalent |
None |
Short-term on-the-job training |
|
General maintenance and repair workers
|
$17.61 |
6.1 |
High school diploma or equivalent |
None |
Long-term on-the-job training |
|
Construction laborers
|
$15.34 |
12.7 |
No formal educational credential |
None |
Short-term on-the-job training |
|
All occupations
|
$17.40 |
6.5 |
|
|
|
In addition to opportunities arising from growth, opportunities are expected from the need to replace workers who leave these occupations permanently. Chart 2 shows selected occupations related to water and wastewater treatment that the U.S. Bureau of Labor Statistics (BLS) projects to have higher-than-average replacement rates through 2024.
Chart 2. Selected water-related occupations with above-average replacement rates in all industries, projected 2014–24
| Occupation |
Replacement rate, all industries,
projected 2014–24 |
|
Septic tank servicers and sewer pipe cleaners
|
24.6 |
|
Water and wastewater treatment plant and system operators
|
25.4 |
|
Industrial machinery mechanics
|
25.9 |
|
Environmental engineers
|
28.3 |
|
Civil engineers
|
29.5 |
Learn more about these and other occupations in the Occupational Outlook Handbook. Detailed industry and occupation projections are available from the Employment Projections program.
Related Career Outlook articles:
Elka Torpey is an economist in the Office of Occupational Statistics and Employment Projections, BLS. She can be reached at torpey.elka@bls.gov.
Suggested citation:
Elka Torpey, "Water work: Jobs related to water utilities,"
Career Outlook,
U.S. Bureau of Labor Statistics,
April 2017.
 United States Department of Labor
