An official website of the United States government
 United States Department of Labor
Click a Major occupational group to select it. Detailed occupations available for the selected Major occupational group will automatically appear in Detailed occupations list.

Click on a detailed occupation to select it.

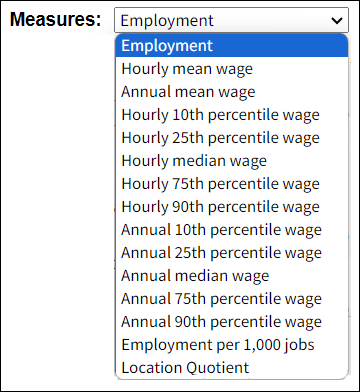
Click on a Measure to select it.

The National, State, and Metropolitan Area Occupational Employment and Wage Estimates consist of the following:
- Employment the estimated total occupational employment (not including self-employed).
- Hourly mean wage the estimated total hourly wages of an occupation divided by its estimated employment. For example, the average hourly wage.
- Annual mean wage the estimated total annual wages of an occupation divided by its estimated employment. For example, the average annual wage.
- Percentile wage estimates
The percentile wage estimate is the value of a wage below which a certain percent of workers fall.
The hourly wage estimates in this example indicate that:
Percentile 10% 25% 50%
Median75% 90% Hourly Wage
$11.00 $15.00 $20.00 $24.00 $29.00 Annual Wage
$22,880 $31,200 $41,600 $49,920 $60,320
- Hourly 10th percentile wage 10% of employees earn less than $11.00 per hour; therefore the remaining 90% earn more than $11.00 per hour.
- Hourly 25th percentile wage 25% earn less than $15.00; 75% earn more than $15.00.
- Hourly median wage 50% earn less than $20.00; 50% earn more than $20.00 (The 50th percentile is called the Median).
- Hourly 75th percentile wage 75% earn less than $24.00; 25% earn more than $24.00.
- Hourly 90th percentile wage 90% earn less than $29.00; 10% earn more than $29.00.
- Annual 10th percentile wage 10% of employees earn less than $22,880 per year; therefore the remaining 90% earn more than $22,880 per year.
- Annual 25th percentile wage 25% earn less than $31,200; 75% earn more than $31,200.
- Annual 10th percentile wage 10% of employees earn less than $22,880 per year; therefore the remaining 90% earn more than $22,880 per year.
- Annual median wage 50% earn less than $41,600; 50% earn more than $41,600 (The 50th percentile is called the Median).
- Annual 75th percentile wage 75% earn less than $49,920; 25% earn more than $49,920.
- Annual 90th percentile wage 90% earn less than $60,320; 10% earn more than $60,320.
- Employment per 1,000 jobs the number of jobs (employment) in the given occupation per 1,000 jobs in the given area.
- Location Quotient (State, metropolitan, and nonmetropolitan statistical area estimates only) the ratio of an occupation's share of employment in a given area to that occupation's share of employment in the U.S. as a whole. For example, an occupation that makes up 10 percent of employment in a specific metropolitan area compared with 2 percent of U.S. employment would have a location quotient of 5 for the area in question.
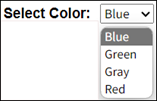
Click on a color to select it.

Once you have made your selections, click on Show Map to retrieve an updated map and data table.

Last Modified Date: September 9, 2024