An official website of the United States government
 United States Department of Labor
Click on a Major occupational group to select it. Detailed occupations available for the selected Major occupational group will automatically appear in detailed occupations list.

Click a Detailed occupation to select it. Estimates are available for over 800 Standard Occupational Classification (SOC) occupations.

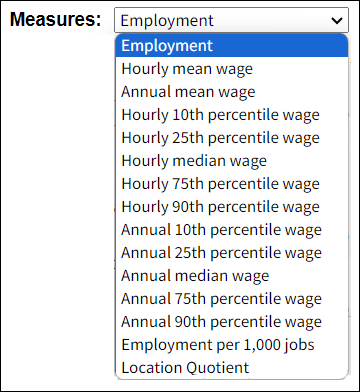
Click on a Measure to select it.

The National, State, and Metropolitan Area Occupational Employment and Wage Estimates consist of the following:
- Employment the estimated total occupational employment (not including self-employed).
- Hourly mean wage the estimated total hourly wages of an occupation divided by its estimated employment. For example, the average hourly wage.
- Annual mean wage the estimated total annual wages of an occupation divided by its estimated employment. For example, the average annual wage.
- Percentile wage estimates
The percentile wage estimate is the value of a wage below which a certain percent of workers fall.
The hourly wage estimates in this example indicate that:
Percentile 10% 25% 50%
Median75% 90% Hourly Wage
$11.00 $15.00 $20.00 $24.00 $29.00 Annual Wage
$22,880 $31,200 $41,600 $49,920 $60,320
- Hourly 10th percentile wage 10% of employees earn less than $11.00 per hour; therefore the remaining 90% earn more than $11.00 per hour.
- Hourly 25th percentile wage 25% earn less than $15.00; 75% earn more than $15.00.
- Hourly median wage 50% earn less than $20.00; 50% earn more than $20.00 (The 50th percentile is called the Median).
- Hourly 75th percentile wage 75% earn less than $24.00; 25% earn more than $24.00.
- Hourly 90th percentile wage 90% earn less than $29.00; 10% earn more than $29.00.
- Annual 10th percentile wage 10% of employees earn less than $22,880 per year; therefore the remaining 90% earn more than $22,880 per year.
- Annual 25th percentile wage 25% earn less than $31,200; 75% earn more than $31,200.
- Annual 10th percentile wage 10% of employees earn less than $22,880 per year; therefore the remaining 90% earn more than $22,880 per year.
- Annual median wage 50% earn less than $41,600; 50% earn more than $41,600 (The 50th percentile is called the Median).
- Annual 75th percentile wage 75% earn less than $49,920; 25% earn more than $49,920.
- Annual 90th percentile wage 90% earn less than $60,320; 10% earn more than $60,320.
- Employment per 1,000 jobs the number of jobs (employment) in the given occupation per 1,000 jobs in the given area.
- Location Quotient (State, metropolitan, and nonmetropolitan statistical area estimates only) the ratio of an occupation's share of employment in a given area to that occupation's share of employment in the U.S. as a whole. For example, an occupation that makes up 10 percent of employment in a specific metropolitan area compared with 2 percent of U.S. employment would have a location quotient of 5 for the area in question.
Click the profile type(s) to select it.

Click on the number of records to display to select it.

Once you have made your selections, click on Search to retrieve data.

Last Modified Date: September 9, 2024