An official website of the United States government
 United States Department of Labor
Prices for consumer goods and services are always changing. In general, prices have increased over time; this is known as inflation. Inflation is a process of continuously rising prices or, equivalently, of a continuously falling value of money. To determine how prices are changing, the Bureau of Labor Statistics (BLS) asks people how much money they spend on various products and services, then data collectors visit thousands of stores each month to collect prices of goods and services throughout the country. After all of the data are collected, BLS is able to calculate the Consumer Price Index (CPI). The inflation calculator will allow you to easily determine changes in the buying power of a dollar. Buying power is the amount of goods and services that can be purchased with a unit of currency, in our case U.S. dollars.
After completing this activity, you will better understand inflation, be able to locate the BLS inflation calculator, and identify BLS as the primary federal agency responsible for publishing inflation measures.
You can use the inflation calculator to determine the value of goods in years past and convert prices from years ago into today’s prices. For example, in 1997, electricians earned, on average, $17.50 per hour, which has the same buying power as about $27.00 in today’s dollars. In 2017, electricians actually earned $27.84 per hour on average! Electricians now earn about 84 cents more in 2017 compared to the buying power of what they were paid in 1997.

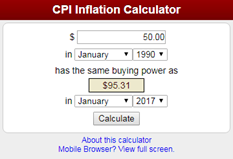
Question 1: Which amount has more buying power: $50.00 in January 1990, or $100.00 in January 2017?
Answer: $100 in January 2017 has more buying power than $50 in January 1990. The amount of $50.00 in January 1990 has about the same buying power as $95.31 in January 2017. This is an estimate based on prices across the country.
Question 2:Your grandfather says to your little brother, “In 1970, I never left home without a $5.00 bill.” What amount of money in June 2017 has the same buying power as $5.00 in June 1970?
Answer: In June 2017, $31.57 has the about same buying power as $5.00 in 1970!
Discussion:
Discuss inflation. For which items have your students noticed price changes? How have these changes affected them and their families?
Visit the Bureau of Labor Statistics Consumer Price Index (CPI) webpage for more information about inflation.
An index is a tool that simplifies the measurement of movements in a numerical series. BLS sets an average index level (representing the average price for an item or set of items) equal to 100, then measures change compared to that period. For example, an index of 110 indicates a 10% increase in price(s) since the base period (which is the period when the index equaled 100). You can measure the change between any two indexes in the same series (see example below). In the following scenarios, you will be provided the actual Consumer Price Index for All Urban Consumers (CPI-U) U.S. city average series for all items, not seasonally adjusted in various years. This is often referred to as the “official CPI” because it is the broadest and most comprehensive. Calculate the percent change between the indexes, and manually adjust the dollar amount to reflect the buying power. Be sure to show your work.
Last Modified Date: June 22, 2018