An official website of the United States government
An official website of the United States government
The .gov means it's official.
Federal government websites often end in .gov or .mil. Before sharing sensitive information,
make sure you're on a federal government site.
The site is secure.
The
https:// ensures that you are connecting to the official website and that any
information you provide is encrypted and transmitted securely.
17-259-KAN
Wednesday, February 22, 2017
In 2016, union members accounted for 9.7 percent of wage and salary workers in Missouri, compared with 8.8 percent in 2015, the U.S. Bureau of Labor Statistics reported today. Assistant Commissioner for Regional Operations Stanley W. Suchman noted that the union membership rate for the state was at its peak in 1989, when it averaged 15.5 percent, and at its low point in 2014 at 8.4 percent. (See chart 1 and table A.) Nationwide, union members accounted for 10.7 percent of employed wage and salary workers in 2016, down 0.4 percentage point from 2015. The union membership rate in Missouri has been below the U.S. average since 2004.
Missouri had 262,000 union members in 2016. In addition to these members, another 28,000 wage and salary workers in Missouri were represented by a union on their main job or were covered by an employee association or contract while not being union members themselves. (See table A.) Nationwide, 14.6 million wage and salary workers were union members in 2016 and 1.7 million wage and salary workers were not affiliated with a union but had jobs covered by a union contract.
| Year | Total employed | Members of unions (1) | Represented by unions (2) | ||
|---|---|---|---|---|---|
| Total | Percent of employed | Total | Percent of employed | ||
2006 | 2,610 | 284 | 10.9 | 310 | 11.9 |
2007 | 2,585 | 275 | 10.7 | 308 | 11.9 |
2008 | 2,543 | 285 | 11.2 | 327 | 12.8 |
2009 | 2,481 | 234 | 9.4 | 264 | 10.6 |
2010 | 2,469 | 244 | 9.9 | 274 | 11.1 |
2011 | 2,531 | 275 | 10.9 | 316 | 12.5 |
2012 | 2,507 | 224 | 8.9 | 253 | 10.1 |
2013 | 2,537 | 219 | 8.6 | 264 | 10.4 |
2014 | 2,559 | 214 | 8.4 | 249 | 9.7 |
2015 | 2,615 | 230 | 8.8 | 257 | 9.8 |
2016 | 2,711 | 262 | 9.7 | 290 | 10.7 |
Footnotes: | |||||
Note: Data refer to the sole or principal job of full- and part-time wage and salary workers. All self-employed workers are excluded, both those with incorporated businesses as well as those with unincorporated businesses. Updated population controls are introduced annually with the release of January data. | |||||
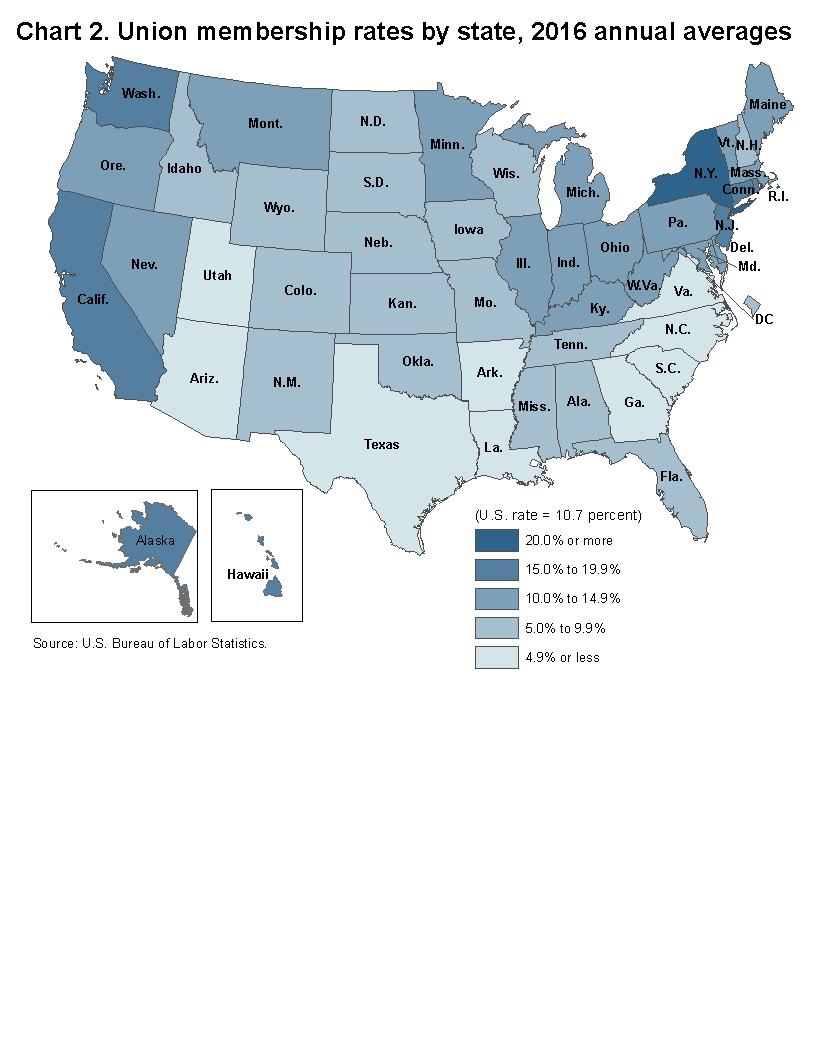
In 2016, 23 states had union membership rates above the U.S. average (10.7 percent), of which 8 had rates above 15.0 percent. (See table 1.) Of the eight states with the highest rates, four bordered the Pacific Ocean and four were located in the Northeast. (See chart 2.) New York had the highest rate at 23.6 percent, followed by Hawaii (19.9 percent) and Alaska (18.5 percent).
Twenty-seven states and the District of Columbia had union membership rates below the national average in 2016, with nine of these states having union membership rates below 5.0 percent. Among these nine states, seven were located in the South and two were in the West. South Carolina had the lowest rate at 1.6 percent followed by North Carolina (3.0 percent), Arkansas (3.9 percent), and Georgia (3.9 percent). Nationwide, union membership rates declined over the year in 31 states and the District of Columbia, increased in 16 states, and were unchanged in 3 states.
State union membership levels depend on both the employment level and the union membership rate. The largest numbers of union members lived in California (2.6 million) and New York (1.9 million). Over half of the 14.6 million union members in the U.S. lived in just 7 states (California, 2.6 million; New York, 1.9 million; Illinois, 0.8 million; Pennsylvania, 0.7 million; and Michigan, New Jersey, and Ohio, 0.6 million each), though these states accounted for only about one-third of wage and salary employment nationally.
The estimates in this release are obtained from the Current Population Survey (CPS), which provides the basic information on the labor force, employment, and unemployment. The survey is conducted monthly for the Bureau of Labor Statistics by the U.S. Census Bureau from a scientifically selected national sample of about 60,000 eligible households. The union membership data are tabulated from one-quarter of the CPS monthly sample and are limited to wage and salary workers. All self-employed workers are excluded.
Beginning in January of each year, data reflect revised population controls used in the CPS. Additional information about population controls is available at www.bls.gov/cps/population-control-adjustments-2016.pdf.
Reliability of the estimates
Statistics based on the CPS are subject to both sampling and nonsampling error. When a sample, rather than the entire population, is surveyed, there is a chance that the sample estimates may differ from the true population values they represent. The exact difference, or sampling error, varies depending upon the particular sample selected, and this variability is measured by the standard error of the estimate. There is about a 90-percent chance, or level of confidence, that an estimate based on a sample will differ by no more than 1.6 standard errors from the true population value because of sampling error. BLS analyses are generally conducted at the 90-percent level of confidence. The state discussion in this release preserves the longtime practice of highlighting the direction of the movements in state union membership rates and levels regardless of their statistical significance.
The CPS data also are affected by nonsampling error. Nonsampling error can occur for many reasons, including the failure to sample a segment of the population, inability to obtain information for all respondents in the sample, inability or unwillingness of respondents to provide correct information, and errors made in the collection or processing of the data.
Information about the reliability of data from the CPS and guidance on estimating standard errors is available at www.bls.gov/cps/documentation.htm#reliability.
Definitions
The principal definitions used in this release are described briefly below.
Union members. Data refer to members of a labor union or an employee association similar to a union.
Union membership rate. Data refer to the proportion of total wage and salary workers who are union members.
Represented by unions. Data refer to both union members and workers who report no union affiliation but whose jobs are covered by a union or an employee association contract.
Wage and salary workers. Workers who receive wages, salaries, commissions, tips, payment in kind, or piece rates. The group includes employees in both the private and public sectors. Union membership and earnings data exclude all self-employed workers, both those with incorporated businesses as well as those with unincorporated businesses.
Information in this release will be made available to sensory impaired individuals upon request. Voice phone: (202) 691-5200, Federal Relay Service: (800) 877-8339.
| State | 2015 | 2016 | ||||||||
|---|---|---|---|---|---|---|---|---|---|---|
| Total employed | Members of unions(1) | Represented by unions(2) | Total employed | Members of unions(1) | Represented by unions(2) | |||||
| Total | Percent of employed | Total | Percent of employed | Total | Percent of employed | Total | Percent of employed | |||
Alabama | 1,863 | 190 | 10.2 | 204 | 11.0 | 1,895 | 153 | 8.1 | 170 | 9.0 |
Alaska | 304 | 60 | 19.6 | 66 | 21.7 | 297 | 55 | 18.5 | 59 | 19.9 |
Arizona | 2,661 | 138 | 5.2 | 163 | 6.1 | 2,727 | 122 | 4.5 | 151 | 5.5 |
Arkansas | 1,155 | 58 | 5.1 | 74 | 6.4 | 1,186 | 47 | 3.9 | 59 | 5.0 |
California | 15,657 | 2,486 | 15.9 | 2,689 | 17.2 | 16,001 | 2,551 | 15.9 | 2,796 | 17.5 |
Colorado | 2,310 | 194 | 8.4 | 215 | 9.3 | 2,438 | 238 | 9.8 | 263 | 10.8 |
Connecticut | 1,587 | 269 | 17.0 | 277 | 17.4 | 1,568 | 275 | 17.5 | 288 | 18.4 |
Delaware | 412 | 38 | 9.2 | 43 | 10.4 | 419 | 48 | 11.4 | 56 | 13.3 |
District of Columbia | 334 | 35 | 10.4 | 40 | 12.1 | 343 | 32 | 9.5 | 37 | 10.7 |
Florida | 7,994 | 546 | 6.8 | 671 | 8.4 | 8,113 | 456 | 5.6 | 574 | 7.1 |
Georgia | 4,016 | 162 | 4.0 | 206 | 5.1 | 4,249 | 165 | 3.9 | 210 | 4.9 |
Hawaii | 583 | 119 | 20.4 | 126 | 21.7 | 597 | 119 | 19.9 | 125 | 20.9 |
Idaho | 679 | 46 | 6.8 | 50 | 7.3 | 689 | 42 | 6.1 | 47 | 6.8 |
Illinois | 5,566 | 847 | 15.2 | 892 | 16.0 | 5,587 | 812 | 14.5 | 856 | 15.3 |
Indiana | 2,828 | 283 | 10.0 | 319 | 11.3 | 2,927 | 304 | 10.4 | 335 | 11.4 |
Iowa | 1,435 | 138 | 9.6 | 174 | 12.2 | 1,454 | 129 | 8.9 | 153 | 10.5 |
Kansas | 1,255 | 110 | 8.7 | 136 | 10.8 | 1,274 | 109 | 8.6 | 132 | 10.3 |
Kentucky | 1,705 | 187 | 11.0 | 207 | 12.1 | 1,710 | 190 | 11.1 | 228 | 13.4 |
Louisiana | 1,847 | 107 | 5.8 | 126 | 6.8 | 1,799 | 76 | 4.2 | 88 | 4.9 |
Maine | 549 | 64 | 11.6 | 75 | 13.6 | 567 | 65 | 11.4 | 77 | 13.5 |
Maryland | 2,757 | 287 | 10.4 | 337 | 12.2 | 2,815 | 310 | 11.0 | 347 | 12.3 |
Massachusetts | 3,103 | 402 | 12.9 | 441 | 14.2 | 3,158 | 381 | 12.1 | 407 | 12.9 |
Michigan | 4,083 | 621 | 15.2 | 672 | 16.5 | 4,196 | 606 | 14.4 | 651 | 15.5 |
Minnesota | 2,565 | 363 | 14.2 | 385 | 15.0 | 2,563 | 365 | 14.2 | 388 | 15.2 |
Mississippi | 1,103 | 60 | 5.4 | 75 | 6.8 | 1,108 | 73 | 6.6 | 90 | 8.1 |
Missouri | 2,615 | 230 | 8.8 | 257 | 9.8 | 2,711 | 262 | 9.7 | 290 | 10.7 |
Montana | 427 | 52 | 12.2 | 59 | 13.9 | 418 | 50 | 11.9 | 58 | 13.9 |
Nebraska | 882 | 68 | 7.7 | 80 | 9.0 | 876 | 64 | 7.4 | 74 | 8.5 |
Nevada | 1,232 | 177 | 14.3 | 203 | 16.5 | 1,211 | 146 | 12.1 | 182 | 15.0 |
New Hampshire | 641 | 62 | 9.7 | 73 | 11.4 | 669 | 63 | 9.4 | 74 | 11.0 |
New Jersey | 3,880 | 596 | 15.4 | 644 | 16.6 | 4,007 | 644 | 16.1 | 666 | 16.6 |
New Mexico | 782 | 49 | 6.2 | 61 | 7.9 | 784 | 49 | 6.3 | 64 | 8.2 |
New York | 8,249 | 2,038 | 24.7 | 2,141 | 26.0 | 8,227 | 1,942 | 23.6 | 2,075 | 25.2 |
North Carolina | 4,089 | 123 | 3.0 | 167 | 4.1 | 4,225 | 129 | 3.0 | 174 | 4.1 |
North Dakota | 352 | 19 | 5.4 | 24 | 6.8 | 363 | 20 | 5.5 | 25 | 7.0 |
Ohio | 4,914 | 606 | 12.3 | 670 | 13.6 | 4,970 | 617 | 12.4 | 702 | 14.1 |
Oklahoma | 1,567 | 88 | 5.6 | 116 | 7.4 | 1,482 | 80 | 5.4 | 97 | 6.6 |
Oregon | 1,586 | 235 | 14.8 | 256 | 16.2 | 1,691 | 228 | 13.5 | 267 | 15.8 |
Pennsylvania | 5,601 | 747 | 13.3 | 804 | 14.4 | 5,686 | 685 | 12.1 | 724 | 12.7 |
Rhode Island | 483 | 68 | 14.2 | 72 | 14.9 | 481 | 74 | 15.5 | 81 | 16.9 |
South Carolina | 1,960 | 41 | 2.1 | 57 | 2.9 | 1,981 | 32 | 1.6 | 52 | 2.6 |
South Dakota | 382 | 22 | 5.9 | 26 | 6.9 | 379 | 20 | 5.2 | 26 | 7.0 |
Tennessee | 2,693 | 146 | 5.4 | 175 | 6.5 | 2,746 | 158 | 5.7 | 174 | 6.4 |
Texas | 11,177 | 503 | 4.5 | 626 | 5.6 | 11,457 | 462 | 4.0 | 606 | 5.3 |
Utah | 1,274 | 50 | 3.9 | 67 | 5.2 | 1,318 | 62 | 4.7 | 79 | 6.0 |
Vermont | 284 | 36 | 12.6 | 42 | 14.7 | 290 | 33 | 11.5 | 37 | 12.9 |
Virginia | 3,736 | 202 | 5.4 | 258 | 6.9 | 3,748 | 160 | 4.3 | 226 | 6.0 |
Washington | 2,977 | 500 | 16.8 | 536 | 18.0 | 3,090 | 539 | 17.4 | 577 | 18.7 |
West Virginia | 665 | 83 | 12.4 | 91 | 13.7 | 669 | 79 | 11.8 | 88 | 13.2 |
Wisconsin | 2,682 | 223 | 8.3 | 253 | 9.4 | 2,696 | 219 | 8.1 | 244 | 9.0 |
Wyoming | 261 | 19 | 7.1 | 22 | 8.2 | 248 | 16 | 6.3 | 18 | 7.3 |
Footnotes | ||||||||||
Note: Data refer to the sole or principal job of full- and part-time wage and salary workers. All self-employed workers are excluded, both those with incorporated businesses as well as those with unincorporated businesses. Updated population controls are introduced annually with the release of January data. | ||||||||||
Last Modified Date: Wednesday, February 22, 2017