An official website of the United States government
An official website of the United States government
The .gov means it's official.
Federal government websites often end in .gov or .mil. Before sharing sensitive information,
make sure you're on a federal government site.
The site is secure.
The
https:// ensures that you are connecting to the official website and that any
information you provide is encrypted and transmitted securely.
25-976-KAN
Thursday, June 12, 2025
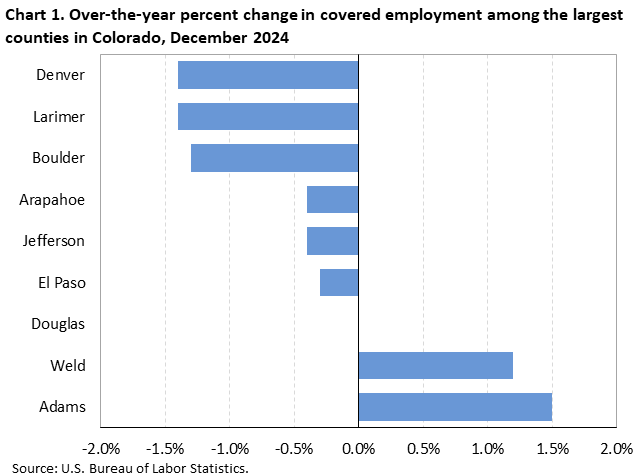
Employment fell in 6 of the 9 largest counties in Colorado from December 2023 to December 2024, the U.S. Bureau of Labor Statistics reported today. Assistant Commissioner for Regional Operations Michael Hirniak noted that Denver County and Larimer County had the largest over-the-year declines in employment (-1.4 percent each). (See chart 1 and table 1.)
Among the nine largest counties in Colorado, employment was highest in Denver County (563,700) in December 2024. Together, the nine largest counties accounted for 80.8 percent of total covered employment within the state. Nationwide, the 369 largest counties comprise 73.3 percent of total covered employment in the United States. (Large counties and county equivalents are those with annual average employment levels of 75,000 or more in 2023.)
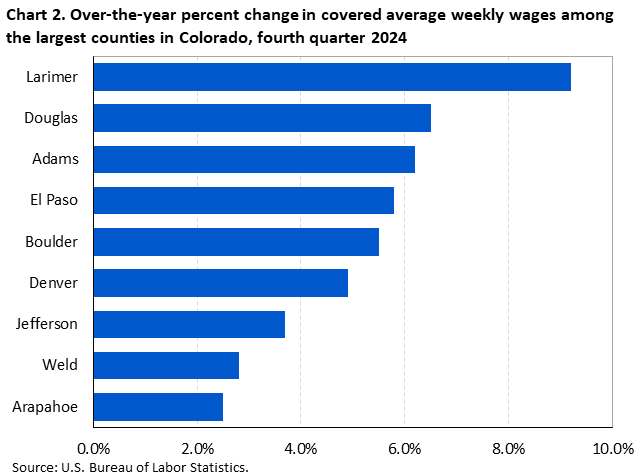
Large county average weekly wages in the fourth quarter 2024All nine large Colorado counties reported average weekly wage gains over the year. (See chart 2.) Larimer County had the largest gain (+9.2 percent). Over-the-year wage gains among Colorado’s other eight large counties ranged from 6.5 percent to 2.5 percent.
Weekly wages in 5 of the 9 largest counties in Colorado were above the national average of $1,507. Average weekly wages ranged from $1,979 in Denver County to $1,299 in Weld County.
Smaller county average weekly wages in the fourth quarter of 2024Employment and wage levels (but not over-the-year changes) are also available for the 55 small counties in Colorado, defined as having employment below 75,000 in 2023. (See table 2.) Wage levels in 52 of the 55 smaller counties were below the national average. Broomfield County reported the highest average weekly wage ($2,245). San Juan County reported the lowest average weekly wage ($786) in the state.
Among all 64 Colorado counties, 17 reported average weekly wages of less than $950, 17 registered wages from $950 to $1,099, 13 had wages from $1,100 to $1,249, and 17 had average weekly wages of $1,250 or higher. (See map 1 and table 2.)
QCEW data for states have been included in this release in table 3. For additional information about quarterly employment and wages data, please read the Technical Note for the County Employment and Wages News Release or visit the Quarterly Census of Employment and Wages website.
Employment and Wages Annual Averages Online features comprehensive information by detailed industry on establishments, employment, and wages for the nation and all states. This publication is typically published in September of the following year of the reference period or shortly after the QCEW first quarter full data update.
Information in this release will be made available to individuals with sensory impairments upon request. Voice phone: (202) 691-5200; Telecommunications Relay Service: 7-1-1.
The County Employment and Wages release for the first quarter 2025 is scheduled to be released on Tuesday, September 9, 2025.
The Quarterly Census of Employment and Wages (QCEW) is streamlining its release process. Beginning with the fourth quarter 2024 national release on June 4, QCEW will publish the national County Employment and Wages news release on the same date as the QCEW full data update. Revised news release dates are available online.
| Area | Establishments, fourth quarter (thousands) | Employment | Average weekly wage (1) | |||||
|---|---|---|---|---|---|---|---|---|
| December 2024 (thousands) | Percent change, December 2023–24 (2) | National ranking by percent change (3) | Fourth quarter 2024 ($) | National ranking by level (3) | Percent change, fourth quarter 2023–24 (2) | National ranking by percent change (3) | ||
United States (4) | 12,265.4 | 156,202.9 | 0.8 | -- | 1,507 | -- | 5.0 | -- |
Colorado | 236.6 | 2,911.3 | -0.3 | -- | 1,594 | 8 | 5.1 | 16 |
Adams | 13.4 | 254.7 | 1.5 | 55 | 1,497 | 91 | 6.2 | 46 |
Arapahoe | 25.0 | 340.2 | -0.4 | 313 | 1,665 | 47 | 2.5 | 324 |
Boulder | 17.7 | 193.6 | -1.3 | 354 | 1,892 | 19 | 5.5 | 80 |
Denver | 40.4 | 563.7 | -1.4 | 355 | 1,979 | 12 | 4.9 | 121 |
Douglas | 15.2 | 148.2 | 0.0 | 257 | 1,717 | 37 | 6.5 | 34 |
El Paso | 24.0 | 310.7 | -0.3 | 301 | 1,361 | 164 | 5.8 | 58 |
Jefferson | 23.7 | 248.2 | -0.4 | 313 | 1,572 | 68 | 3.7 | 233 |
Larimer | 14.6 | 173.9 | -1.4 | 355 | 1,449 | 116 | 9.2 | 9 |
Weld | 9.1 | 119.5 | 1.2 | 80 | 1,299 | 200 | 2.8 | 312 |
(1) Average weekly wages were calculated using unrounded data. | ||||||||
Note: Data are preliminary. Dashes indicate data not applicable or available. Covered employment and wages include workers covered by Unemployment Insurance (UI) and Unemployment Compensation for Federal Employees (UCFE) programs. | ||||||||
| Area | Establishments | Employment December 2024 | Average weekly wage ($) (1) |
|---|---|---|---|
United States (2) | 12,265,395 | 156,202,874 | 1,507 |
Colorado | 236,618 | 2,911,250 | 1,594 |
Adams | 13,402 | 254,694 | 1,497 |
Alamosa | 597 | 8,122 | 1,012 |
Arapahoe | 24,954 | 340,240 | 1,665 |
Archuleta | 654 | 4,801 | 1,011 |
Baca | 119 | 1,201 | 820 |
Bent | 94 | 1,153 | 963 |
Boulder | 17,741 | 193,617 | 1,892 |
Broomfield | 3,341 | 41,986 | 2,245 |
Chaffee | 1,183 | 9,122 | 1,071 |
Cheyenne | 93 | 704 | 1,261 |
Clear Creek | 379 | 3,523 | 1,194 |
Conejos | 190 | 1,594 | 830 |
Costilla | 111 | 964 | 818 |
Crowley | 70 | 1,103 | 1,120 |
Custer | 197 | 975 | 989 |
Delta | 997 | 8,907 | 981 |
Denver | 40,393 | 563,739 | 1,979 |
Dolores | 97 | 570 | 829 |
Douglas | 15,217 | 148,193 | 1,717 |
Eagle | 3,725 | 36,951 | 1,362 |
Elbert | 845 | 4,937 | 1,212 |
El Paso | 24,007 | 310,715 | 1,361 |
Fremont | 1,074 | 14,509 | 1,093 |
Garfield | 2,909 | 27,695 | 1,322 |
Gilpin | 218 | 4,748 | 1,585 |
Grand | 951 | 8,514 | 1,038 |
Gunnison | 1,291 | 9,906 | 1,101 |
Hinsdale | 76 | 288 | 845 |
Huerfano | 192 | 1,801 | 908 |
Jackson | 90 | 552 | 1,044 |
Jefferson | 23,700 | 248,223 | 1,572 |
Kiowa | 50 | 490 | 930 |
Kit Carson | 323 | 3,053 | 939 |
Lake | 284 | 3,128 | 1,173 |
La Plata | 2,956 | 26,945 | 1,310 |
Larimer | 14,635 | 173,894 | 1,449 |
Las Animas | 554 | 4,701 | 891 |
Lincoln | 170 | 2,219 | 1,057 |
Logan | 627 | 7,838 | 1,011 |
Mesa | 5,438 | 66,896 | 1,144 |
Mineral | 81 | 767 | 807 |
Moffat | 447 | 4,754 | 1,128 |
Montezuma | 978 | 9,444 | 925 |
Montrose | 1,674 | 17,359 | 1,068 |
Morgan | 850 | 13,292 | 1,166 |
Otero | 489 | 6,022 | 938 |
Ouray | 372 | 2,154 | 1,028 |
Park | 656 | 3,089 | 1,132 |
Phillips | 185 | 1,810 | 1,010 |
Pitkin | 1,992 | 19,786 | 1,739 |
Prowers | 381 | 4,798 | 891 |
Pueblo | 3,672 | 62,263 | 1,127 |
Rio Blanco | 265 | 2,886 | 1,259 |
Rio Grande | 476 | 4,368 | 992 |
Routt | 2,013 | 17,627 | 1,198 |
Saguache | 223 | 1,729 | 863 |
San Juan | 91 | 415 | 786 |
San Miguel | 764 | 6,608 | 1,188 |
Sedgwick | 93 | 718 | 850 |
Summit | 2,409 | 24,758 | 1,160 |
Teller | 999 | 8,346 | 1,073 |
Washington | 148 | 1,170 | 863 |
Weld | 9,117 | 119,488 | 1,299 |
Yuma | 420 | 4,040 | 1,044 |
(1) Average weekly wages were calculated using unrounded data. | |||
Note: Data are preliminary. Dashes indicate data not applicable or available. Covered employment and wages include workers covered by Unemployment Insurance (UI) and Unemployment Compensation for Federal Employees (UCFE) programs. | |||
| State | Establishments, fourth quarter (thousands) | Employment | Average weekly wage (1) | ||||
|---|---|---|---|---|---|---|---|
| December 2024 (thousands) | Percent change, December 2023–24 | Fourth quarter 2024 ($) | National ranking by level | Percent change, fourth quarter 2023–24 | National ranking by percent change | ||
United States (2) | 12,265.4 | 156,202.9 | 0.8 | 1,507 | -- | 5.0 | -- |
Alabama | 162.3 | 2,122.2 | 0.9 | 1,255 | 36 | 4.1 | 32 |
Alaska | 25.3 | 317.4 | 1.7 | 1,430 | 16 | 4.2 | 30 |
Arizona | 225.5 | 3,272.3 | 1.2 | 1,406 | 19 | 6.4 | 6 |
Arkansas | 106.1 | 1,312.6 | 1.1 | 1,153 | 50 | 5.9 | 10 |
California | 1,903.9 | 18,230.8 | 0.5 | 1,872 | 5 | 6.5 | 5 |
Colorado | 236.6 | 2,911.3 | -0.3 | 1,594 | 8 | 5.1 | 16 |
Connecticut | 150.7 | 1,700.7 | 0.5 | 1,716 | 6 | 5.2 | 15 |
Delaware | 45.2 | 480.6 | 1.5 | 1,437 | 15 | 4.5 | 24 |
District of Columbia | 52.4 | 757.2 | -0.5 | 2,495 | 1 | 4.7 | 21 |
Florida | 914.8 | 9,978.9 | 0.9 | 1,405 | 20 | 5.7 | 13 |
Georgia | 396.6 | 4,916.6 | 0.8 | 1,391 | 21 | 4.7 | 21 |
Hawaii | 61.4 | 651.3 | 1.1 | 1,345 | 27 | 4.3 | 26 |
Idaho | 103.9 | 859.1 | 0.5 | 1,232 | 39 | 8.3 | 3 |
Illinois | 411.2 | 6,089.1 | 0.5 | 1,538 | 12 | 4.1 | 32 |
Indiana | 194.6 | 3,201.9 | 0.4 | 1,222 | 44 | 4.4 | 25 |
Iowa | 112.5 | 1,559.3 | -0.6 | 1,237 | 38 | 3.2 | 50 |
Kansas | 103.5 | 1,445.6 | 0.9 | 1,218 | 45 | 4.3 | 26 |
Kentucky | 159.0 | 2,008.4 | 0.2 | 1,189 | 46 | 3.8 | 39 |
Louisiana | 156.8 | 1,936.3 | 1.1 | 1,228 | 40 | 2.8 | 51 |
Maine | 66.2 | 643.9 | 0.9 | 1,278 | 33 | 5.9 | 10 |
Maryland | 197.0 | 2,779.9 | 1.6 | 1,570 | 10 | 4.2 | 30 |
Massachusetts | 288.5 | 3,646.1 | -0.4 | 1,890 | 3 | 4.7 | 21 |
Michigan | 303.4 | 4,406.8 | -0.1 | 1,370 | 23 | 4.1 | 32 |
Minnesota | 215.1 | 2,945.4 | 1.1 | 1,452 | 14 | 3.7 | 42 |
Mississippi | 90.9 | 1,174.3 | 0.2 | 1,023 | 51 | 4.1 | 32 |
Missouri | 251.5 | 2,922.2 | 0.5 | 1,268 | 35 | 3.8 | 39 |
Montana | 65.8 | 512.8 | 0.5 | 1,254 | 37 | 6.4 | 6 |
Nebraska | 78.0 | 1,024.8 | 0.5 | 1,227 | 41 | 3.5 | 45 |
Nevada | 108.1 | 1,561.5 | 0.4 | 1,350 | 25 | 6.1 | 9 |
New Hampshire | 68.7 | 692.4 | 0.4 | 1,577 | 9 | 3.3 | 49 |
New Jersey | 339.1 | 4,332.2 | 0.9 | 1,629 | 7 | 3.4 | 47 |
New Mexico | 68.9 | 873.8 | 0.3 | 1,223 | 42 | 5.0 | 17 |
New York | 711.5 | 9,777.3 | 1.5 | 1,881 | 4 | 5.4 | 14 |
North Carolina | 384.0 | 4,941.9 | 0.5 | 1,358 | 24 | 5.8 | 12 |
North Dakota | 36.9 | 431.1 | 0.9 | 1,315 | 30 | 3.8 | 39 |
Ohio | 346.3 | 5,551.7 | 0.6 | 1,305 | 32 | 4.8 | 20 |
Oklahoma | 129.7 | 1,713.2 | 0.8 | 1,168 | 48 | 4.1 | 32 |
Oregon | 190.9 | 1,989.6 | 0.0 | 1,424 | 17 | 6.6 | 4 |
Pennsylvania | 395.1 | 6,076.5 | 0.8 | 1,414 | 18 | 4.0 | 37 |
Rhode Island | 48.9 | 500.8 | 1.6 | 1,348 | 26 | 3.5 | 45 |
South Carolina | 195.3 | 2,310.1 | 1.4 | 1,223 | 42 | 6.2 | 8 |
South Dakota | 40.6 | 459.7 | 0.9 | 1,181 | 47 | 3.9 | 38 |
Tennessee | 232.2 | 3,320.3 | 0.9 | 1,372 | 22 | 5.0 | 17 |
Texas | 846.0 | 14,129.7 | 1.5 | 1,488 | 13 | 4.3 | 26 |
Utah | 142.6 | 1,735.8 | 1.3 | 1,333 | 29 | 3.7 | 42 |
Vermont | 33.7 | 311.2 | 0.0 | 1,311 | 31 | 4.9 | 19 |
Virginia | 320.9 | 4,142.6 | 1.2 | 1,546 | 11 | 4.3 | 26 |
Washington | 241.5 | 3,612.0 | 0.8 | 1,897 | 2 | 8.7 | 2 |
West Virginia | 62.7 | 701.4 | 0.2 | 1,159 | 49 | 3.4 | 47 |
Wisconsin | 212.2 | 2,950.8 | 0.4 | 1,278 | 33 | 3.6 | 44 |
Wyoming | 31.1 | 279.4 | 0.5 | 1,340 | 28 | 12.4 | 1 |
Puerto Rico | 51.6 | 975.4 | -0.2 | 718 | (3) | 4.5 | (3) |
Virgin Islands | 3.0 | 33.1 | -8.6 | 1,046 | (3) | 1.8 | (3) |
(1) Average weekly wages were calculated using unrounded data. | |||||||
Note: Data are preliminary. Dashes indicate data not applicable or available. Covered employment and wages include workers covered by Unemployment Insurance (UI) and Unemployment Compensation for Federal Employees (UCFE) programs. | |||||||
Last Modified Date: Thursday, June 12, 2025