An official website of the United States government
An official website of the United States government
The .gov means it's official.
Federal government websites often end in .gov or .mil. Before sharing sensitive information,
make sure you're on a federal government site.
The site is secure.
The
https:// ensures that you are connecting to the official website and that any
information you provide is encrypted and transmitted securely.
26-839-KAN
Thursday, June 11, 2026
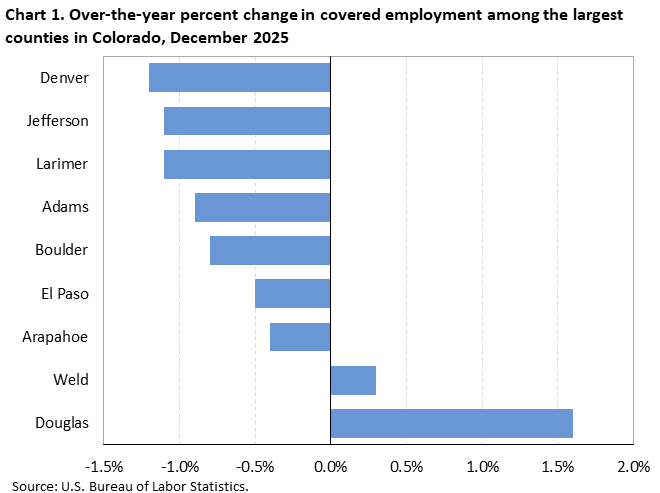
Employment declined in 7 of the 9 largest counties in Colorado from December 2024 to December 2025, the U.S. Bureau of Labor Statistics reported today. Acting Regional Commissioner Jerome Watters noted that Denver County (-1.2 percent) had the largest over-the-year decrease in employment. (See chart 1 and table 1.)
Denver County (559,800) had the highest employment level in Colorado in December 2025. Together, the nine largest counties accounted for 80.9 percent of total covered employment within the state. Nationwide, the 372 largest counties comprise 73.4 percent of total covered employment in the United States. (Large counties and county equivalents are those with annual average employment levels of 75,000 or more in 2024.)
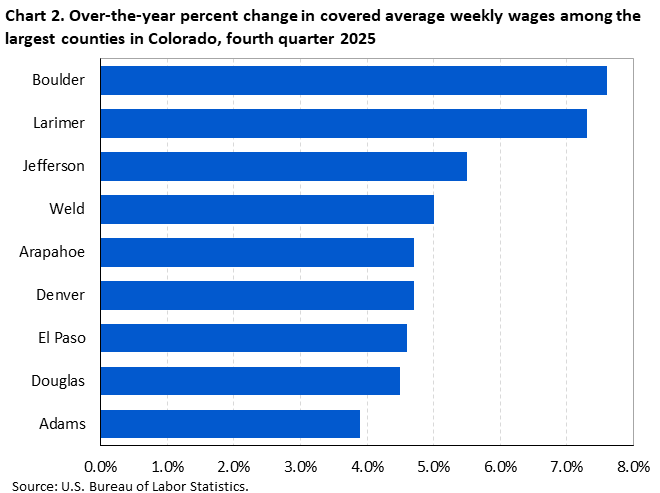
Large county average weekly wages in the fourth quarter 2025Average weekly wage gains in 8 of 9 large counties in Colorado were above the national average of 4.2 percent. (See chart 2.) Boulder had the largest gain (+7.6 percent). Over-the-year wage gains among the other eight large Colorado counties ranged from 7.3 percent to 3.9 percent.
Weekly wages in 5 of the 9 largest counties in Colorado were above the national average of $1,569. Average weekly wages ranged from $2,076 in Denver to $1,376 in Weld.
Smaller county average weekly wages in the fourth quarter of 2025Employment and wage levels (but not over-the-year changes) are also available for the 55 smaller counties in Colorado, defined as having employment below 75,000 in 2024. (See table 2.) Wage levels in 53 of the 55 smaller counties were below the national average. Broomfield reported the highest average weekly wage ($2,239) in the state. Dolores reported the lowest average weekly wage ($838).
Among all 64 Colorado counties, 16 reported average weekly wages of $999 or less, 11 had wages from $1,000 to $1,099, 11 had wages from $1,100 to $1,199, 8 had wages from $1,200 to $1,299, and 18 had average weekly wages of $1,300 or higher. (See map 1 and table 2.)
QCEW data for states have been included in this release in table 3.
Nationwide coverage of the largest counties is published in the County Employment and Wages news release. Additional information about quarterly employment and wages data is available in the news release Technical Note and from the Quarterly Census of Employment and Wages website.
If you are deaf, hard of hearing, or have a speech disability, please dial 7-1-1 to access telecommunications relay services.
The County Employment and Wages release for the first quarter 2026 is scheduled to be released on Friday, August 28, 2026.
| Area | Establishments, fourth quarter (thousands) |
Employment | Average weekly wage (1) | |||||
|---|---|---|---|---|---|---|---|---|
| December 2025 (thousands) |
Percent change, December 2024–25 (2) |
National ranking by percent change (3) |
Fourth quarter 2025 ($) |
National ranking by level (3) |
Percent change, fourth quarter 2024–25 (2) |
National ranking by percent change (3) |
||
|
United States (4) |
12,428.4 | 156,700.2 | 0.2 | -- | 1,569 | -- | 4.2 | -- |
|
Colorado |
258.5 | 2,896.4 | -0.6 | -- | 1,683 | 8 | 5.6 | 3 |
|
Adams |
14.6 | 251.6 | -0.9 | 297 | 1,523 | 101 | 3.9 | 208 |
|
Arapahoe |
26.9 | 341.2 | -0.4 | 221 | 1,751 | 44 | 4.7 | 113 |
|
Boulder |
19.2 | 191.4 | -0.8 | 282 | 2,036 | 15 | 7.6 | 8 |
|
Denver |
44.2 | 559.8 | -1.2 | 325 | 2,076 | 12 | 4.7 | 113 |
|
Douglas |
16.9 | 151.2 | 1.6 | 33 | 1,779 | 36 | 4.5 | 128 |
|
El Paso |
25.9 | 308.8 | -0.5 | 236 | 1,429 | 160 | 4.6 | 120 |
|
Jefferson |
25.8 | 246.0 | -1.1 | 314 | 1,666 | 60 | 5.5 | 54 |
|
Larimer |
15.8 | 170.0 | -1.1 | 314 | 1,564 | 92 | 7.3 | 11 |
|
Weld |
10.0 | 122.8 | 0.3 | 125 | 1,376 | 184 | 5.0 | 91 |
|
(1) Average weekly wages were calculated using unrounded data. |
||||||||
|
Note: Data are preliminary. Dashes indicate data not applicable or available. Covered employment and wages include workers covered by Unemployment Insurance (UI) and Unemployment Compensation for Federal Employees (UCFE) programs. |
||||||||
| Area | Establishments | Employment December 2025 | Average weekly wage ($) (1) |
|---|---|---|---|
|
United States (2) |
12,428,415 | 156,700,218 | 1,569 |
|
Colorado |
258,528 | 2,896,445 | 1,683 |
|
Adams |
14,625 | 251,553 | 1,523 |
|
Alamosa |
639 | 8,028 | 1,012 |
|
Arapahoe |
26,936 | 341,181 | 1,751 |
|
Archuleta |
702 | 4,784 | 1,049 |
|
Baca |
126 | 1,176 | 844 |
|
Bent |
93 | 1,158 | 963 |
|
Boulder |
19,206 | 191,406 | 2,036 |
|
Broomfield |
3,681 | 40,957 | 2,239 |
|
Chaffee |
1,289 | 9,097 | 1,123 |
|
Cheyenne |
94 | 712 | 1,324 |
|
Clear Creek |
421 | 3,670 | 1,288 |
|
Conejos |
203 | 1,569 | 894 |
|
Costilla |
116 | 883 | 896 |
|
Crowley |
71 | 1,111 | 1,097 |
|
Custer |
215 | 943 | 1,005 |
|
Delta |
1,058 | 8,525 | 1,013 |
|
Denver |
44,184 | 559,771 | 2,076 |
|
Dolores |
97 | 521 | 838 |
|
Douglas |
16,866 | 151,181 | 1,779 |
|
Eagle |
4,010 | 36,845 | 1,424 |
|
Elbert |
918 | 5,169 | 1,312 |
|
El Paso |
25,909 | 308,796 | 1,429 |
|
Fremont |
1,146 | 14,070 | 1,135 |
|
Garfield |
3,110 | 27,688 | 1,396 |
|
Gilpin |
229 | 4,725 | 1,361 |
|
Grand |
1,013 | 8,586 | 1,122 |
|
Gunnison |
1,369 | 9,612 | 1,180 |
|
Hinsdale |
78 | 257 | 853 |
|
Huerfano |
204 | 1,800 | 995 |
|
Jackson |
92 | 528 | 1,136 |
|
Jefferson |
25,783 | 246,003 | 1,666 |
|
Kiowa |
52 | 504 | 1,013 |
|
Kit Carson |
323 | 3,036 | 1,017 |
|
Lake |
295 | 3,005 | 1,222 |
|
La Plata |
3,174 | 27,319 | 1,388 |
|
Larimer |
15,795 | 170,021 | 1,564 |
|
Las Animas |
566 | 4,687 | 923 |
|
Lincoln |
172 | 2,174 | 1,164 |
|
Logan |
653 | 7,938 | 1,061 |
|
Mesa |
5,786 | 67,102 | 1,205 |
|
Mineral |
84 | 701 | 899 |
|
Moffat |
476 | 4,467 | 1,179 |
|
Montezuma |
1,044 | 8,974 | 999 |
|
Montrose |
1,766 | 17,485 | 1,149 |
|
Morgan |
905 | 12,936 | 1,210 |
|
Otero |
517 | 5,837 | 995 |
|
Ouray |
395 | 2,042 | 1,109 |
|
Park |
706 | 3,010 | 1,227 |
|
Phillips |
183 | 1,807 | 1,089 |
|
Pitkin |
2,089 | 19,329 | 1,900 |
|
Prowers |
393 | 4,567 | 915 |
|
Pueblo |
3,917 | 60,227 | 1,181 |
|
Rio Blanco |
267 | 2,776 | 1,291 |
|
Rio Grande |
505 | 4,137 | 1,093 |
|
Routt |
2,132 | 17,215 | 1,347 |
|
Saguache |
231 | 1,536 | 971 |
|
San Juan |
98 | 345 | 950 |
|
San Miguel |
807 | 6,427 | 1,234 |
|
Sedgwick |
96 | 686 | 927 |
|
Summit |
2,554 | 24,288 | 1,237 |
|
Teller |
1,084 | 7,829 | 1,114 |
|
Washington |
161 | 1,185 | 949 |
|
Weld |
10,042 | 122,826 | 1,376 |
|
Yuma |
424 | 4,074 | 1,076 |
|
(1) Average weekly wages were calculated using unrounded data. |
|||
|
Note: Data are preliminary. Dashes indicate data not applicable or available. Covered employment and wages include workers covered by Unemployment Insurance (UI) and Unemployment Compensation for Federal Employees (UCFE) programs. |
|||
| State | Establishments, fourth quarter (thousands) |
Employment | Average weekly wage (1) | ||||
|---|---|---|---|---|---|---|---|
| December 2025 (thousands) |
Percent change, December 2024–25 |
Fourth quarter 2025 ($) |
National ranking by level |
Percent change, fourth quarter 2024–25 |
National ranking by percent change |
||
|
United States (2) |
12,428.4 | 156,700.2 | 0.2 | 1,569 | -- | 4.2 | -- |
|
Alabama |
167.4 | 2,135.3 | 0.5 | 1,301 | 36 | 3.7 | 37 |
|
Alaska |
25.3 | 317.3 | -0.3 | 1,497 | 16 | 4.7 | 14 |
|
Arizona |
227.4 | 3,278.3 | 0.0 | 1,446 | 20 | 3.0 | 47 |
|
Arkansas |
113.0 | 1,318.2 | 0.4 | 1,213 | 49 | 5.0 | 8 |
|
California |
2,013.7 | 18,351.7 | 0.6 | 1,954 | 4 | 4.6 | 16 |
|
Colorado |
258.5 | 2,896.4 | -0.6 | 1,683 | 8 | 5.6 | 3 |
|
Connecticut |
149.8 | 1,706.5 | 0.1 | 1,801 | 6 | 5.0 | 8 |
|
Delaware |
47.3 | 481.0 | 0.1 | 1,502 | 15 | 4.7 | 14 |
|
District of Columbia |
51.0 | 726.1 | -4.5 | 2,587 | 1 | 4.1 | 24 |
|
Florida |
886.2 | 10,013.2 | 0.3 | 1,471 | 17 | 4.8 | 12 |
|
Georgia |
398.7 | 4,925.4 | 0.1 | 1,440 | 21 | 3.5 | 40 |
|
Hawaii |
63.0 | 650.0 | -0.2 | 1,411 | 25 | 5.0 | 8 |
|
Idaho |
104.3 | 875.7 | 1.8 | 1,303 | 35 | 5.8 | 2 |
|
Illinois |
387.7 | 6,089.5 | -0.1 | 1,588 | 11 | 3.3 | 42 |
|
Indiana |
195.6 | 3,211.2 | 0.1 | 1,276 | 40 | 4.5 | 17 |
|
Iowa |
110.6 | 1,560.0 | -0.2 | 1,282 | 39 | 3.7 | 37 |
|
Kansas |
101.8 | 1,443.2 | -0.1 | 1,268 | 44 | 4.1 | 24 |
|
Kentucky |
161.3 | 2,008.7 | -0.1 | 1,235 | 46 | 3.8 | 34 |
|
Louisiana |
159.2 | 1,927.3 | -0.5 | 1,267 | 45 | 3.2 | 44 |
|
Maine |
67.6 | 644.7 | -0.1 | 1,332 | 33 | 4.2 | 21 |
|
Maryland |
199.5 | 2,754.6 | -1.1 | 1,616 | 10 | 3.0 | 47 |
|
Massachusetts |
298.5 | 3,625.5 | -0.9 | 1,980 | 2 | 4.9 | 11 |
|
Michigan |
316.9 | 4,412.7 | 0.0 | 1,427 | 23 | 4.2 | 21 |
|
Minnesota |
215.2 | 2,948.0 | 0.0 | 1,505 | 14 | 3.7 | 37 |
|
Mississippi |
92.2 | 1,180.9 | 0.3 | 1,075 | 51 | 5.1 | 7 |
|
Missouri |
259.9 | 2,920.8 | -0.1 | 1,324 | 34 | 4.4 | 18 |
|
Montana |
62.3 | 512.3 | -0.1 | 1,296 | 38 | 3.3 | 42 |
|
Nebraska |
78.5 | 1,024.0 | -0.2 | 1,275 | 42 | 4.0 | 31 |
|
Nevada |
111.0 | 1,592.1 | 1.7 | 1,395 | 27 | 3.2 | 44 |
|
New Hampshire |
67.9 | 688.8 | -0.6 | 1,652 | 9 | 4.8 | 12 |
|
New Jersey |
343.1 | 4,343.1 | 0.2 | 1,691 | 7 | 3.9 | 33 |
|
New Mexico |
69.7 | 875.3 | -0.3 | 1,275 | 42 | 4.1 | 24 |
|
New York |
719.1 | 9,907.5 | 0.4 | 1,975 | 3 | 5.4 | 4 |
|
North Carolina |
392.1 | 4,991.1 | 0.9 | 1,409 | 26 | 3.8 | 34 |
|
North Dakota |
37.0 | 430.4 | -0.2 | 1,350 | 31 | 2.7 | 49 |
|
Ohio |
348.5 | 5,554.4 | 0.0 | 1,358 | 30 | 4.1 | 24 |
|
Oklahoma |
129.3 | 1,717.1 | 0.1 | 1,217 | 48 | 4.1 | 24 |
|
Oregon |
177.9 | 1,975.8 | -1.0 | 1,468 | 19 | 3.2 | 44 |
|
Pennsylvania |
398.1 | 6,094.8 | 0.2 | 1,470 | 18 | 4.0 | 31 |
|
Rhode Island |
49.1 | 500.3 | -0.1 | 1,429 | 22 | 6.0 | 1 |
|
South Carolina |
192.4 | 2,344.7 | 1.5 | 1,276 | 40 | 4.3 | 20 |
|
South Dakota |
41.2 | 458.9 | -0.2 | 1,230 | 47 | 4.1 | 24 |
|
Tennessee |
225.2 | 3,281.6 | -0.3 | 1,424 | 24 | 3.8 | 34 |
|
Texas |
860.8 | 14,255.2 | 0.8 | 1,549 | 13 | 4.2 | 21 |
|
Utah |
144.6 | 1,761.6 | 1.4 | 1,389 | 28 | 4.1 | 24 |
|
Vermont |
34.5 | 309.3 | -0.9 | 1,378 | 29 | 5.3 | 5 |
|
Virginia |
324.0 | 4,166.9 | 0.5 | 1,585 | 12 | 2.6 | 50 |
|
Washington |
242.1 | 3,590.3 | -0.3 | 1,948 | 5 | 2.4 | 51 |
|
West Virginia |
62.8 | 698.3 | -0.6 | 1,203 | 50 | 3.5 | 40 |
|
Wisconsin |
213.9 | 2,946.2 | -0.1 | 1,346 | 32 | 5.3 | 5 |
|
Wyoming |
31.7 | 278.4 | -0.8 | 1,297 | 37 | 4.4 | 18 |
|
Puerto Rico |
53.5 | 974.7 | -0.2 | 735 | (3) | 2.8 | (3) |
|
Virgin Islands |
3.0 | 34.7 | 0.3 | 1,068 | (3) | 2.7 | (3) |
|
(1) Average weekly wages were calculated using unrounded data. |
|||||||
|
Note: Data are preliminary. Dashes indicate data not applicable or available. Covered employment and wages include workers covered by Unemployment Insurance (UI) and Unemployment Compensation for Federal Employees (UCFE) programs. |
|||||||
Last Modified Date: Thursday, June 11, 2026