An official website of the United States government
An official website of the United States government
The .gov means it's official.
Federal government websites often end in .gov or .mil. Before sharing sensitive information,
make sure you're on a federal government site.
The site is secure.
The
https:// ensures that you are connecting to the official website and that any
information you provide is encrypted and transmitted securely.
17-149-ATL
Thursday, March 02, 2017
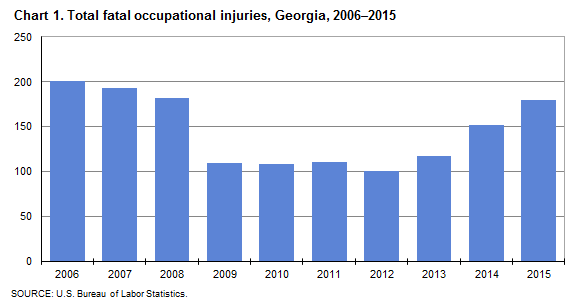
Fatal work injuries totaled 180 in 2015 for Georgia, the U.S. Bureau of Labor Statistics reported today. Regional Commissioner Janet S. Rankin noted that the number of work-related fatalities in Georgia was up from 152 in the previous year. Fatal occupational injuries in the state have ranged from a high of 249 in 1994 to a low of 101 in 2012. (See chart 1.)
Nationwide, a total of 4,836 fatal work injuries were recorded in 2015, a slight increase from the 4,821 fatal injuries in 2014, according to the results from the Census of Fatal Occupational Injuries (CFOI) program.
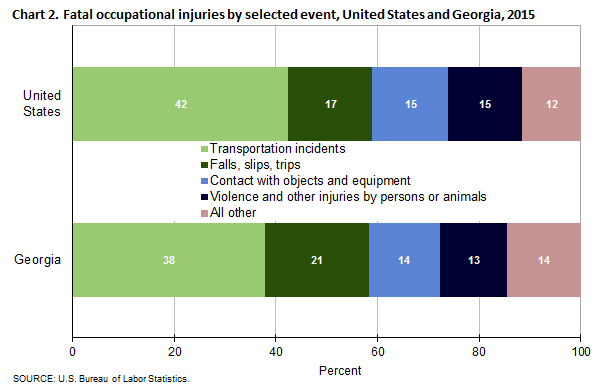
Type of incidentIn Georgia, transportation incidents resulted in 68 fatal work injuries and falls, slips, or trips accounted for 37 fatalities. These two major categories accounted for 58 percent of all workplace fatalities in Georgia. (See table 1.) The number of worker deaths from transportation incidents increased from 62 over the year and worker fatalities due to falls, slips, or trips were up from 29.
Contact with objects and equipment resulted in 25 fatalities and violence and other injuries by persons or animals accounted for 24 fatalities. Worker fatalities due to contact with objects and equipment were little changed from the prior year. The number of worker deaths from violence and other injuries by persons or animals was down from 33 in 2014.
Nationally, transportation incidents were the most frequent fatal workplace event in 2015, accounting for approximately 42 percent of fatal work injuries. (See chart 2.) Falls, slips, or trips was the second-most frequent type of event (17 percent), followed contact with objects and equipment (15 percent).
IndustryThe private construction industry sector had the largest number of fatalities in Georgia with 38, up from 32 in the previous year. (See table 2.) Falls, slips, or trips was the most frequent fatal event in the construction sector with 20 worker deaths, followed by exposure to harmful substances or environments with 7 fatalities. Over three-fourths of those fatally injured in this sector worked in specialty trade contracting.
The private transportation and warehousing industry sector had 31 workplace fatalities, up from 21 from the previous year. Long-distance general freight trucking accounted for 11, or 35 percent, of the fatal injuries in this industry.
OccupationTransportation and material moving occupations and construction and extraction occupations had the highest number of workplace fatalities with 50 and 33, respectively. (See table 3.) The majority of the fatalities within the transportation and material moving group were heavy and tractor-trailer truck drivers (37). Construction trades workers accounted for 27 of the 33 fatalities among construction and extraction workers.
Additional highlightsBeginning with the 2015 reference year, CFOI will publish a single, annual release with no revisions. A similar schedule will be followed in subsequent years. Preliminary releases, which normally appeared in August or September in past years, will no longer be produced.
Background of the program. The Census of Fatal Occupational Injuries (CFOI), part of the BLS Occupational Safety and Health Statistics (OSHS) program, compiles a count of all fatal work injuries occurring in the U.S. during the calendar year. The CFOI program uses diverse state, federal, and independent data sources to identify, verify, and describe fatal work injuries. This ensures counts are as complete and accurate as possible. For the 2015 data, over 21,400 unique source documents were reviewed as part of the data collection process. For technical information and definitions for CFOI, please go to the BLS Handbook of Methods on the BLS web site at www.bls.gov/opub/hom/pdf/homch9.pdf.
Federal/State agency coverage. The Census of Fatal Occupational Injuries includes data for all fatal work injuries, whether the decedent was working in a job covered by the Occupational Safety and Health Administration (OSHA) or other federal or state agencies or was outside the scope of regulatory coverage. Thus, any comparison between the BLS fatality census counts and those released by other agencies should take into account the different coverage requirements and definitions being used by each agency.
Acknowledgments. BLS thanks the Georgia Department of Health for their efforts in collecting accurate, comprehensive, and useful data on fatal work injuries. BLS also appreciates the efforts of all federal, state, local, and private sector entities that provided source documents used to identify fatal work injuries. Among these agencies are the Occupational Safety and Health Administration; the National Transportation Safety Board; the U.S. Coast Guard; the Mine Safety and Health Administration; the Office of Workers’ Compensation Programs (Federal Employees' Compensation and Longshore and Harbor Workers' Compensation divisions); the Federal Railroad Administration; the National Highway Traffic Safety Administration; state vital statistics registrars, coroners, and medical examiners; state departments of health, labor, and industrial relations and workers' compensation agencies; state and local police departments; and state farm bureaus.
Information in this release will be made available to sensory impaired individuals upon request. Voice phone: (202) 691-5200; Federal Relay Service: (800) 877-8339.
| Event or exposure (1) | 2014 | 2015 | |
|---|---|---|---|
| Number | Number | Percent | |
Total | 152 | 180 | 100 |
Violence and other injuries by persons or animals | 33 | 24 | 13 |
Intentional injury by person | 32 | 22 | 12 |
Homicides (Intentional injury by other person) | 18 | 14 | 8 |
Shooting by other person--intentional | 16 | 14 | 8 |
Suicides (Self-inflicted injury--intentional) | 14 | 8 | 4 |
Shooting--intentional self-harm | 10 | 6 | 3 |
Hanging, strangulation, asphyxiation--intentional self-harm | -- | 1 | 1 |
Transportation incidents | 62 | 68 | 38 |
Rail vehicle incidents | -- | 3 | 2 |
Collision between rail vehicle and another vehicle | -- | 2 | 1 |
Collision between rail and roadway vehicles | -- | 2 | 1 |
Pedestrian vehicular incident | 8 | 11 | 6 |
Pedestrian struck by vehicle in roadway | -- | 4 | 2 |
Pedestrian struck by forward-moving vehicle in roadway | -- | 4 | 2 |
Pedestrian struck by vehicle on side of road | -- | 3 | 2 |
Pedestrian struck by vehicle backing up in nonroadway area | -- | 1 | 1 |
Roadway incidents involving motorized land vehicle | 38 | 43 | 24 |
Roadway collision with other vehicle | 17 | 17 | 9 |
Roadway collision--moving in same direction | 8 | 6 | 3 |
Roadway collision--moving in opposite directions, oncoming | -- | 5 | 3 |
Roadway collision--moving and standing vehicle in roadway | -- | 2 | 1 |
Roadway collision--moving and standing vehicle on side of roadway | -- | 2 | 1 |
Roadway collision with object other than vehicle | 15 | 23 | 13 |
Vehicle struck object or animal on side of roadway | 14 | 23 | 13 |
Roadway noncollision incident | 6 | 3 | 2 |
Ran off roadway | -- | 1 | 1 |
Nonroadway incident involving motorized land vehicles | 11 | 8 | 4 |
Nonroadway collision with object other than vehicle | -- | 3 | 2 |
Nonroadway noncollision incident | 9 | 5 | 3 |
Jack-knifed or overturned, nonroadway | 8 | 3 | 2 |
Fires and explosions | -- | 6 | 3 |
Fires | -- | -- | -- |
Collapsing building, structure, or structural element during fire | -- | 1 | 1 |
Explosions | -- | 4 | 2 |
Demolition or blasting explosion | -- | 1 | 1 |
Falls, slips, trips | 29 | 37 | 21 |
Falls to lower level | 27 | 33 | 18 |
Fall from collapsing structure or equipment | -- | 3 | 2 |
Fall from collapsing structure or equipment 11 to 15 feet | -- | 1 | 1 |
Fall through surface or existing opening | 6 | 6 | 3 |
Fall through surface or existing opening 16 to 20 feet | -- | 1 | 1 |
Fall through surface or existing opening 26 to 30 feet | -- | 1 | 1 |
Fall through surface or existing opening more than 30 feet | -- | 1 | 1 |
Other fall to lower level | 21 | 23 | 13 |
Other fall to lower level 21 to 25 feet | -- | 5 | 3 |
Other fall to lower level 26 to 30 feet | -- | 1 | 1 |
Other fall to lower level more than 30 feet | 1 | 4 | 2 |
Exposure to harmful substances or environments | 4 | 20 | 11 |
Exposure to electricity | -- | 7 | 4 |
Direct exposure to electricity | -- | 4 | 2 |
Direct exposure to electricity, 220 volts or less | -- | 3 | 2 |
Exposure to other harmful substances | 3 | 12 | 7 |
Nonmedical use of drugs or alcohol--unintentional overdose | -- | 8 | 4 |
Inhalation of harmful substance | 1 | 4 | 2 |
Inhalation of harmful substance--single episode | 1 | 4 | 2 |
Contact with objects and equipment | 22 | 25 | 14 |
Struck by object or equipment | 15 | 22 | 12 |
Struck by powered vehicle--nontransport | 6 | 5 | 3 |
Struck or run over by rolling powered vehicle | -- | 3 | 2 |
Struck by falling object or equipment--other than powered vehicle | 8 | 15 | 8 |
Struck by object falling from vehicle or machinery--other than vehicle part | 3 | 4 | 2 |
Caught in or compressed by equipment or objects | 6 | 3 | 2 |
Caught in running equipment or machinery | 5 | 3 | 2 |
Caught in running equipment or machinery during maintenance, cleaning | 3 | 1 | 1 |
Overexertion and bodily reaction | -- | -- | -- |
Footnotes: | |||
NOTE: Data for all years are final. Totals for major categories may include subcategories not shown separately. Percentages may not add to totals because of rounding. CFOI fatality counts exclude illness-related deaths unless precipitated by an injury event. Dashes indicate no data reported or data that do not meet publication criteria. | |||
| Industry (1) | 2014 | 2015 | |
|---|---|---|---|
| Number | Number | Percent | |
Total | 152 | 180 | 100 |
Private industry | 137 | 165 | 92 |
Natural resources and mining | 16 | 10 | 6 |
Agriculture, forestry, fishing and hunting | 16 | 10 | 6 |
Animal production and aquaculture | -- | 1 | 1 |
Forestry and logging | 6 | 7 | 4 |
Construction | 32 | 38 | 21 |
Construction of buildings | 6 | 8 | 4 |
Residential building construction | -- | 3 | 2 |
Nonresidential building construction | 4 | 5 | 3 |
Heavy and civil engineering construction | -- | 1 | 1 |
Highway, street, and bridge construction | 1 | 1 | 1 |
Specialty trade contractors | 21 | 29 | 16 |
Foundation, structure, and building exterior contractors | 9 | 14 | 8 |
Building equipment contractors | 9 | 6 | 3 |
Other specialty trade contractors | -- | 7 | 4 |
Manufacturing | 15 | 27 | 15 |
Food manufacturing | 2 | 2 | 1 |
Animal slaughtering and processing | 1 | 2 | 1 |
Wood product manufacturing | 2 | 5 | 3 |
Veneer, plywood, and engineered wood product manufacturing | -- | 1 | 1 |
Paper manufacturing | 2 | 1 | 1 |
Pulp, paper, and paperboard mills | 1 | 1 | 1 |
Petroleum and coal products manufacturing | -- | 2 | 1 |
Asphalt paving, roofing, and saturated materials manufacturing | -- | 2 | 1 |
Chemical manufacturing | 2 | 3 | 2 |
Nonmetallic mineral product manufacturing | -- | 4 | 2 |
Cement and concrete product manufacturing | -- | 1 | 1 |
Other nonmetallic mineral product manufacturing | -- | 2 | 1 |
Fabricated metal product manufacturing | -- | 3 | 2 |
Architectural and structural metals manufacturing | -- | 1 | 1 |
Boiler, tank, and shipping container manufacturing | -- | 1 | 1 |
Machine shops; turned product; and screw, nut, and bolt manufacturing | -- | 1 | 1 |
Machinery manufacturing | -- | 1 | 1 |
Agriculture, construction, and mining machinery manufacturing | 1 | 1 | 1 |
Transportation equipment manufacturing | 1 | 1 | 1 |
Motor vehicle parts manufacturing | -- | 1 | 1 |
Trade, transportation, and utilities | 32 | 49 | 27 |
Utilities | -- | 1 | 1 |
Electric power generation, transmission and distribution | -- | 1 | 1 |
Wholesale trade | 5 | 6 | 3 |
Merchant wholesalers, durable goods | 4 | 4 | 2 |
Retail trade | 6 | 11 | 6 |
Motor vehicle and parts dealers | -- | 3 | 2 |
Food and beverage stores | 3 | 2 | 1 |
Gasoline stations | 2 | 1 | 1 |
General merchandise stores | -- | 1 | 1 |
Transportation and warehousing | 21 | 31 | 17 |
Truck transportation | 16 | 25 | 14 |
General freight trucking | 14 | 11 | 6 |
General freight trucking, long-distance | 8 | 11 | 6 |
Specialized freight trucking | -- | 14 | 8 |
Specialized freight (except used goods) trucking, local | -- | 3 | 2 |
Specialized freight (except used goods) trucking, long-distance | -- | 10 | 6 |
Transit and ground passenger transportation | 2 | 2 | 1 |
Taxi and limousine service | 2 | 2 | 1 |
Support activities for transportation | 1 | 2 | 1 |
Information | 3 | 2 | 1 |
Publishing industries (except internet) | -- | 1 | 1 |
Newspaper, periodical, book, and directory publishers | -- | 1 | 1 |
Broadcasting (except internet) | -- | 1 | 1 |
Cable and other subscription programming | -- | 1 | 1 |
Financial activities | 5 | -- | -- |
Professional and business services | 11 | 16 | 9 |
Professional and technical services | -- | 5 | 3 |
Professional, scientific, and technical services | -- | 5 | 3 |
Legal services | -- | 4 | 2 |
Advertising and related services | -- | 1 | 1 |
Administrative and waste services | 9 | 11 | 6 |
Administrative and support services | 6 | 10 | 6 |
Business support services | -- | 1 | 1 |
Investigation and security services | -- | 1 | 1 |
Services to buildings and dwellings | 5 | 8 | 4 |
Waste management and remediation services | 3 | 1 | 1 |
Remediation and other waste management services | -- | 1 | 1 |
Educational and health services | 5 | 1 | 1 |
Educational services | 2 | 1 | 1 |
Technical and trade schools | 2 | 1 | 1 |
Leisure and hospitality | 6 | 10 | 6 |
Arts, entertainment, and recreation | -- | 6 | 3 |
Performing arts, spectator sports, and related industries | -- | 4 | 2 |
Accommodation and food services | 4 | 4 | 2 |
Food services and drinking places | 4 | 3 | 2 |
Other services, except public administration | 12 | 10 | 6 |
Repair and maintenance | 7 | 5 | 3 |
Automotive repair and maintenance | 6 | 5 | 3 |
Personal and laundry services | 2 | 4 | 2 |
Death care services | -- | 1 | 1 |
Religious, grantmaking, civic, professional, and similar organizations | 3 | 1 | 1 |
Religious organizations | -- | 1 | 1 |
Government (2) | 15 | 15 | 8 |
Federal government | 5 | -- | -- |
State government | 1 | 4 | 2 |
Local government | 9 | 9 | 5 |
Footnotes: | |||
NOTE: Data for all years are final. Totals for major categories may include subcategories not shown separately. Percentages may not add to totals because of rounding. CFOI fatality counts exclude illness-related deaths unless precipitated by an injury event. Dashes indicate no data reported or data that do not meet publication criteria. | |||
| Occupation (1) | 2014 | 2015 | |
|---|---|---|---|
| Number | Number | Percent | |
Total | 152 | 180 | 100 |
Management occupations | 9 | 3 | 2 |
Business and financial operations occupations | -- | 3 | 2 |
Computer and mathematical occupations | -- | -- | -- |
Architecture and engineering occupations | -- | -- | -- |
Life, physical, and social science occupations | -- | -- | -- |
Community and social services occupations | -- | 1 | 1 |
Religious workers | -- | 1 | 1 |
Clergy | -- | 1 | 1 |
Legal occupations | 1 | 3 | 2 |
Lawyers, judges, and related workers | 1 | 3 | 2 |
Lawyers and judicial law clerks | 1 | 3 | 2 |
Education, training, and library occupations | -- | -- | -- |
Arts, design, entertainment, sports, and media occupations | 1 | 6 | 3 |
Entertainers and performers, sports and related workers | -- | 4 | 2 |
Musicians, singers, and related workers | -- | 4 | 2 |
Healthcare practitioners and technical occupations | -- | -- | -- |
Healthcare support occupations | -- | -- | -- |
Protective service occupations | 6 | 11 | 6 |
Supervisors of protective service workers | -- | 1 | 1 |
First-line supervisors of fire fighting and prevention workers | -- | 1 | 1 |
Law enforcement workers | 4 | 9 | 5 |
Bailiffs, correctional officers, and jailers | -- | 2 | 1 |
Police officers | 4 | 7 | 4 |
Other protective service workers | -- | 1 | 1 |
Security guards and gaming surveillance officers | -- | 1 | 1 |
Food preparation and serving related occupations | 2 | 3 | 2 |
Building and grounds cleaning and maintenance occupations | 7 | 12 | 7 |
Supervisors of building and grounds cleaning and maintenance workers | -- | 4 | 2 |
First-line supervisors of building and grounds cleaning and maintenance workers | -- | 4 | 2 |
Building cleaning and pest control workers | -- | 1 | 1 |
Pest control workers | -- | 1 | 1 |
Grounds maintenance workers | 6 | 7 | 4 |
Landscaping and groundskeeping workers | 3 | 4 | 2 |
Personal care and service occupations | 2 | 2 | 1 |
Funeral service workers | -- | 1 | 1 |
Funeral attendants | -- | 1 | 1 |
Other personal care and service workers | -- | 1 | 1 |
Recreation and fitness workers | -- | 1 | 1 |
Sales and related occupations | 9 | 11 | 6 |
Supervisors of sales workers | 3 | 5 | 3 |
First-line supervisors of sales workers | 3 | 5 | 3 |
Retail sales workers | 3 | 5 | 3 |
Cashiers | 2 | 2 | 1 |
Retail salespersons | 1 | 3 | 2 |
Office and administrative support occupations | 4 | -- | -- |
Farming, fishing, and forestry occupations | 11 | 4 | 2 |
Agricultural workers | 8 | 1 | 1 |
Forest, conservation, and logging workers | -- | 3 | 2 |
Logging workers | -- | 3 | 2 |
Construction and extraction occupations | 29 | 33 | 18 |
Supervisors of construction and extraction workers | 3 | 5 | 3 |
First-line supervisors of construction trades and extraction workers | 3 | 5 | 3 |
Construction trades workers | 26 | 27 | 15 |
Brickmasons, blockmasons, and stonemasons | -- | 1 | 1 |
Carpenters | -- | 1 | 1 |
Construction laborers | 9 | 10 | 6 |
Drywall installers, ceiling tile installers, and tapers | -- | 1 | 1 |
Roofers | 5 | 6 | 3 |
Extraction workers | -- | 1 | 1 |
Explosives workers, ordnance handling experts, and blasters | -- | 1 | 1 |
Installation, maintenance, and repair occupations | 12 | 21 | 12 |
Supervisors of installation, maintenance, and repair workers | -- | 3 | 2 |
First-line supervisors of mechanics, installers, and repairers | -- | 3 | 2 |
Vehicle and mobile equipment mechanics, installers, and repairers | 4 | 9 | 5 |
Automotive technicians and repairers | 4 | 6 | 3 |
Other installation, maintenance, and repair occupations | 6 | 9 | 5 |
Heating, air conditioning, and refrigeration mechanics and installers | -- | 4 | 2 |
Industrial machinery installation, repair, and maintenance workers | -- | 1 | 1 |
Line installers and repairers | -- | 1 | 1 |
Production occupations | 10 | 14 | 8 |
Supervisors of production workers | -- | 4 | 2 |
First-line supervisors of production and operating workers | -- | 4 | 2 |
Assemblers and fabricators | -- | 1 | 1 |
Structural metal fabricators and fitters | -- | 1 | 1 |
Metal workers and plastic workers | 3 | 3 | 2 |
Machine tool cutting setters, operators, and tenders, metal and plastic | -- | 1 | 1 |
Plant and system operators | -- | 1 | 1 |
Other production occupations | 4 | 3 | 2 |
Crushing, grinding, polishing, mixing, and blending workers | -- | 1 | 1 |
Transportation and material moving occupations | 41 | 50 | 28 |
Air transportation workers | 2 | 2 | 1 |
Aircraft pilots and flight engineers | 2 | 2 | 1 |
Commercial pilots | 2 | 2 | 1 |
Motor vehicle operators | 32 | 41 | 23 |
Driver/sales workers and truck drivers | 30 | 39 | 22 |
Heavy and tractor-trailer truck drivers | 29 | 37 | 21 |
Taxi drivers and chauffeurs | 2 | 2 | 1 |
Material moving workers | 6 | 7 | 4 |
Crane and tower operators | 1 | 1 | 1 |
Laborers and material movers, hand | 3 | 5 | 3 |
Military specific occupations (2) | 3 | 1 | 1 |
Footnotes: | |||
NOTE: Data for all years are final. Totals for major categories may include subcategories not shown separately. Percentages may not add to totals because of rounding. CFOI fatality counts exclude illness-related deaths unless precipitated by an injury event. Dashes indicate no data reported or data that do not meet publication criteria. | |||
| Worker characteristics | 2014 | 2015 | |
|---|---|---|---|
| Number | Number | Percent | |
Total | 152 | 180 | 100 |
Employee status | |||
Wage and salary workers (1) | 124 | 138 | 77 |
Self-employed (2) | 28 | 42 | 23 |
Gender | |||
Men | 139 | 172 | 96 |
Women | 13 | 8 | 4 |
Age (3) | |||
18 to 19 years | -- | 3 | 2 |
20 to 24 years | 8 | 15 | 8 |
25 to 34 years | 24 | 27 | 15 |
35 to 44 years | 30 | 42 | 23 |
45 to 54 years | 50 | 40 | 22 |
55 to 64 years | 29 | 34 | 19 |
65 years and over | 10 | 18 | 10 |
Race or ethnic origin (4) | |||
White, non-Hispanic | 87 | 112 | 62 |
Black or African-American, non-Hispanic | 36 | 36 | 20 |
Hispanic or Latino | 21 | 26 | 14 |
Footnotes: | |||
NOTE: Data for all years are final. Totals for major categories may include subcategories not shown separately. Percentages may not add to totals because of rounding. CFOI fatality counts exclude illness-related deaths unless precipitated by an injury event. Dashes indicate no data reported or data that do not meet publication criteria. | |||
Last Modified Date: Thursday, March 02, 2017