An official website of the United States government
An official website of the United States government
The .gov means it's official.
Federal government websites often end in .gov or .mil. Before sharing sensitive information,
make sure you're on a federal government site.
The site is secure.
The
https:// ensures that you are connecting to the official website and that any
information you provide is encrypted and transmitted securely.
18-169-ATL
Friday, February 23, 2018
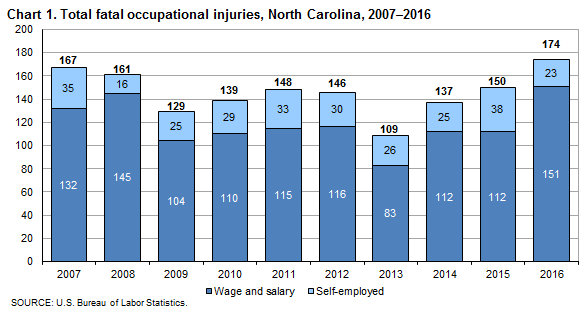
Fatal work injuries totaled 174 in 2016 for North Carolina, the U.S. Bureau of Labor Statistics reported today. Regional Commissioner Janet S. Rankin noted that the number of work-related fatalities in North Carolina has increased in each of the last three years. Fatal occupational injuries in the state have ranged from a high of 234 in 2000 to a low of 109 in 2013. (See chart 1.)
Nationwide, a total of 5,190 fatal work injuries were recorded in 2016, a 7-percent increase from the 4,836 fatal injuries in 2015, according to the results from the Census of Fatal Occupational Injuries (CFOI) program. This was the third consecutive increase in annual workplace fatalities and the first time more than 5,000 fatalities have been recorded since 2008.
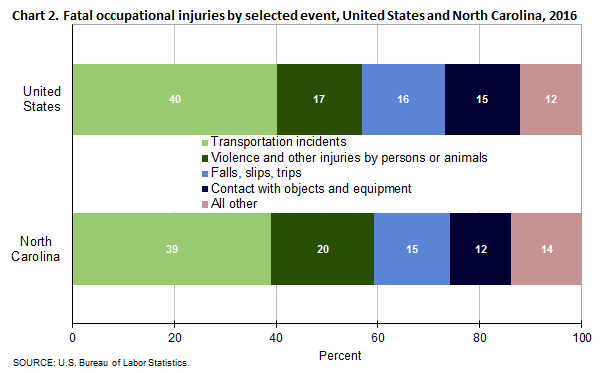
Type of incidentIn North Carolina, transportation incidents resulted in 68 fatal work injuries and violence and other injuries by persons or animals accounted for 35 fatalities. These two major categories accounted for 59 percent of all workplace fatalities in North Carolina. (See table 1.) The number of worker deaths from transportation incidents increased from 51 over the year and worker fatalities due to violence and other injuries by persons or animals were up from 24. Falls, slips, or trips was the third-most frequent fatal work event with 26 fatalities, unchanged from 2015.
Nationally, transportation incidents were the most frequent fatal workplace event in 2016, accounting for approximately 40 percent of fatal work injuries. (See chart 2.) Violence and other injuries by persons or animals was the second-most common fatal event (17 percent), followed by falls, slips, or trips (16 percent).
IndustryThe private construction sector had the largest number of fatalities in North Carolina with 30, unchanged from the previous year. (See table 2.) Specialty trade contracting accounted for 22, or about 73 percent, of the fatal injuries in this industry.
The private transportation and warehousing industry sector had 25 workplace fatalities, up from 16 in the previous year. Thirteen, or 52 percent, of those fatally injured in this sector worked in general freight trucking.
OccupationTransportation and material moving occupations and construction and extraction occupations had the highest number of workplace fatalities with 44 and 30, respectively. (See table 3.) The majority of the fatalities within the transportation and material moving group were heavy and tractor-trailer truck drivers (25). Construction laborers accounted for 8 of the 30 fatalities among construction and extraction workers.
Additional highlightsBackground of the program. The Census of Fatal Occupational Injuries (CFOI), part of the BLS Occupational Safety and Health Statistics (OSHS) program, compiles a count of all fatal work injuries occurring in the U.S. during the calendar year. The CFOI program uses diverse state, federal, and independent data sources to identify, verify, and describe fatal work injuries. This ensures counts are as complete and accurate as possible. For the 2016 national data, over 23,300 unique source documents were reviewed as part of the data collection process. For the North Carolina 2016 data, 923 unique source documents were reviewed. For technical information and definitions for CFOI, please go to the BLS Handbook of Methods on the BLS web site at www.bls.gov/opub/hom/cfoi/home.htm.
Federal/State agency coverage. The Census of Fatal Occupational Injuries includes data for all fatal work injuries, whether the decedent was working in a job covered by the Occupational Safety and Health Administration (OSHA) or other federal or state agencies or was outside the scope of regulatory coverage. Thus, any comparison between the BLS fatality census counts and those released by other agencies should take into account the different coverage requirements and definitions being used by each agency.
Acknowledgments. BLS thanks the North Carolina Department of Health for their efforts in collecting accurate, comprehensive, and useful data on fatal work injuries. BLS also appreciates the efforts of all federal, state, local, and private sector entities that provided source documents used to identify fatal work injuries. Among these agencies are the Occupational Safety and Health Administration; the National Transportation Safety Board; the U.S. Coast Guard; the Mine Safety and Health Administration; the Office of Workers’ Compensation Programs (Federal Employees' Compensation and Longshore and Harbor Workers' Compensation divisions); the Federal Railroad Administration; the National Highway Traffic Safety Administration; state vital statistics registrars, coroners, and medical examiners; state departments of health, labor, and industrial relations and workers' compensation agencies; state and local police departments; and state farm bureaus.
Information in this release will be made available to sensory impaired individuals upon request. Voice phone: (202) 691-5200; Federal Relay Service: (800) 877-8339.
| Event or exposure (1) | 2015 | 2016 | |
|---|---|---|---|
| Number | Number | Percent | |
Total | 150 | 174 | 100 |
Violence and other injuries by persons or animals | 24 | 35 | 20 |
Intentional injury by person | 20 | 33 | 19 |
Homicides (Intentional injury by other person) | 14 | 25 | 14 |
Suicides (Self-inflicted injury--intentional) | 6 | 8 | 5 |
Transportation incidents | 51 | 68 | 39 |
Aircraft incidents | -- | 3 | 2 |
Other in-flight crash | 1 | 2 | 1 |
Parachuting incident | -- | 1 | 1 |
Pedestrian vehicular incident | 5 | 14 | 8 |
Pedestrian struck by vehicle in roadway | -- | 6 | 3 |
Pedestrian struck by vehicle in nonroadway area | -- | 6 | 3 |
Water vehicle incidents | 5 | 3 | 2 |
Roadway incidents involving motorized land vehicle | 35 | 37 | 21 |
Roadway collision with other vehicle | 19 | 13 | 7 |
Roadway collision with object other than vehicle | 9 | 15 | 9 |
Roadway noncollision incident | 7 | 9 | 5 |
Nonroadway incident involving motorized land vehicles | 4 | 10 | 6 |
Fires and explosions | 3 | 3 | 2 |
Fires | -- | 1 | 1 |
Falls, slips, trips | 26 | 26 | 15 |
Falls to lower level | 21 | 23 | 13 |
Fall through surface or existing opening | -- | 5 | 3 |
Other fall to lower level | 16 | 17 | 10 |
Exposure to harmful substances or environments | 13 | 20 | 11 |
Exposure to electricity | 4 | 3 | 2 |
Indirect exposure to electricity | -- | 3 | 2 |
Exposure to temperature extremes | 3 | 5 | 3 |
Exposure to environmental heat | 3 | 4 | 2 |
Exposure to other harmful substances | 3 | 8 | 5 |
Nonmedical use of drugs or alcohol--unintentional overdose | -- | 7 | 4 |
Exposure to oxygen deficiency, n.e.c. | -- | 4 | 2 |
Drowning, submersion, n.e.c. | -- | 4 | 2 |
Contact with objects and equipment | 33 | 21 | 12 |
Struck by object or equipment | 26 | 18 | 10 |
Struck by powered vehicle--nontransport | 11 | 8 | 5 |
Struck by falling object or equipment--other than powered vehicle | 13 | 9 | 5 |
Footnotes: | |||
NOTE: Data for all years are final. Totals for major categories may include subcategories not shown separately. Percentages may not add to totals because of rounding. CFOI fatality counts exclude illness-related deaths unless precipitated by an injury event. Dashes indicate no data reported or data that do not meet publication criteria. | |||
| Industry (1) | 2015 | 2016 | |
|---|---|---|---|
| Number | Number | Percent | |
Total | 150 | 174 | 100 |
Private industry | 132 | 155 | 89 |
Natural resources and mining | 20 | 17 | 10 |
Agriculture, forestry, fishing and hunting | 20 | 16 | 9 |
Crop production | 11 | 6 | 3 |
Animal production and aquaculture | -- | 3 | 2 |
Forestry and logging | 3 | 3 | 2 |
Logging | 3 | 3 | 2 |
Fishing, hunting and trapping | 5 | 3 | 2 |
Fishing | 5 | 3 | 2 |
Support activities for agriculture and forestry | -- | 1 | 1 |
Support activities for crop production | -- | 1 | 1 |
Mining, quarrying, and oil and gas extraction (2) | -- | 1 | 1 |
Mining (except oil and gas) | -- | 1 | 1 |
Nonmetallic mineral mining and quarrying | -- | 1 | 1 |
Construction | 30 | 30 | 17 |
Construction of buildings | 10 | 4 | 2 |
Residential building construction | 7 | 3 | 2 |
Heavy and civil engineering construction | 3 | 3 | 2 |
Highway, street, and bridge construction | 1 | 2 | 1 |
Specialty trade contractors | 17 | 22 | 13 |
Foundation, structure, and building exterior contractors | 8 | 9 | 5 |
Building equipment contractors | 4 | -- | -- |
Building finishing contractors | 3 | 5 | 3 |
Other specialty trade contractors | 2 | 6 | 3 |
Manufacturing | 15 | 11 | 6 |
Textile product mills | -- | 2 | 1 |
Textile furnishings mills | -- | 1 | 1 |
Other textile product mills | -- | 1 | 1 |
Chemical manufacturing | 1 | 1 | 1 |
Resin, synthetic rubber, and artificial synthetic fibers and filaments manufacturing | -- | 1 | 1 |
Transportation equipment manufacturing | -- | -- | -- |
Motor vehicle manufacturing | -- | 1 | 1 |
Trade, transportation, and utilities | 28 | 42 | 24 |
Wholesale trade | 3 | 6 | 3 |
Merchant wholesalers, durable goods | -- | 4 | 2 |
Furniture and home furnishing merchant wholesalers | -- | 1 | 1 |
Miscellaneous durable goods merchant wholesalers | 1 | 1 | 1 |
Retail trade | 9 | 11 | 6 |
Motor vehicle and parts dealers | -- | 1 | 1 |
Automobile dealers | -- | 1 | 1 |
Food and beverage stores | 1 | 2 | 1 |
Grocery stores | 1 | 2 | 1 |
Health and personal care stores | 1 | 1 | 1 |
Gasoline stations | 2 | 4 | 2 |
Transportation and warehousing | 16 | 25 | 14 |
Air transportation | -- | 1 | 1 |
Truck transportation | 12 | 17 | 10 |
General freight trucking | 8 | 13 | 7 |
Specialized freight trucking | 4 | 4 | 2 |
Transit and ground passenger transportation | 1 | 5 | 3 |
Taxi and limousine service | -- | 4 | 2 |
Charter bus industry | -- | 1 | 1 |
Information | -- | 1 | 1 |
Publishing industries (except internet) | -- | 1 | 1 |
Newspaper, periodical, book, and directory publishers | -- | 1 | 1 |
Financial activities | 2 | 3 | 2 |
Real estate and rental and leasing | 1 | -- | -- |
Real estate | 1 | -- | -- |
Lessors of real estate | 1 | 1 | 1 |
Professional and business services | 22 | 22 | 13 |
Administrative and waste services | 20 | 22 | 13 |
Administrative and support services | 17 | 19 | 11 |
Employment services | -- | 5 | 3 |
Investigation and security services | -- | 1 | 1 |
Services to buildings and dwellings | 14 | 11 | 6 |
Waste management and remediation services | 3 | 3 | 2 |
Educational and health services | 1 | 4 | 2 |
Health care and social assistance | 1 | 4 | 2 |
Ambulatory health care services | 1 | -- | -- |
Home health care services | -- | 1 | 1 |
Social assistance | -- | 1 | 1 |
Individual and family services | -- | 1 | 1 |
Leisure and hospitality | 4 | 9 | 5 |
Arts, entertainment, and recreation | -- | 4 | 2 |
Amusement, gambling, and recreation industries | -- | 2 | 1 |
Other amusement and recreation industries | -- | 2 | 1 |
Accommodation and food services | 4 | 5 | 3 |
Food services and drinking places | 3 | 5 | 3 |
Other services, except public administration | 8 | 16 | 9 |
Repair and maintenance | 5 | 13 | 7 |
Automotive repair and maintenance | 4 | 9 | 5 |
Commercial machinery repair and maintenance | -- | 3 | 2 |
Personal and household goods repair and maintenance | -- | 1 | 1 |
Personal and laundry services | 2 | 2 | 1 |
Personal care services | 2 | 1 | 1 |
Other personal services | -- | 1 | 1 |
Government (3) | 18 | 19 | 11 |
Federal government | 7 | 8 | 5 |
Local government | 7 | 10 | 6 |
Footnotes: | |||
NOTE: Data for all years are final. Totals for major categories may include subcategories not shown separately. Percentages may not add to totals because of rounding. CFOI fatality counts exclude illness-related deaths unless precipitated by an injury event. Dashes indicate no data reported or data that do not meet publication criteria. | |||
| Occupation (1) | 2015 | 2016 | |
|---|---|---|---|
| Number | Number | Percent | |
Total | 150 | 174 | 100 |
Management occupations | 10 | 5 | 3 |
Other management occupations | 9 | 4 | 2 |
Business and financial operations occupations | -- | -- | -- |
Computer and mathematical occupations | -- | -- | -- |
Architecture and engineering occupations | 1 | -- | -- |
Life, physical, and social science occupations | -- | -- | -- |
Community and social service occupations | -- | -- | -- |
Legal occupations | -- | -- | -- |
Education, training, and library occupations | -- | 1 | 1 |
Preschool, primary, secondary, and special education school teachers | -- | 1 | 1 |
Elementary and middle school teachers | -- | 1 | 1 |
Arts, design, entertainment, sports, and media occupations | 2 | 1 | 1 |
Entertainers and performers, sports and related workers | 1 | 1 | 1 |
Athletes, coaches, umpires, and related workers | 1 | 1 | 1 |
Healthcare practitioners and technical occupations | 1 | -- | -- |
Healthcare support occupations | -- | 1 | 1 |
Nursing, psychiatric, and home health aides | -- | 1 | 1 |
Home health aides | -- | 1 | 1 |
Protective service occupations | 5 | 10 | 6 |
Fire fighting and prevention workers | 1 | 2 | 1 |
Firefighters | 1 | 2 | 1 |
Law enforcement workers | 2 | 4 | 2 |
Police officers | 2 | 3 | 2 |
Other protective service workers | -- | 4 | 2 |
Food preparation and serving related occupations | -- | 6 | 3 |
Supervisors of food preparation and serving workers | -- | 4 | 2 |
Building and grounds cleaning and maintenance occupations | 13 | 11 | 6 |
Grounds maintenance workers | 10 | 11 | 6 |
Landscaping and groundskeeping workers | 3 | 5 | 3 |
Tree trimmers and pruners | 7 | 5 | 3 |
Personal care and service occupations | 2 | 3 | 2 |
Personal appearance workers | 2 | 1 | 1 |
Barbers, hairdressers, hairstylists and cosmetologists | 2 | 1 | 1 |
Sales and related occupations | 7 | 12 | 7 |
Supervisors of sales workers | 3 | 6 | 3 |
Retail sales workers | 3 | 4 | 2 |
Cashiers | 2 | 4 | 2 |
Sales representatives, services | -- | 1 | 1 |
Office and administrative support occupations | 3 | -- | -- |
Farming, fishing, and forestry occupations | 13 | 11 | 6 |
Agricultural workers | 6 | 6 | 3 |
Fishing and hunting workers | 5 | 3 | 2 |
Construction and extraction occupations | 28 | 30 | 17 |
Supervisors of construction and extraction workers | 7 | 2 | 1 |
Construction trades workers | 18 | 27 | 16 |
Carpenters | -- | 4 | 2 |
Construction laborers | 5 | 8 | 5 |
Construction equipment operators | 2 | 1 | 1 |
Roofers | -- | 6 | 3 |
Installation, maintenance, and repair occupations | 13 | 25 | 14 |
Supervisors of installation, maintenance, and repair workers | -- | 3 | 2 |
Vehicle and mobile equipment mechanics, installers, and repairers | 5 | 12 | 7 |
Automotive technicians and repairers | 3 | 6 | 3 |
Automotive service technicians and mechanics | -- | 5 | 3 |
Small engine mechanics | 1 | -- | -- |
Motorcycle mechanics | -- | 1 | 1 |
Miscellaneous vehicle and mobile equipment mechanics, installers, and repairers | -- | 1 | 1 |
Tire repairers and changers | -- | 1 | 1 |
Other installation, maintenance, and repair occupations | 4 | 9 | 5 |
Production occupations | 11 | 4 | 2 |
Transportation and material moving occupations | 35 | 44 | 25 |
Air transportation workers | -- | 2 | 1 |
Aircraft pilots and flight engineers | -- | 2 | 1 |
Commercial pilots | -- | 2 | 1 |
Motor vehicle operators | 29 | 37 | 21 |
Bus drivers | -- | 1 | 1 |
Bus drivers, transit and intercity | -- | 1 | 1 |
Driver/sales workers and truck drivers | 28 | 31 | 18 |
Driver/sales workers | 3 | 2 | 1 |
Heavy and tractor-trailer truck drivers | 21 | 25 | 14 |
Light truck or delivery services drivers | 4 | 4 | 2 |
Taxi drivers and chauffeurs | 1 | 4 | 2 |
Material moving workers | 5 | 5 | 3 |
Industrial truck and tractor operators | -- | 3 | 2 |
Military specific occupations (2) | -- | -- | -- |
Footnotes: | |||
NOTE: Totals for major categories may include subcategories not shown separately. Percentages may not add to totals because of rounding. CFOI fatality counts exclude illness-related deaths unless precipitated by an injury event. Dashes indicate no data reported or data that do not meet publication criteria. | |||
| Worker characteristics | 2015 | 2016 | |
|---|---|---|---|
| Number | Number | Percent | |
Total | 150 | 174 | 100 |
Employee status | |||
Wage and salary workers (1) | 112 | 151 | 87 |
Self-employed (2) | 38 | 23 | 13 |
Gender | |||
Men | 142 | 156 | 90 |
Women | 8 | 18 | 10 |
Age (3) | |||
16 to 17 years | -- | 1 | 1 |
20 to 24 years | 4 | 19 | 11 |
25 to 34 years | 22 | 23 | 13 |
35 to 44 years | 35 | 36 | 21 |
45 to 54 years | 35 | 41 | 24 |
55 to 64 years | 33 | 35 | 20 |
65 years and over | 17 | 18 | 10 |
Race or ethnic origin (4) | |||
White, non-Hispanic | 101 | 110 | 63 |
Black or African-American, non-Hispanic | 17 | 38 | 22 |
Hispanic or Latino | 17 | 19 | 11 |
Asian, non-Hispanic | 7 | 5 | 3 |
Footnotes: | |||
NOTE: Data for all years are final. Totals for major categories may include subcategories not shown separately. Percentages may not add to totals because of rounding. CFOI fatality counts exclude illness-related deaths unless precipitated by an injury event. Dashes indicate no data reported or data that do not meet publication criteria. | |||
Last Modified Date: Friday, February 23, 2018